Proceeding Paper

Reinforcement Learning for UAV Path Planning Under Complicated Constraints with GNSS Quality Awareness †

1
Centre for Autonomous and Cyberphysical Systems, Cranfield University, Bedford MK43 0AL, UK
2
Spirent Communications PLC, Devon TQ4 7QR, UK
*
Author to whom correspondence should be addressed.
Presented at the European Navigation Conference 2024, Noordwijk, The Netherlands, 22–24 May 2024.
Eng. Proc. 2025, 88(1), 66; https://doi.org/10.3390/engproc2025088066
Published: 25 June 2025
(This article belongs to the Proceedings of European Navigation Conference 2024)

Abstract

Requirements for Unmanned Aerial Vehicle (UAV) applications in low-altitude operations are escalating, which demands resilient Position, Navigation and Timing (PNT) solutions incorporating global navigation satellite system (GNSS) services. However, UAVs often operate in stringent environments with degraded GNSS performance. Practical challenges often arise from dense, dynamic, complex, and uncertain obstacles. When flying in complex environments, it is important to consider signal degradation caused by reflections (multipath) and obscuration (Non-Line of Sight (NLOS)), which can lead to positioning errors that must be minimized to ensure mission reliability. Recent works integrate GNSS reliability maps derived from pseudorange error estimations into path planning to reduce loss-of-GNSS risks with PNT degradations. To accommodate multiple constraint conditions attempting to improve flight resilience against GNSS-degraded environments, this paper proposes a reinforcement learning (RL) approach to feature GNSS signal quality awareness during path planning. The non-linear relations between GNSS signal quality in the form of dilution of precision (DoP), geographic locations, and the policy of searching sub-minima points are learned by the clipped Proximal Policy Optimization (PPO) method. Other constraints considered include static obstacle occurrence, altitude boundary, forbidden flying regions, and operational volumes. The reward and punishment functions and the training method are designed to maximize the success criteria of approaching destinations. The proposed RL approach is demonstrated using a real 3D map of Indianapolis, USA, in the Godot engine, incorporating forecasted DoP data generated by a Geospatial Augmentation system named GNSS Foresight from Spirent. Results indicate a 36% enhancement in mission success rates when GNSS performance is included in the path planning training. Additionally, the varying tensor size, representing the UAV’s DoP perception range, exhibits a positive proportion relation to a higher mission rate, despite an increment in computational complexity.

1. Introduction

Facilitated by inherent features, e.g., high mobility and convenient deployment, Unmanned Aerial Vehicles (UAVs) have drawn tremendous attention in recent decades in boosting applications including search and rescue, agriculture, package delivery, and surveillance operations [1,2]. Given that most of today’s UAV navigation systems rely significantly on global navigation satellite system (GNSS) services, the degradation and outages in GNSS, such as when operating in deep urban canyons, are outstanding factors in yielding localization accuracy to cause flight incidents. Providing the GNSS vulnerability, the sufficient utilization of GNSS awareness estimation during path planning becomes crucial in enhancing flight safety by assuring the desired accuracy level and yielding positioning uncertainties.
The quality of service (QoS) indicator in the GNSS system commonly uses dilution of precision (DoP) of GNSS satellites calculated by position estimation error covariance. When signal reflections like multipath and non-line-of-sight (NLOS) exist in the propagation, the pseudorange measurement produces errors. It increases covariance values to cause DoP degradation with increased numbers. The definition and calculation of QoS parameters, including availability, accuracy, reliability, and continuity using DoP are conducted in [3]. Oriented from DoP, GNSS reliability map [4], localization error map [5], and stochastic reachability analysis [6] are derived to support awareness of GNSS quality within a region.
Incorporating GNSS quality in path planning [7] or task allocation [8] anticipates facilitating avoiding high-risk areas with poor DoP to minimize the risk of position degradation. It is noted that incorporating DoP factors requires considerable parameter tuning to avoid failure of mission integrity because of the changeable geometry of the satellites in view. Typical path planning algorithms like Dijkstra’s algorithm, A* algorithm, genetic algorithm, and particle swarm optimization algorithms have been developed to optimize the vehicle path with the maintenance of position estimation uncertainty and minimization of path length. Nevertheless, the main challenge is how to sacrifice the intended path because of apparent GNSS properties and constraints along the route for assuring mission reliability, which essentially is to leverage multiple environmental constraints, including GNSS performance factors during path planning. Consequently, the above challenge motivates the exploitation of learning-based methods widely used for classification and detection applications [9,10].
To tackle multiconstraint optimization problems in 3D space movements, this paper proposes a reinforcement learning (RL) method consisting of multiple considerations such as GNSS performance, control constraints, static obstacle avoidance, and geographical constraints. The training and testing datasets are generated by Spirent’s GNSS Foresight service, capable of providing performance analysis of the best and worst case GNSS performance or operations and planning [11,12]. Facilitated by the designed learning policy, the trajectory is generated with the shortest path policy at low GNSS failure possibilities. The clipped particle swarm optimization (PSO) is developed due to its direct optimization of policy determination to maximize the cumulative expected rewards, hereby the DoP representation, geographic information, obstacle avoidance strategy, and the policy of searching sub-minima points are learned automatically using gradient descent to leverage the first-order derivatives in each iteration from an environment engine.

2. Methodology

The goal of this study is to train an agent to learn action strategies from awareness of surroundings, including GNSS quality information, to maximize the reward values using clipped PPO methodology. The overall architecture of the proposed path planning approach is illustrated in Figure 1. The GNSS quality information is retrieved from the GNSS quality dataset in terms of DoP, which is generated by Spirent’s GNSS Foresight system, representing the accuracy of the positioning data replicated by simulating the geometry of all visible satellites at a point over time. The PPO works to identify the largest cumulative rewards and select the optimal action from the reward and penalty conditions. The implementation is completed in the Godot game engine, and the agent model selects 3D model of a quadcopter UAV using a point mass model.

2.1. Rewards/Penalties Formulation

  • Distance Reward
The distance reward R g stimulates the agent to move closer to the destination. To avoid getting stuck in local minima surrounded by obstacles or DoP constraints, this reward policy allows a step backwards without penalty.
R g = d g × μ d , d g 0 0 , d g < 0
where d g represents the deviation of the distance to the goal, and μ d is a scaling factor so that the agent obtains higher rewards when reaching closer to the goal points.
  • Arrival Reward
The arrival reward R a provides high positive feedback to stimulate approaching the destination area:
R a = r a , D g S d 0 , o t h e r w i s e
where r a is the positive large reward if the distance to goal D g is close to a threshold S d , representing the desired success distance to the goal point or degree of accuracy.
  • Dilution of Precision
This work considered DoP as one of the terminal conditions, causing the termination of an episode if breaching poor DoP zones. The agent is rewarded or penalized with a higher volume if the DoP reduces or increases by a larger magnitude by comparisons with a threshold d o p t h r e s . To facilitate learning continuity feature from the DoP trait, the DoP penalty R d o p is formulated by
R d o p = r d o p × Δ d o p , Δ d o p < 0 r d o p × Δ d o p , Δ d o p 0 r d o p f a i l , d o p v a l u e > d o p t h r e s 0 , d o p v a l u e d o p t h r e s
where r d o p is a positive iterative reward; r d o p f a i l is the penalty for dop value going above d o p t h r e s ; and Δ d o p is the dop deviation between the current frame and the predicted frame.
  • No-Fly Zone
No-Fly Zones (NFZs) are represented as typical geographical restriction sites such as airports and other critical infrastructure. The agent gets a penalty when a breach event happens. Therefore, the NFZ penalty R n f z is formulated as
R n f z = r n f z , A n f z = 1 0 , A n f z = 0
where r n f z is the penalty value for breaching the NFZ area, and A n f z = 1 stands for detection of a breach event.
  • Obstacle Avoidance
The obstacle avoidance in this work primarily stands for avoiding collision with building blocks and flying at a safe distance, abiding by regulations.
R o b j = r H I T , D o b j < D o b j t h r e s 0 , o t h e r w i s e
where r H I T is the penalty for colliding with obstacles; D o b j denotes the distance between agent and the sensed obstacles; and D o b j t h r e s is the safe flying distance threshold.
  • Altitude Restriction
To satisfy the maximum flying altitude following regulatory considerations, the altitude restriction reward formulation R a l t penalizes that the movement bleaches the allowed maximum height.
R a l t = r a l t , h a l t > h l i m i t 0 , O a l t = 0
where r a l t is the penalty issued to the agent if the current flying height h a l t exceeds the maximum limit h l i m i t .
  • Timeout Penalty
Because of the allowance of stepping backwards in the distance reward function, there is a possibility that the flight will get stuck in a loop infinitely, which shall be terminated by a timeout limit. This timeout limit penalty also encourages the agent to get to the goal point as fast as possible, thus reducing the time of arrival and aiding convergence. Therefore, the timeout penalty R t i m e function is formulated:
R t i m e = r T m a x , t T m a x r T f r a m e × t , o t h e r w i s e
where r T m a x is the penalty given to the agent if the flying time t exceeds the limit T m a x , and r T f r a m e denotes the penalty at each timestep to penalize the agent if it does not reach the goal point.
  • Out-of-Bounds Restriction
The operation zone boundary is modeled as an out-of-bounds restriction to avoid flying beyond the region of interest. Similar to NFZ restriction, the out-of-bounds penalty function is computed by
R o b = r O B , A O B = 1 0 , A O B = 0
where r O B is the penalty value for breaching the target area, and A O B = 1 stands for detection of a breach event.

2.2. Observation Methods

The following sensors or methods are developed to collect the required observations.
  • Raycast3D sensor
Raycast3D sensor casts out a ray of a specific length from the agent location to detect whether any collisions with physical objects or areas in its path. The obstacle avoidance reward R o b j is hereby calculated from the output of this sensor to guarantee a safety margin.
  • Reading data from the environment’s physics engine.
The goal position, UAV position, UAV velocity, and the boundary of the operational volume are obtained by directly reading information from the environment’s physics engine. Specifically, distance reward, arrival reward, restrictions of NFZs, and altitude are calculated from this method with respect to the target endpoint location, UAV velocity, and position of the operational volume boundary.
  • DoP predictor
To sense and sample the surrounding DoP values, a predictor is developed with the main principle of looking up DoP values from current UAV positions in global coordinates. Given the discrete DoP maps, a tensor is created to interpolate DoP at the current UAV position to achieve high resolutions and better understand DoP tracing. For example, a tensor of size 27 contains DoP information for a 3 m × 3 m × 3 m volume of points that include the UAV’s current position and its nearest neighbour in all 3 axes.

3. Experiments and Results

The UAV model applies the point mass model, where the movements are restricted to the translational axes only, meaning UAVs have three degrees of freedom in the x, y, and z directions without rotations. A 3D model of a quadcopter UAV is imported into Blender, where it is then converted into a 3D object, imported into the Godot game engine, and added into the asset library to be represented within the environment. The RL engine uses Stable-Baselines3 clipped PPO implementations prototyped from [13].

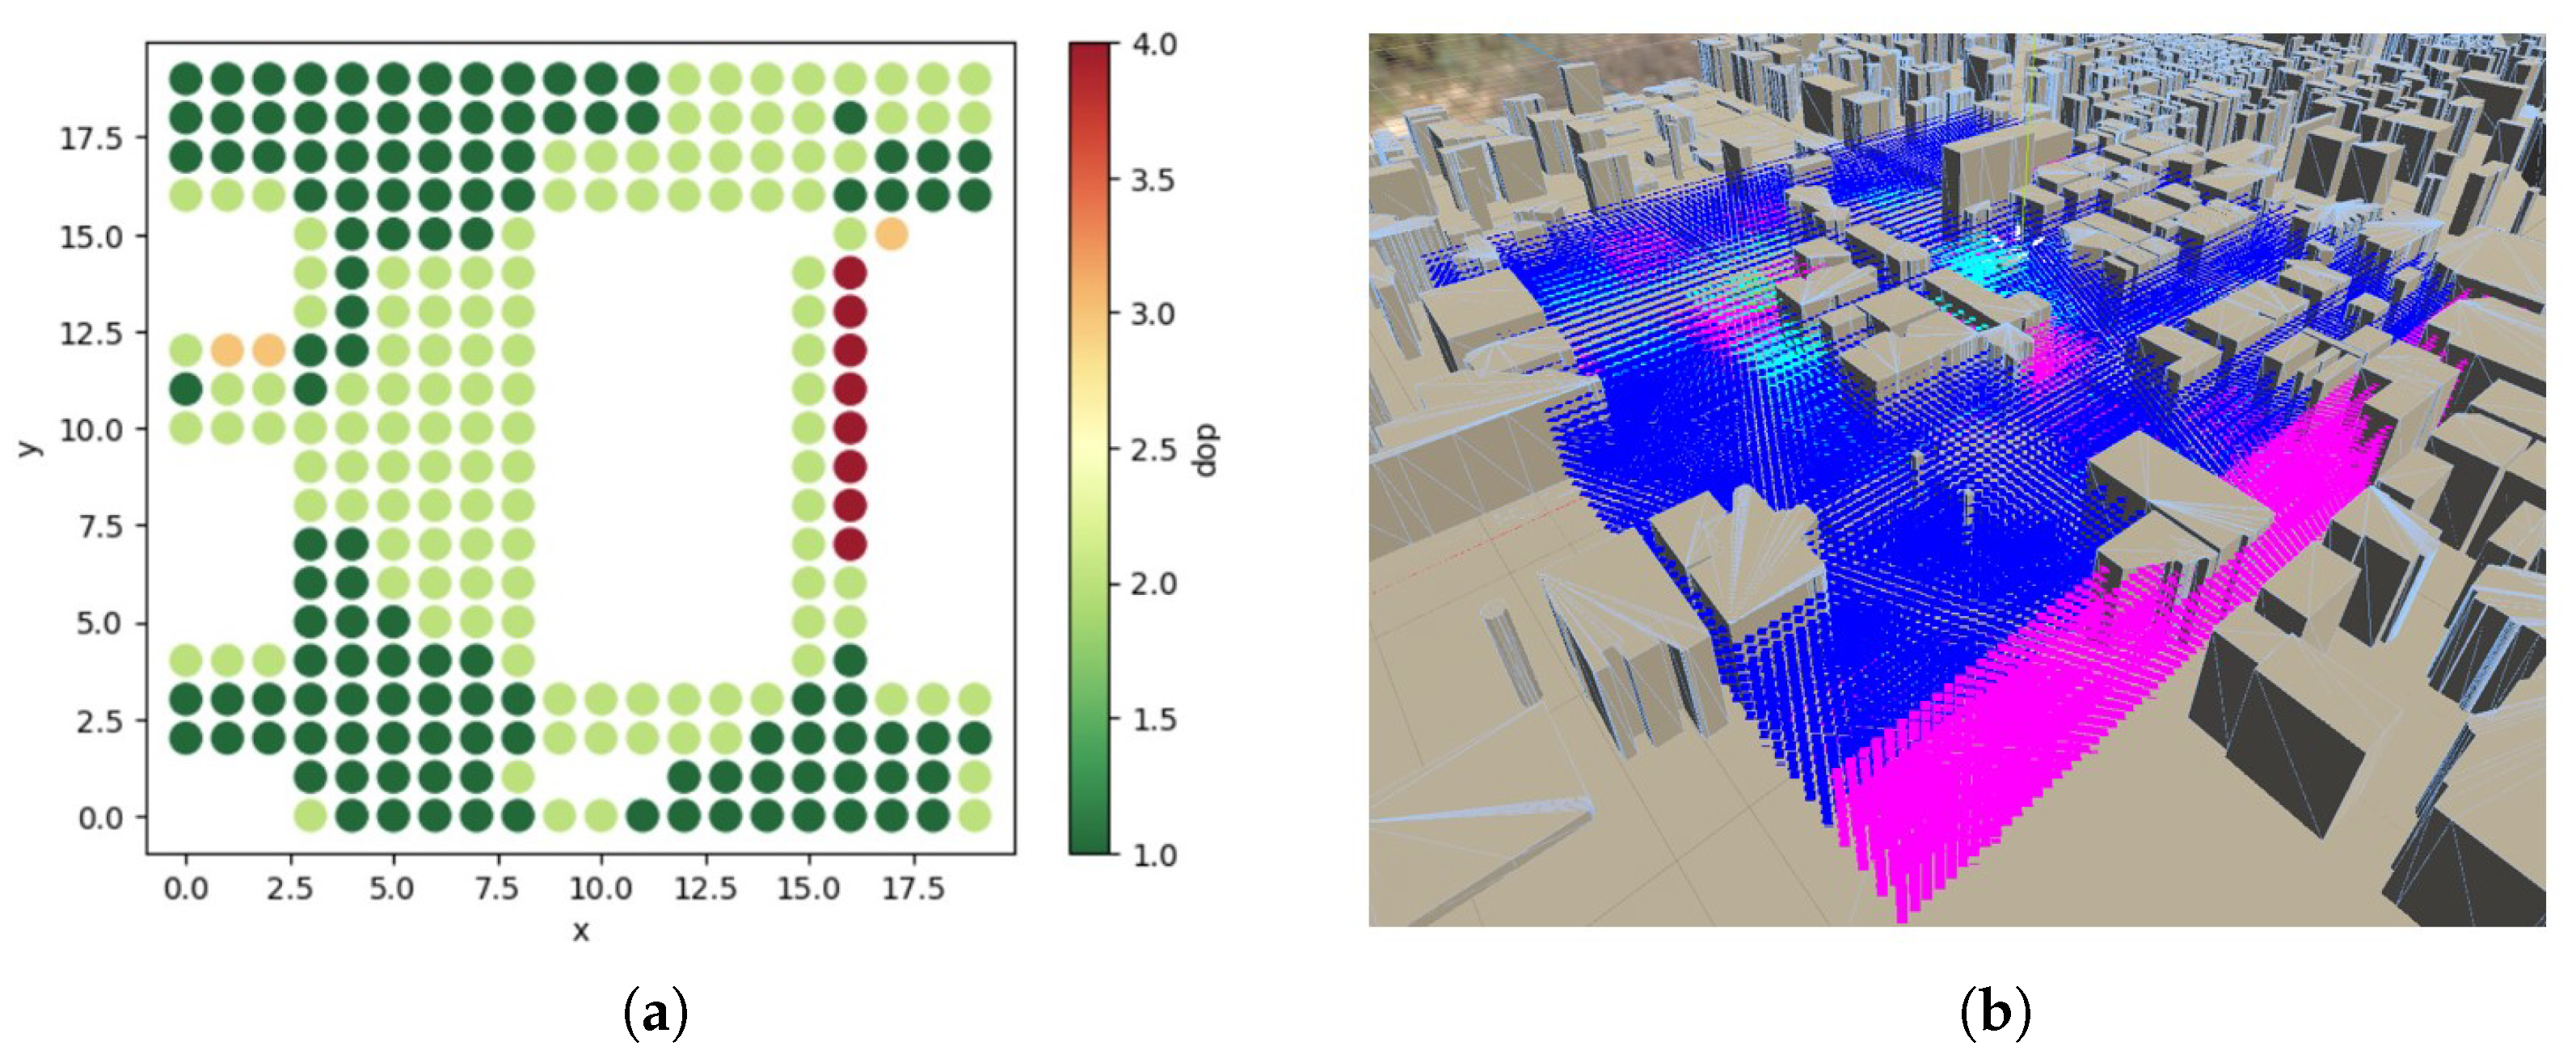
3.1. DoP Representation and Grading

The provided dataset contains information over 24 h on 22 June 2022 starting from 12 am to 11:59 pm, where the time resolution is 1 second and covers a spatial volume of 1 km × 1 km × 100 m at the centre of the city of Indianapolis in the United States. The 1 km squared area is sliced and subdivided into 100 distinct cubes, each covering a volume that is 100 m × 100 m × GR in size, where GR is the height range of the sample, which is also represented by the variable resolution of each grid within the dataset.
A 2D grid of DoP values for a specific point in time is demonstrated in Figure 2a. The 2D grid represents an area with a region size of 100 m × 100 m at a grid resolution of 5 m, meaning that the DoP data shown in each cell is valid for a 5 m × 5 m × 5 m volume of points. The empty areas that can be seen in the figure represent areas that contain no DoP data, either due to the presence of an obstacle, such as a building, or due to the number of visible satellites being fewer than four (NVAS < 4).
The DoP data provided are banded and mapped to simplify the computational complexity, and the mapping strategy is shown in Table 1. For instance, when the PDoP value ranges in [0, 1], this DoP is regarded as the ideal value, where its numerical representation is 0 corresponding to a position error of 0.5 m. After preprocessing and converting the dataset format into the Godot environment, the DoP data and building environment data shall be aligned into the same coordinates by a coordinate transformation from WGS84 coordinates to the world coordinates. Afterward, minor manual manipulations are needed to mitigate data misalignment and scaling issues by the end of generating final representations displayed in Figure 2b.

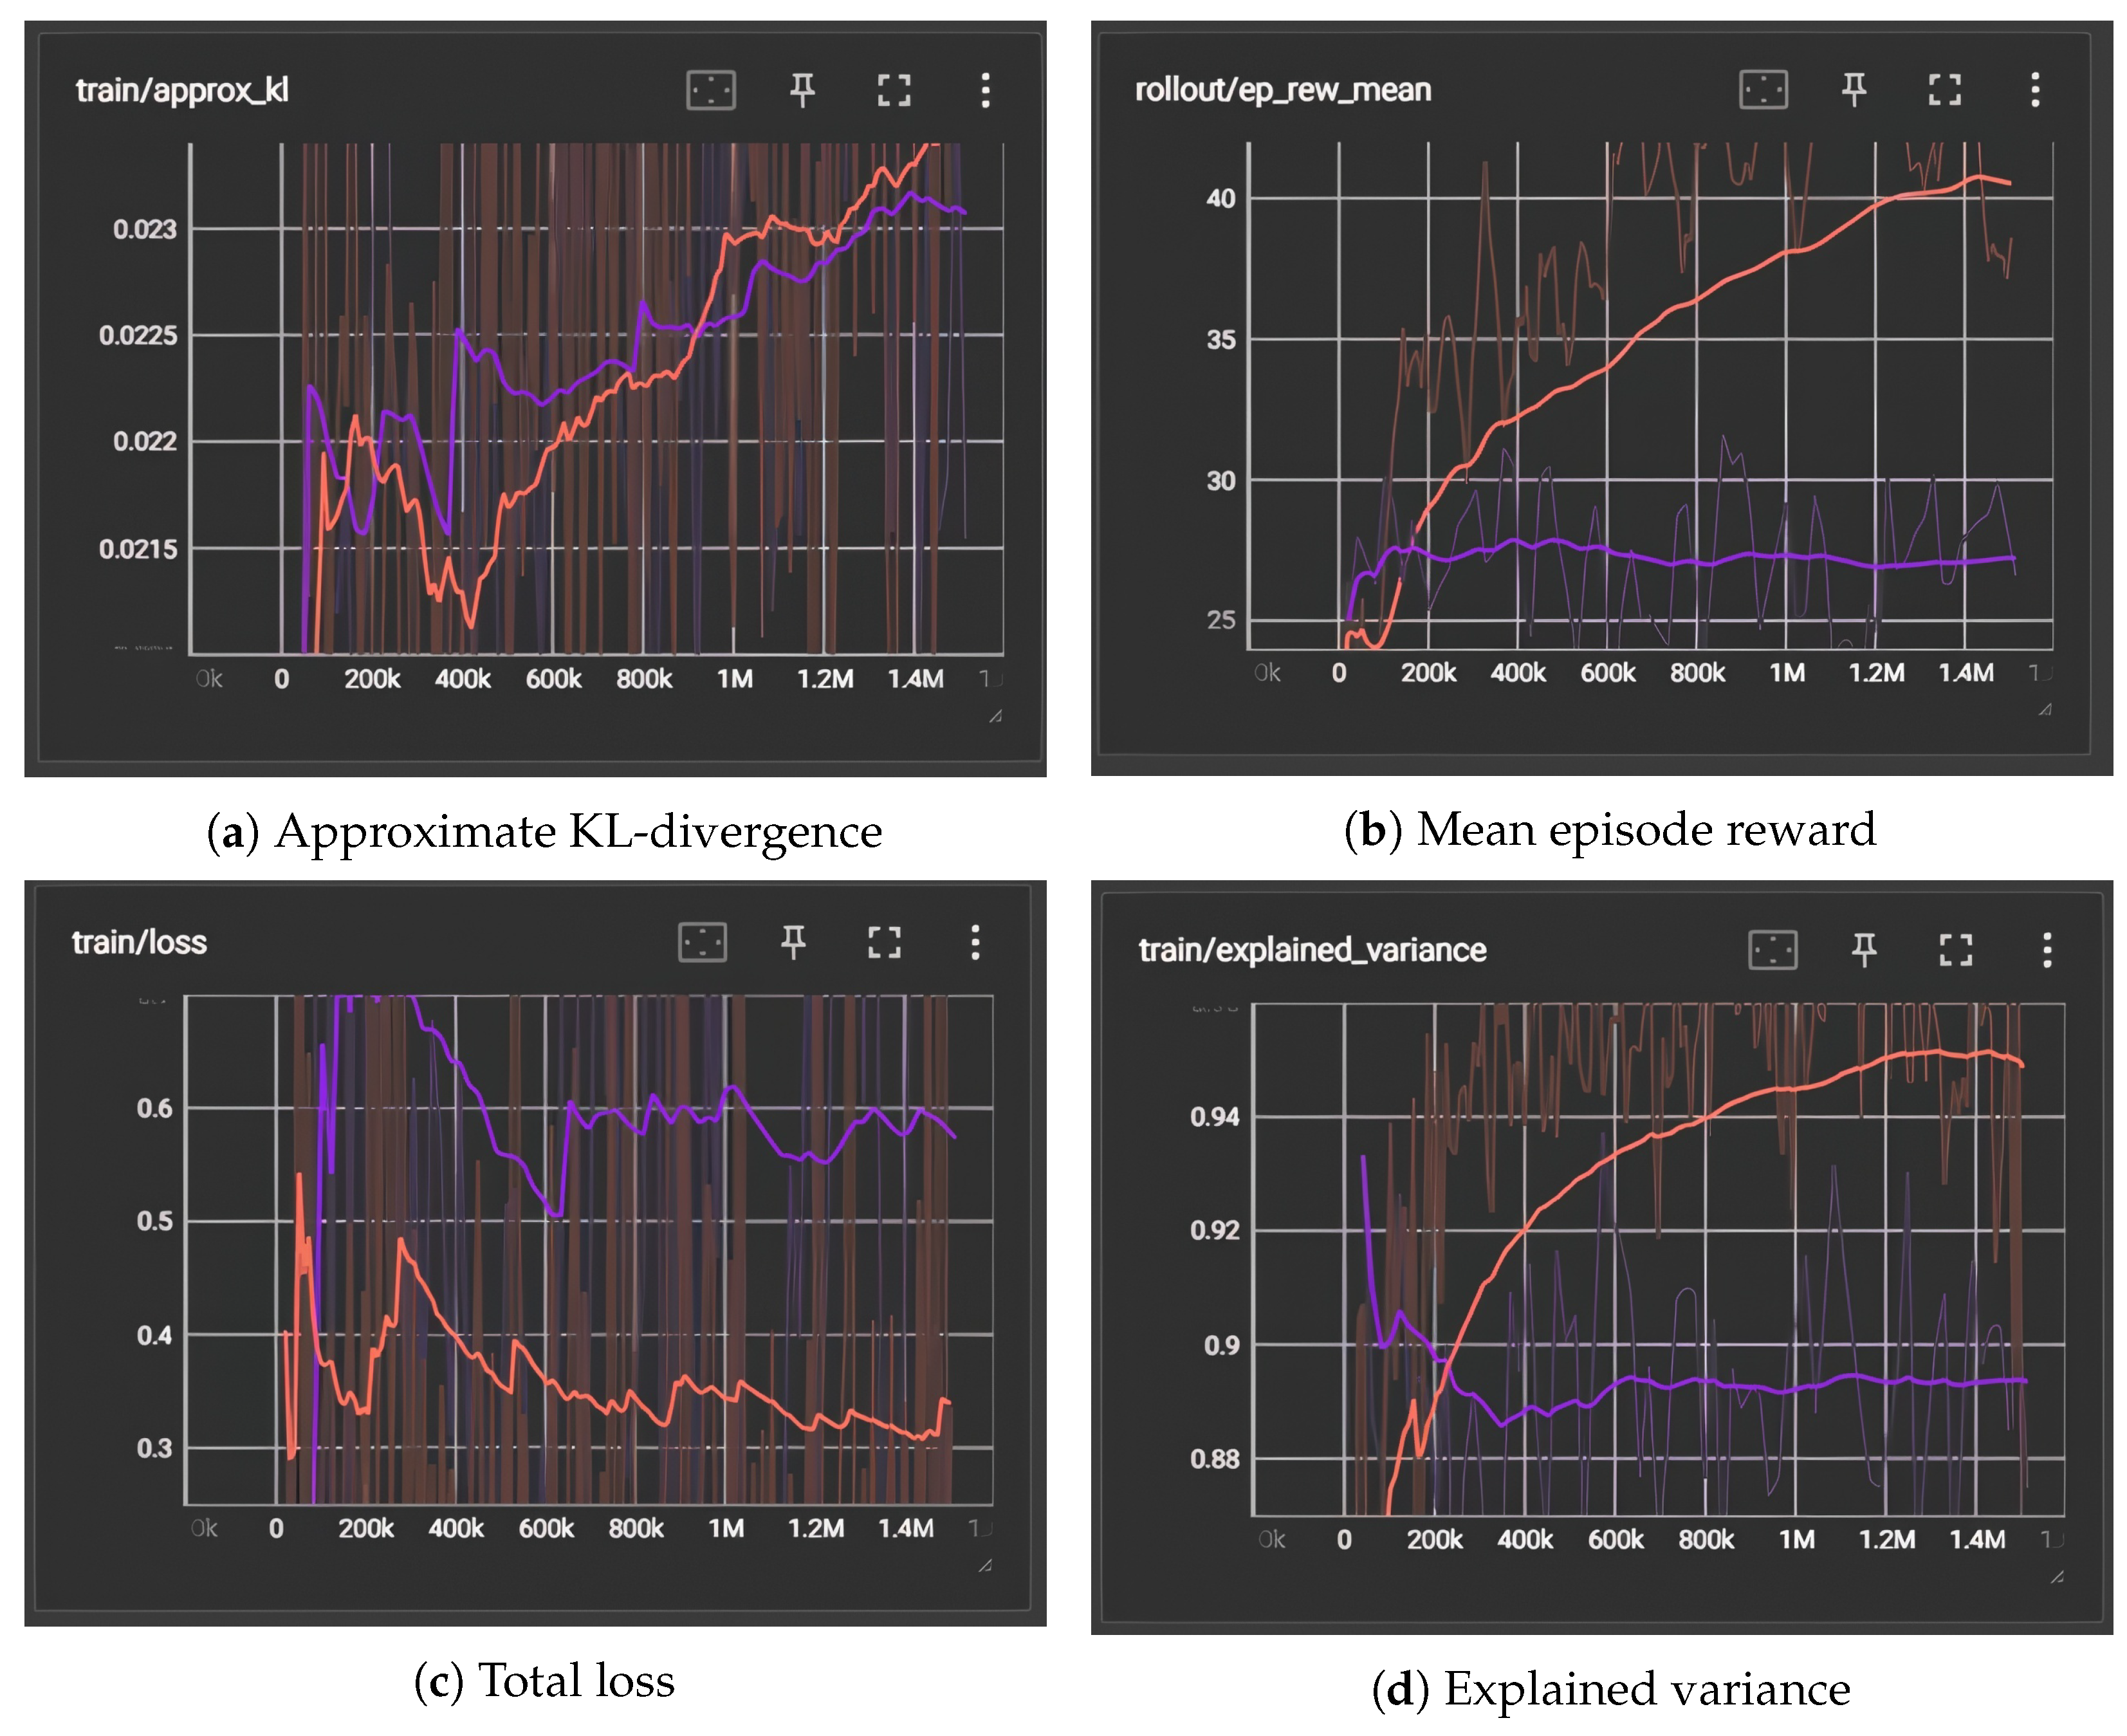
3.2. Training Performance Analysis

For generating a training environment and accelerating the training purposes, a set of 15 goal points are randomly placed around the environment to train the agents along with 15 instances of the agent created in different collision layers. Two fine-tuned sets of configurations are listed in Table 2 for performance comparison purposes, where the significant distinction is the increased DoP tensor size in the second configuration set to enlarge the DoP perception region during the path planning. Other hyperparameter configurations use default values in the SB3’s implementation of PPO [13].
Figure 3 compares the learning outcomes between the fine-tuned configurations in terms of measurements of approximate Kullback–Leibler (KL) divergence, the mean value of episode reward, total loss value and explained variance. From Figure 3a that indicates the update ratio from the old policy to the new policy, the increasing tendency suggests continuous learning behaviours between the two configurations during the training process. However, from Figure 3b, the mean episode reward figure suggests that the first model with short DoP vision finds difficulties in obtaining higher rewards and finding the optimal path since 200k episodes, while the second model presents an increasing capability in enhancing rewards. The priority of the second model versus the first model is also reflected in the total loss values in Figure 3c, providing that the loss of the first model is nearly half of the second model. According to the explained variance Figure 3d, both trained models are capable of predicting environmental rewards at a high rate (over 88%), especially an increment trend in the first model before convergence to 95%.

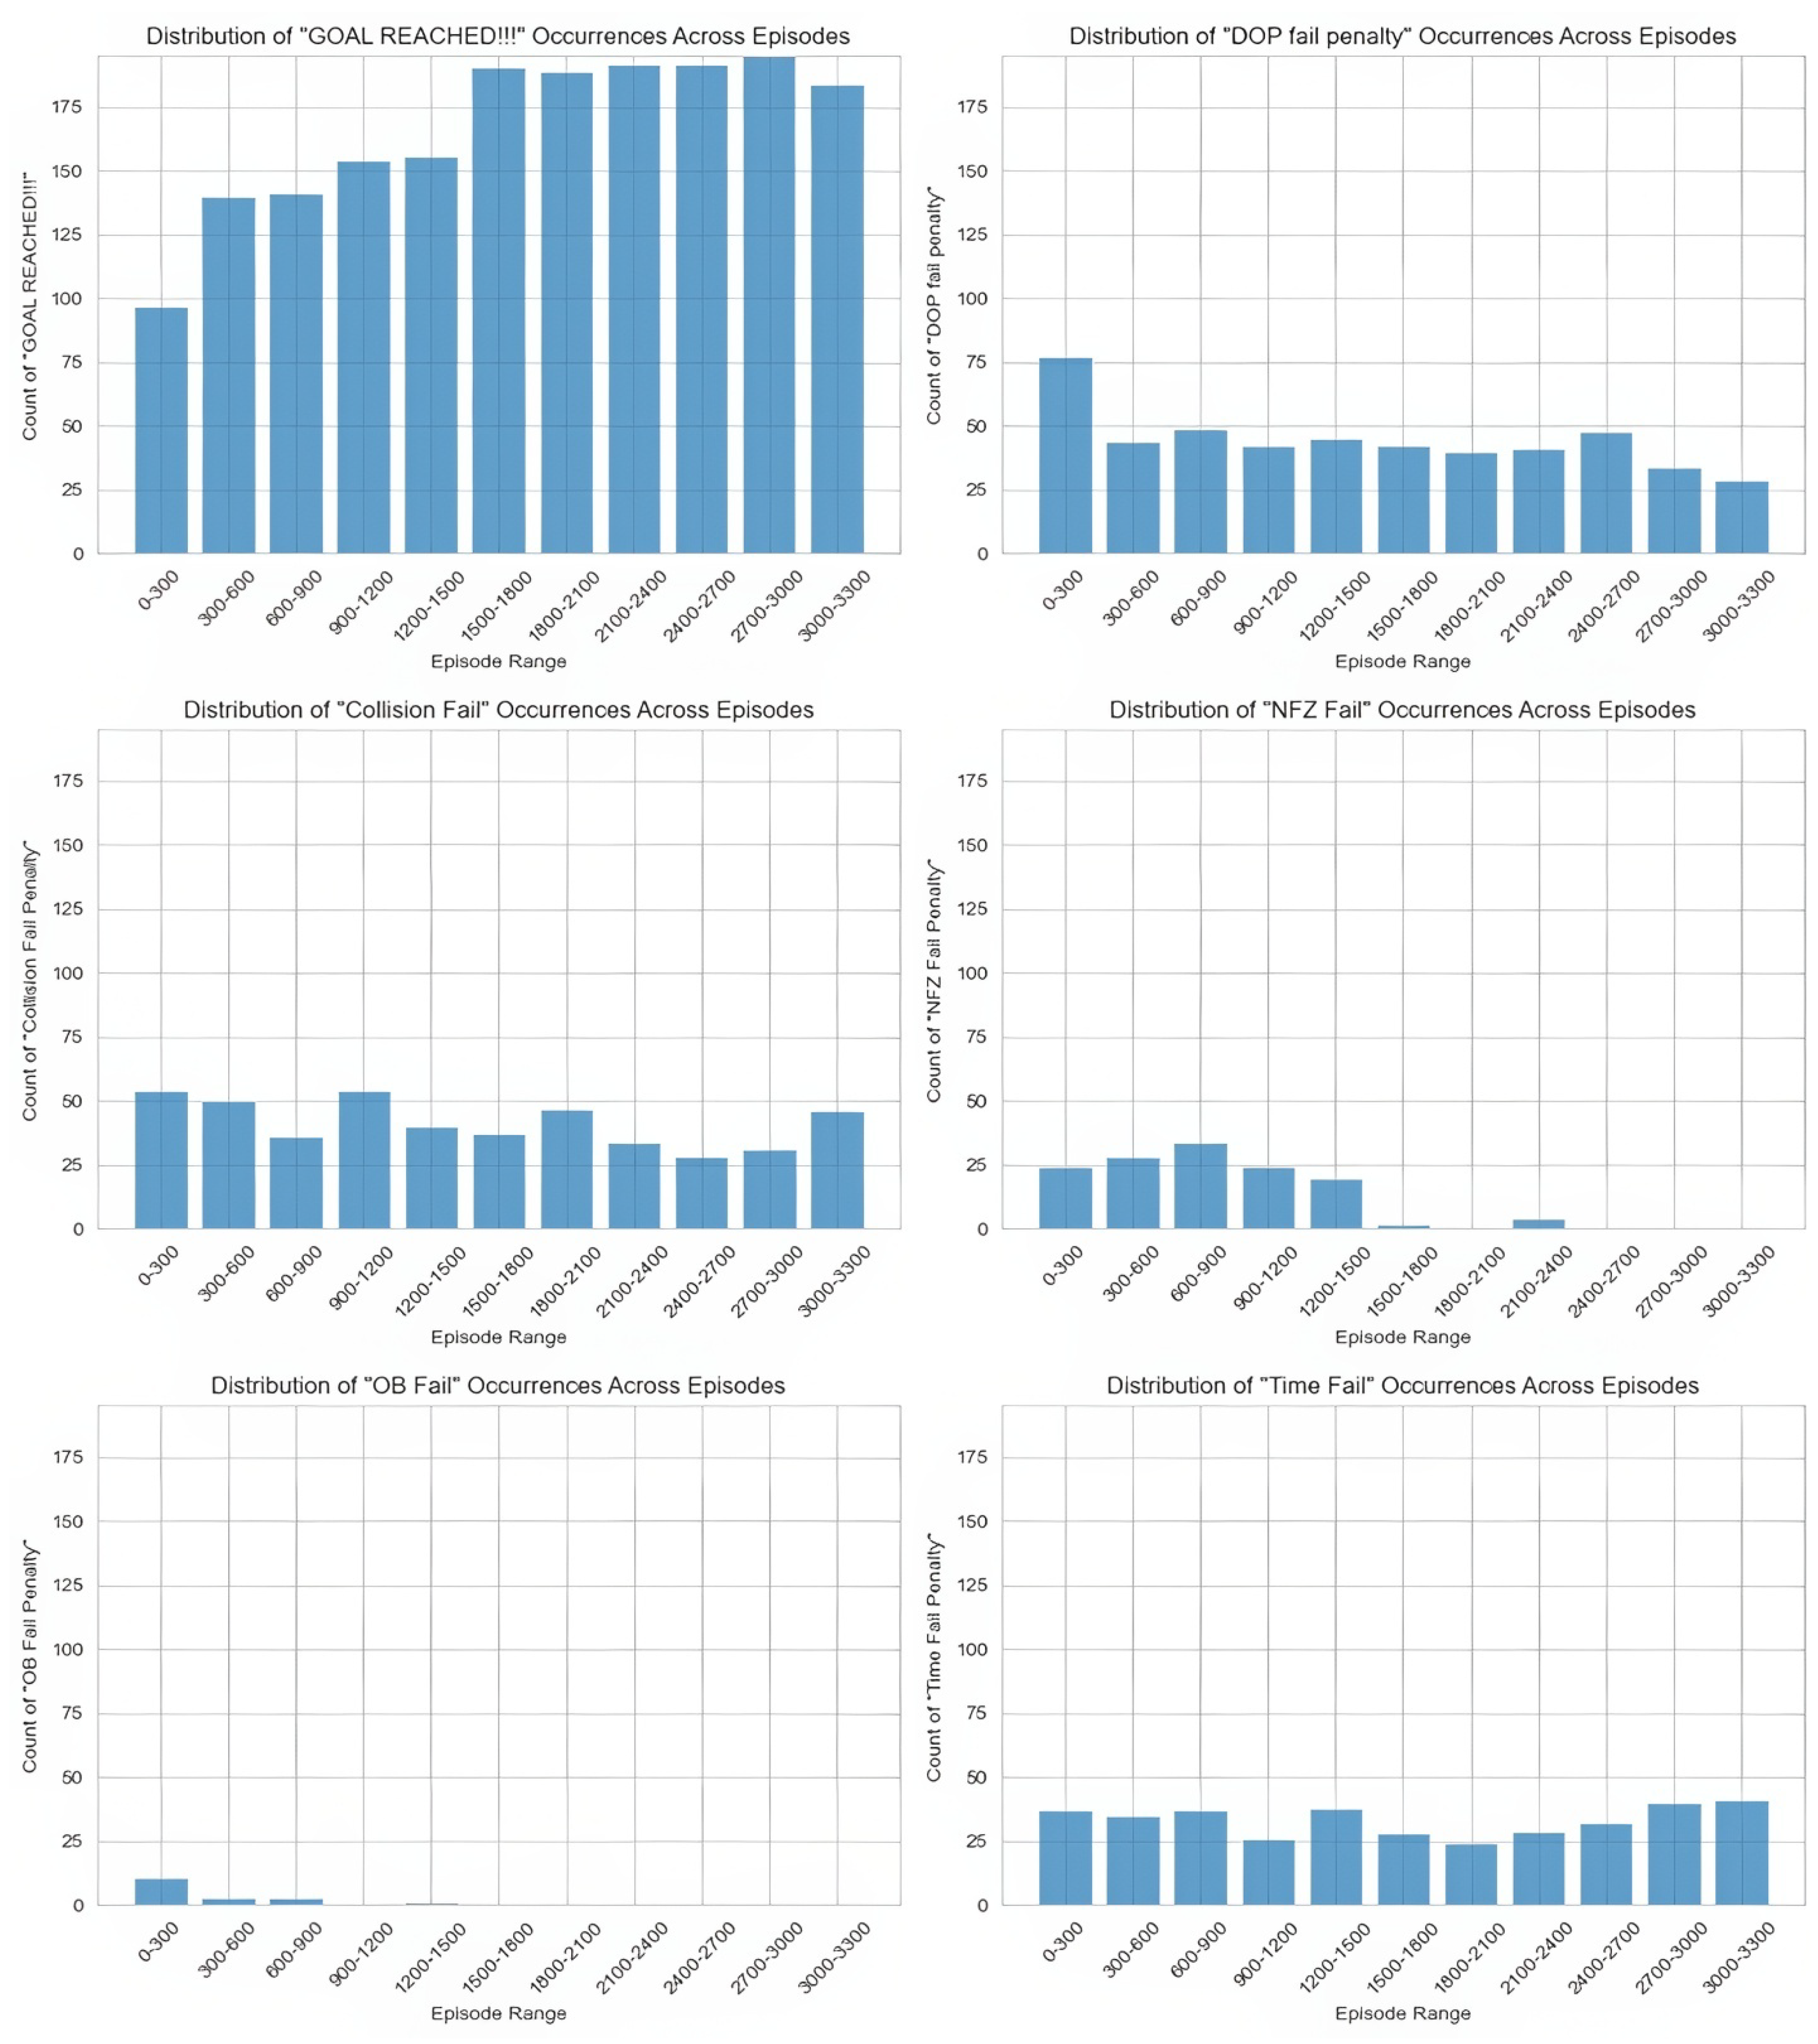
3.3. Success Rate Analysis

The success rate is defined to assess the episodes that reach the target without triggering termination conditions. The Figure 4 summarizes the occurrence of termination conditions over training episodes to analyze the first model’s performance in situational awareness and path planning. The fundamental finding is that the number of successful episodes reaching the target area increases along with episodes, suggesting significant improvement of the proposed method by 80% in situational awareness and path planning. The DoP quality, NFZ avoidance, and out-of-boundary constraints are being satisfied, providing the decline tendency over episodes. The collision probability remains relatively stable due to challenges in understanding complicated environments and obstruction locations. The condition of time termination is also not targeted for improvement as the time factor is excluded in the current reward formulations to maximize the success rate.
Table 3 summarizes the percentage of triggering termination conditions over the two models with distinguished DoP perception region sizes using the testing dataset. It is concluded that both trained models are capable of handling geographic boundary constraints like obstruction condition, altitude condition, boundary, and NFZ conditions at 0% failure probability. The model with a larger DoP perception area facilitates a higher arrival rate and lower DoP value, suggesting the significance of DoP awareness and predictions.

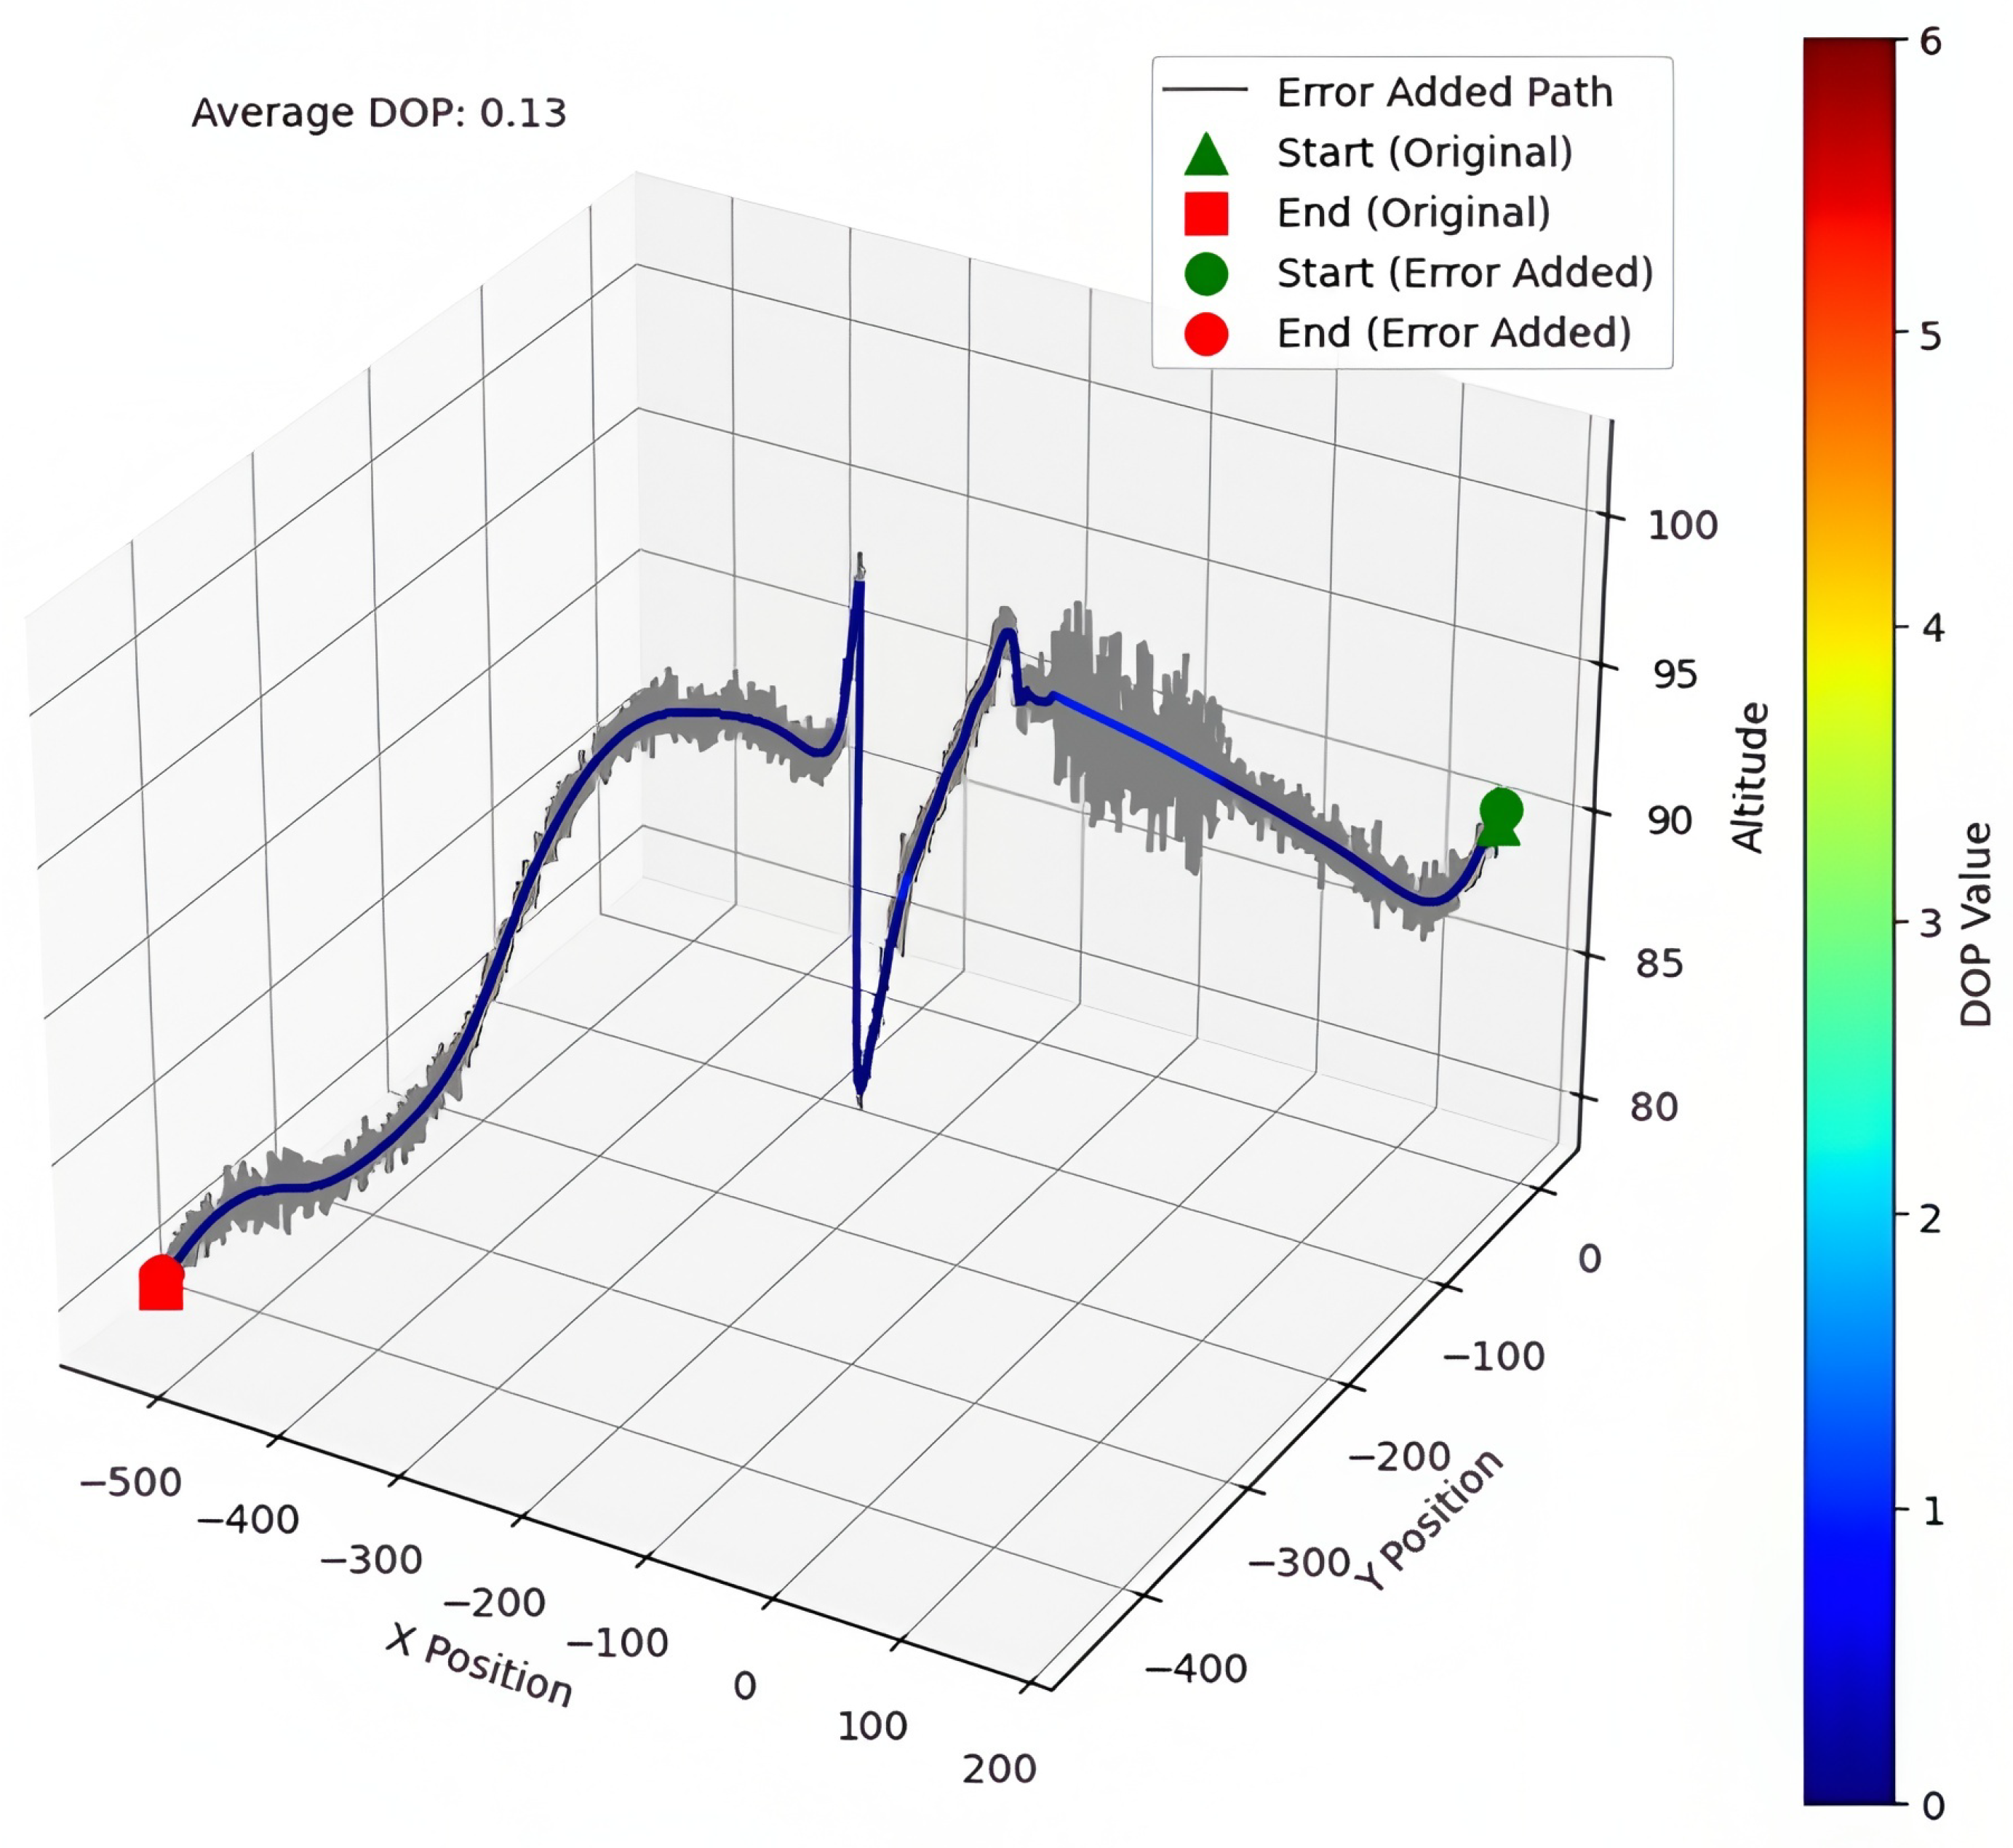
3.4. Position Error Analysis

Given the generated trajectory with DoP awareness capability, the position randomness is injected from the DoP error mapping Table 1 by adding additive errors to the true path generated by the first trained model. Figure 5 presents the trajectory visualisation including position error.
The averaged DoP from the generated trajectory is 0.13, implying the effectiveness of the proposed approach in achieving high GNSS quality during flights. The UAV can automatically adjust the flying altitude and directions in order to search for the optimal path to receive the best quality GNSS.

4. Conclusions

To enhance UAV flight safety by mitigating GNSS position degradation during path planning, this paper adopts a reinforcement learning based path planning approach to tackle multiconstraint optimization problems in 3D space movements. Clipped PSO is developed by incorporating DoP awareness in reward formulations. Apart from distance reward and arrival reward, other constraints are taken into account, e.g., No-Fly Zones, obstacle avoidance, altitude restriction, timeout, and out-of-boundary restrictions. The generated trajectory presents a low mean DoP value of 0.13, implying high satisfaction with GNSS signal quality. It is found that the perception area size of DoP is substantial to obtain a suboptimal trajectory, as predicting the surrounding DoP facilitates the direction of flying zones with high GNSS quality. Specifically, the arrival rate, i.e., mission success rate with larger DoP perception zones of 5 m × 5 m × 5 m outperforms the model with a smaller DoP perception zone of 3 m × 3 m × 3 m by 36%. In commercial aviation, EUROCONTROL commissioned an AUGUR function that predicts GPS integrity and the effect of RAIM availability along the route [14]. The potential impact of this work is generating reliable flight trajectories for UAV operations by preflight GNSS integrity assessment.

Author Contributions

Conceptualization and methodology, A.A., Z.X., I.P. and R.G.; software and validation, A.A., Z.X. and B.P.; data curation, B.P. and R.G.; writing, A.A. and Z.X.; supervision, Z.X., I.P., B.P. and R.G. All authors have read and agreed to the published version of the manuscript.

Funding

This research received no external funding.

Institutional Review Board Statement

Not applicable.

Informed Consent Statement

Not applicable.

Data Availability Statement

The datasets presented in this article are not readily available. Requests to access the datasets should be directed to Spirent Communication UK.

Conflicts of Interest

The authors declare no conflicts of interest. Spirent Communications PLC has no commercial conflict of interest.

References

  1. Tabassum, T.E.; Xu, Z.; Petrunin, I.; Rana, Z.A. Integrating GRU with a Kalman Filter to Enhance Visual Inertial Odometry Performance in Complex Environments. Aerospace 2023, 10, 923. [Google Scholar] [CrossRef]
  2. Yang, Y.; Khalife, J.; Morales, J.J.; Kassas, Z.M. UAV waypoint opportunistic navigation in GNSS-denied environments. IEEE Trans. Aerosp. Electron. Syst. 2021, 58, 663–678. [Google Scholar] [CrossRef]
  3. Karimi, H.A.; Asavasuthirakul, D. A novel optimal routing for navigation systems/services based on global navigation satellite system quality of service. J. Intell. Transp. Syst. 2014, 18, 286–298. [Google Scholar] [CrossRef]
  4. Ragothaman, S.; Maaref, M.; Kassas, Z.M. Autonomous ground vehicle path planning in urban environments using GNSS and cellular signals reliability maps: Simulation and experimental results. IEEE Trans. Aerosp. Electron. Syst. 2021, 57, 2575–2586. [Google Scholar] [CrossRef]
  5. Zhang, G.; Hsu, L.T. A new path planning algorithm using a GNSS localization error map for UAVs in an urban area. J. Intell. Robot. Syst. 2019, 94, 219–235. [Google Scholar] [CrossRef]
  6. Shetty, A.; Gao, G.X. Predicting state uncertainty for GNSS-based UAV path planning using stochastic reachability. In Proceedings of the 32nd International Technical Meeting of the Satellite Division of The Institute of Navigation (ION GNSS+ 2019), Miami, FL, USA, 16–20 September 2019; pp. 131–139. [Google Scholar]
  7. Ru, J.; Yu, H.; Liu, H.; Liu, J.; Zhang, X.; Xu, H. A Bounded Near-Bottom Cruise Trajectory Planning Algorithm for Underwater Vehicles. J. Mar. Sci. Eng. 2022, 11, 7. [Google Scholar] [CrossRef]
  8. Zhang, X.; Liu, H.; Xue, L.; Li, X.; Guo, W.; Yu, S.; Ru, J.; Xu, H. Multi-objective Collaborative Optimization Algorithm for Heterogeneous Cooperative Tasks Based on Conflict Resolution. In Proceedings of the International Conference on Autonomous Unmanned Systems; Springer: Singapore, 2021; pp. 2548–2557. [Google Scholar]
  9. Zhu, A.; Li, J.; Lu, C. Pseudo View Representation Learning for Monocular RGB-D Human Pose and Shape Estimation. IEEE Signal Process. Lett. 2022, 29, 712–716. [Google Scholar] [CrossRef]
  10. Zhu, A.; Li, K.; Wu, T.; Zhao, P.; Hong, B. Cross-Task Multi-Branch Vision Transformer for Facial Expression and Mask Wearing Classification. J. Comput. Technol. Appl. Math. 2024, 1, 46–53. [Google Scholar]
  11. Anyaegbu, E.; Hansen, P. GNSS Performance Evaluation for Deep Urban Environments using GNSS Foresight. In Proceedings of the 35th International Technical Meeting of the Satellite Division of The Institute of Navigation (ION GNSS+ 2022), Denver, CO, USA, 19–23 September 2022; pp. 1127–1136. [Google Scholar]
  12. Anyaegbu, E.; Hansen, P.; Peng, B. Performance Improvement Provided by Global Navigation Satellite System Foresight Geospatial Augmentation in Deep Urban Environments. Eng. Proc. 2023, 54, 58. [Google Scholar]
  13. Raffin, A.; Hill, A.; Gleave, A.; Kanervisto, A.; Ernestus, M.; Dormann, N. Stable-Baselines3: Reliable Reinforcement Learning Implementations. J. Mach. Learn. Res. 2021, 22, 1–8. [Google Scholar]
  14. Harriman, D.A.; Wilde, J.; Ober, P. EUROCONTROL’s predictive RAIM tool for en-route aircraft navigation. In Proceedings of the 1999 IEEE Aerospace Conference. Proceedings (Cat. No. 99TH8403), Snowmass, CO, USA, 7 March 1999; Volume 2, pp. 385–393. [Google Scholar]
Figure 1. Overview of the proposed GNSS quality-awareness-based path planning approach.
Engproc 88 00066 g001
Figure 2. Integration of DoP maps into the Godot environment: (a) Two-dimensional heatmap of DoP values for a 100 m × 100 m area. (b) Banded DoP data representation.
Engproc 88 00066 g002
Figure 3. Performance comparison between distinguished configurations (the red curve stands for the first model, and the purple curve stands for the second one).
Engproc 88 00066 g003
Figure 4. Statistic of termination number over training episodes using the first model.
Engproc 88 00066 g004
Figure 5. Visualized 3D trajectory added with GNSS position error from DoP.
Engproc 88 00066 g005
Table 1. DoP Mapping Table.
PDoP Value
Range
DoP
Representation
DoP Numerical
Representation
Position
Error/m
0–1Ideal00.5
1–2Excellent11.5
2–5Good23.5
5–10Moderate37.5
10–20Fair415
20+Poor530
No DoPNo DoP630
Table 2. Simulation Configuration Setup.
Conf. 1Arrival
Reward
Dist.
Reward
DoP
Penalty
Obstacle
Penalty
Altitude
Penalty
NFZ
Penalty
200.05−10−10−10−10
Bounds
Penalty
Timestep
Penalty
Per Frame
Penalty
Dop
Penalty
DoP
Tensor Size
Entropy
Coefficient
−5−5−0.01−0.0127 m 2
(3 m × 3 m × 3 m)
0.0005
Conf. 2Arrival
Reward
Dist.
Reward
DoP
Penalty
Obstacle
Penalty
Altitude
Penalty
NFZ
Penalty
200.05−7−10−8−8
Bounds
Penalty
Timestep
Penalty
Per Frame
Penalty
Dop
Penalty
DoP
Tensor Size
Entropy
Coefficient
−5−5−0.05−0.07125 m 2
(5 m × 5 m × 5 m)
0.001
Table 3. Testing performance comparison between models with varying DoP perception size.
ConditionDoP Tensor VolumeDoP FailCollision FailArrival Rate
Model 15 m × 5 m × 5 m12%0%63%
Model 23 m × 3 m × 3 m32%0%27%
ConditionAlt LimitOut of BoundsTimeoutNFZ Penalty
Model 10%0%25%0%
Model 20%0%41%0%
Disclaimer/Publisher’s Note: The statements, opinions and data contained in all publications are solely those of the individual author(s) and contributor(s) and not of MDPI and/or the editor(s). MDPI and/or the editor(s) disclaim responsibility for any injury to people or property resulting from any ideas, methods, instructions or products referred to in the content.

