1. Introduction
In an effort to monitor the integrity of Global Navigation Satellite Systems (GNSS), the establishment of a continuous monitoring system is being sought in the public interest to identify and address potential payload errors on the satellites as promptly as possible. The GPS SV-19 event has shown that hardware wear and faults lead to a significant deterioration in the performance of satellites in the navigation solution and should be the subject of monitoring mechanisms [
1]. Misleading effects on the signal, known as evil waveforms (EWFs), have been part of major investigations and have led to the description of three threat models (TMs) for the GPS L1 signal by the International Civil Aviation Organization (ICAO) [
2]. Using Signal Quality Monitoring (SQM), these errors can be identified by testing metrics based on the correlator output against predefined thresholds. The addition of newer signals and systems, making use of other modulation techniques than the Binary Phase Shift Keying (BPSK), has been the subject of multiple studies [
3,
4].
The Federal Agency for Cartography and Geodesy (BKG) has been commissioned to monitor GNSS activity. As part of this, a SQM monitoring system is being developed in cooperation between the University of the Bundeswehr Munich (UniBW) and BKG, making use of a dish antenna of the Geodetic Observatory Wettzell. The main focus is the continuous monitoring of GPS and Galileo signals. The development of a software toolchain for the automated processing of IF samples, making use of the UniBW’s software-defined radio (SDR) MuSNAT [
5], to determine [
6] and analyze key SQM metrics has been shown in previous studies, focusing on GPS L1 CA [
7,
8]. The application of ICAO-defined TMs on synthetically generated signals was successfully tested against the algorithm.
This paper presents the first results of a measurement campaign of selected Galileo satellites for the E1 B signal. Repeated measurements of the same satellites over a two-week time period with a dish antenna will be used to investigate the stability of the metrics for the first time. To this end, signals will be recorded under close to ideal conditions (high
, isolated observations, low interference environment). The aim is to fixate per satellite thresholds for continuous monitoring based on the means, taking into account a fixed false alarm rate with the greatest possible sensitivity to EWF influence. Additionally, a preliminary estimation of the lowest possible observation time is given. The applied threat models are based on the ICAO definition, simplifying the digital distortion (TM-A) and consequently TM-C. Finally, building on the previous study [
8], the usage of the Graphics Processing Unit (GPU) for the correlators is investigated on its dependence on the core and memory clock. To this end, benchmarking in accordance with the guidelines set out in [
9] was conducted. The article finishes with a discussion and conclusion of the results and an outlook for future work.
2. Data Acquisition and Methodology
2.1. Measurement Setup
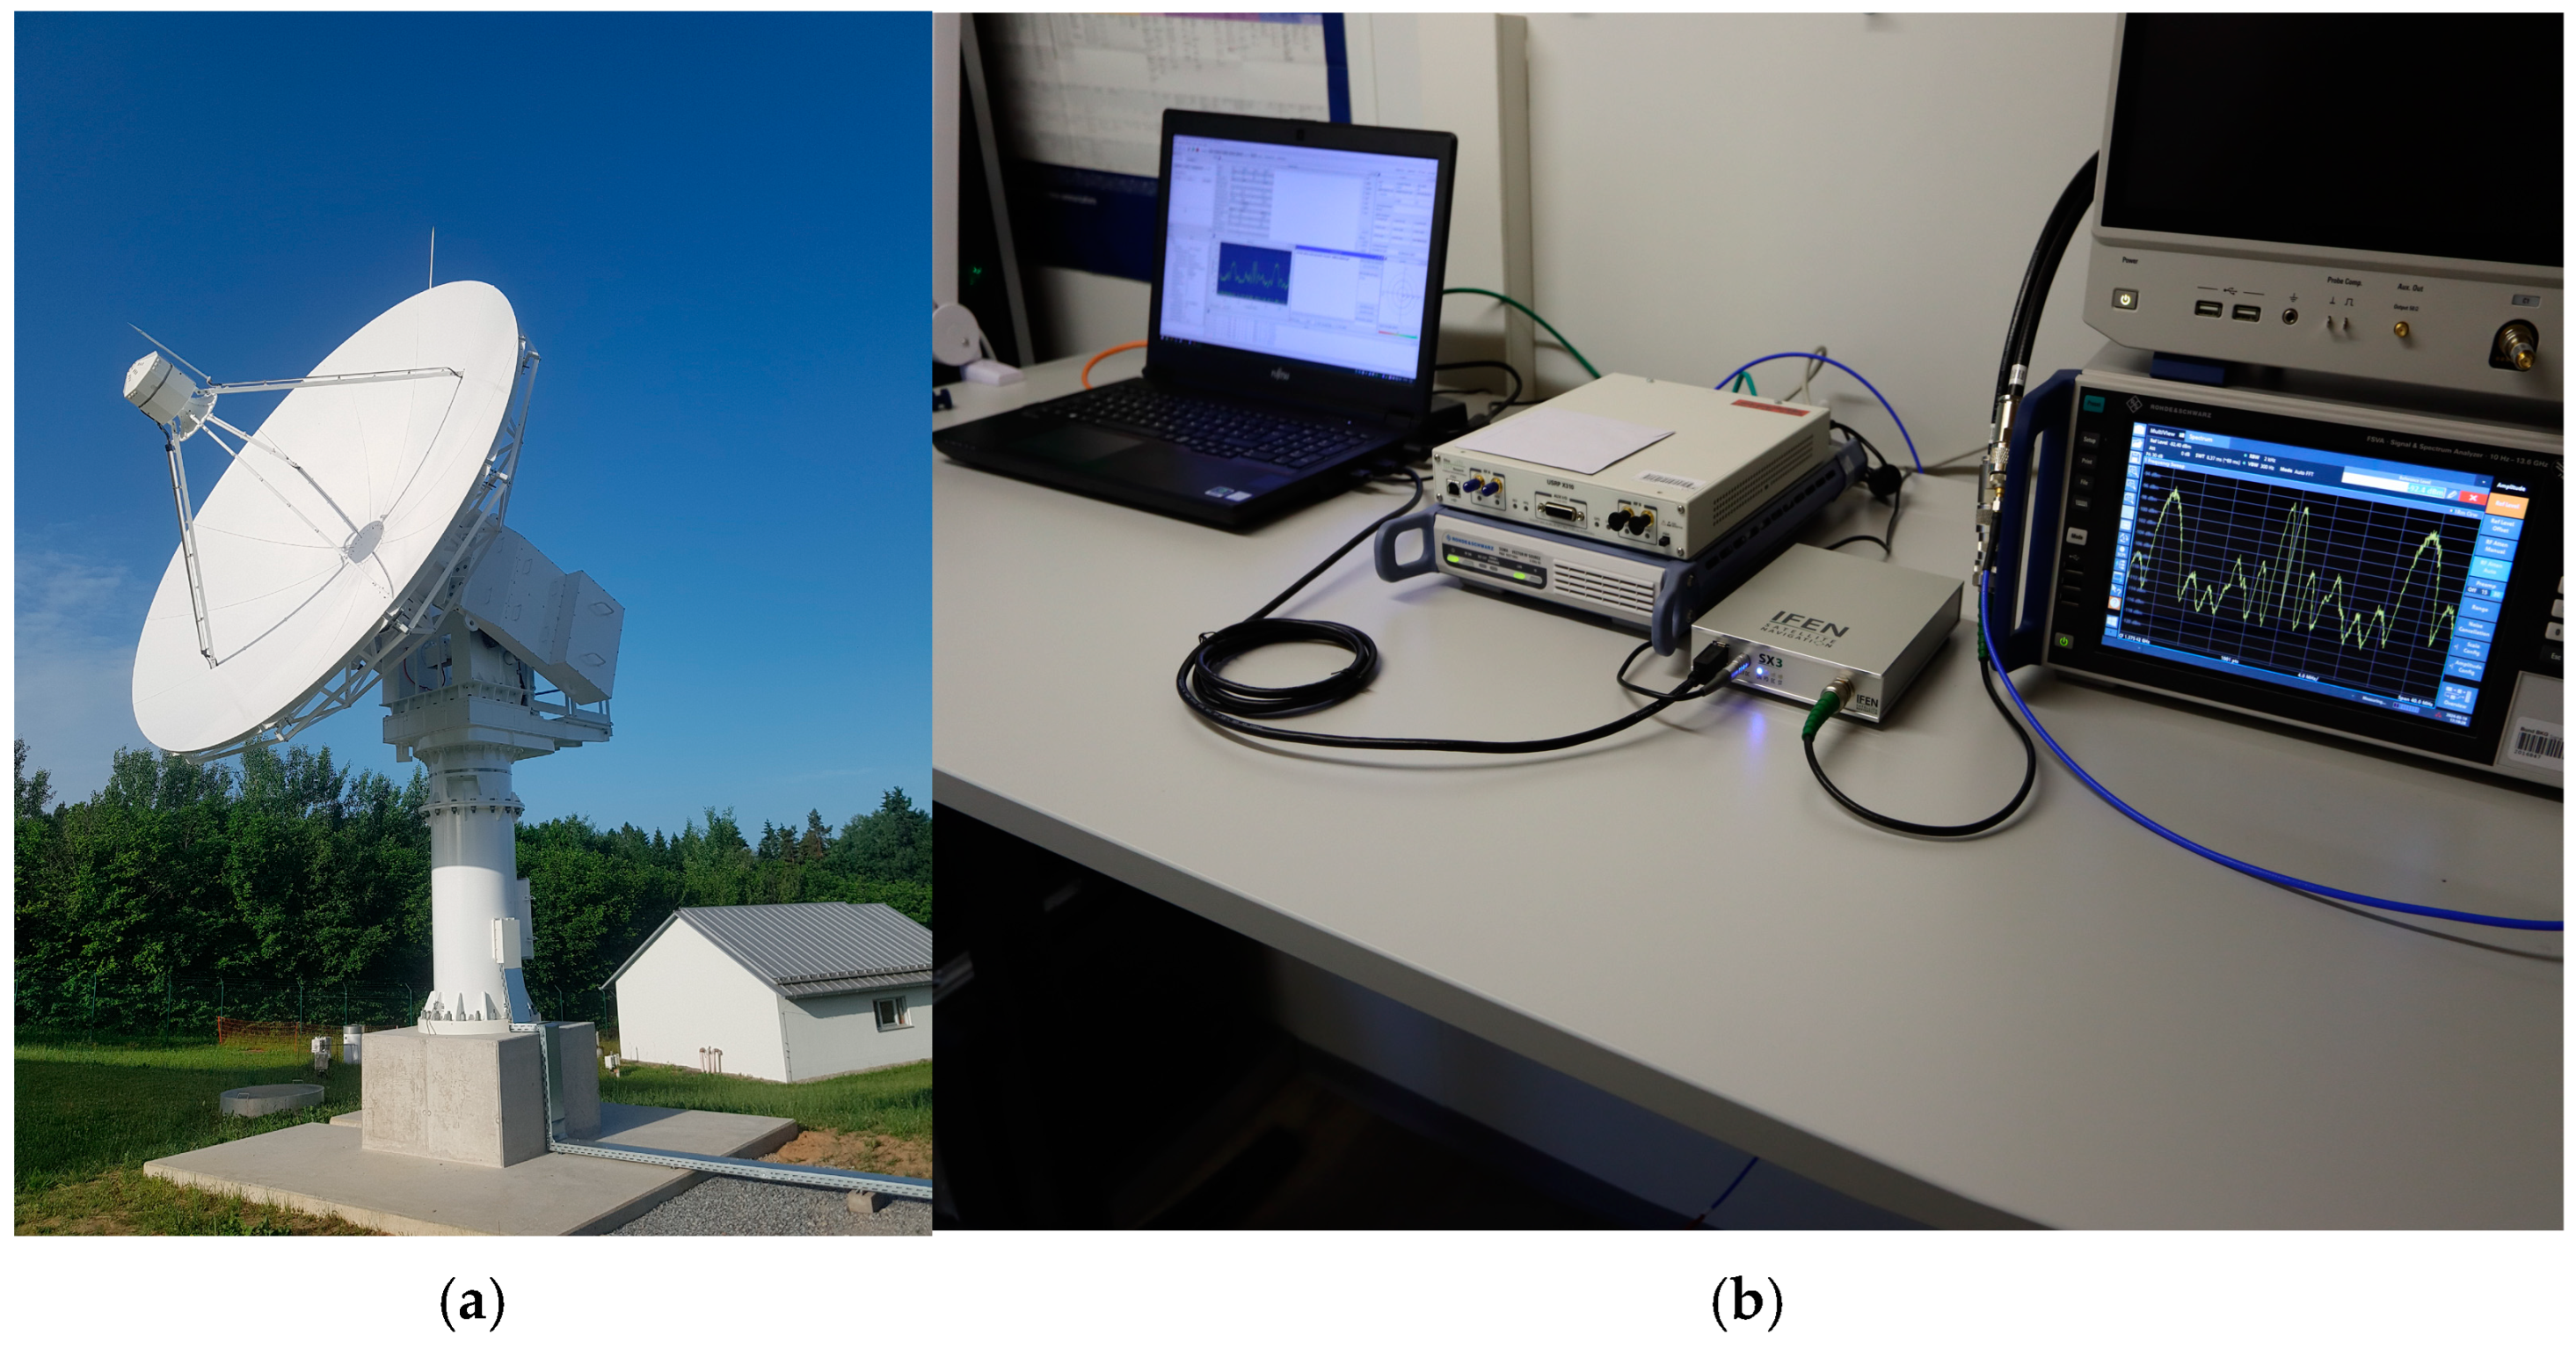
The data collection for the measurement campaign took place from 1 March to 15 March 2024 at the Wettzell Geodetic Observatory of the BKG (
Figure 1). During this period, 4 Galileo satellites (PRN E08, E10, E21, and E26) were targeted at intervals of 1–4 days using the Christoph-Latsch Teleskop (CLT), recording the E1/L1 band for 5 min. The telescope has a diameter of 5 m and, following analog filtering and signal amplification, uses the IFEN SX3 frontend to secure the data in 2-bit real-valued IF samples. This ensured a stable
ratio of 70.5 ± 0.3 dB-Hz of the derived data. To avoid interference from other GNSS satellites, recordings were only carried out when a spatial angle of 3° was clear of other GNSS space vehicles. Due to the combined use of the telescope for solar flux observations and space weather events, recordings could only take place during at night.
2.2. Processing Chain
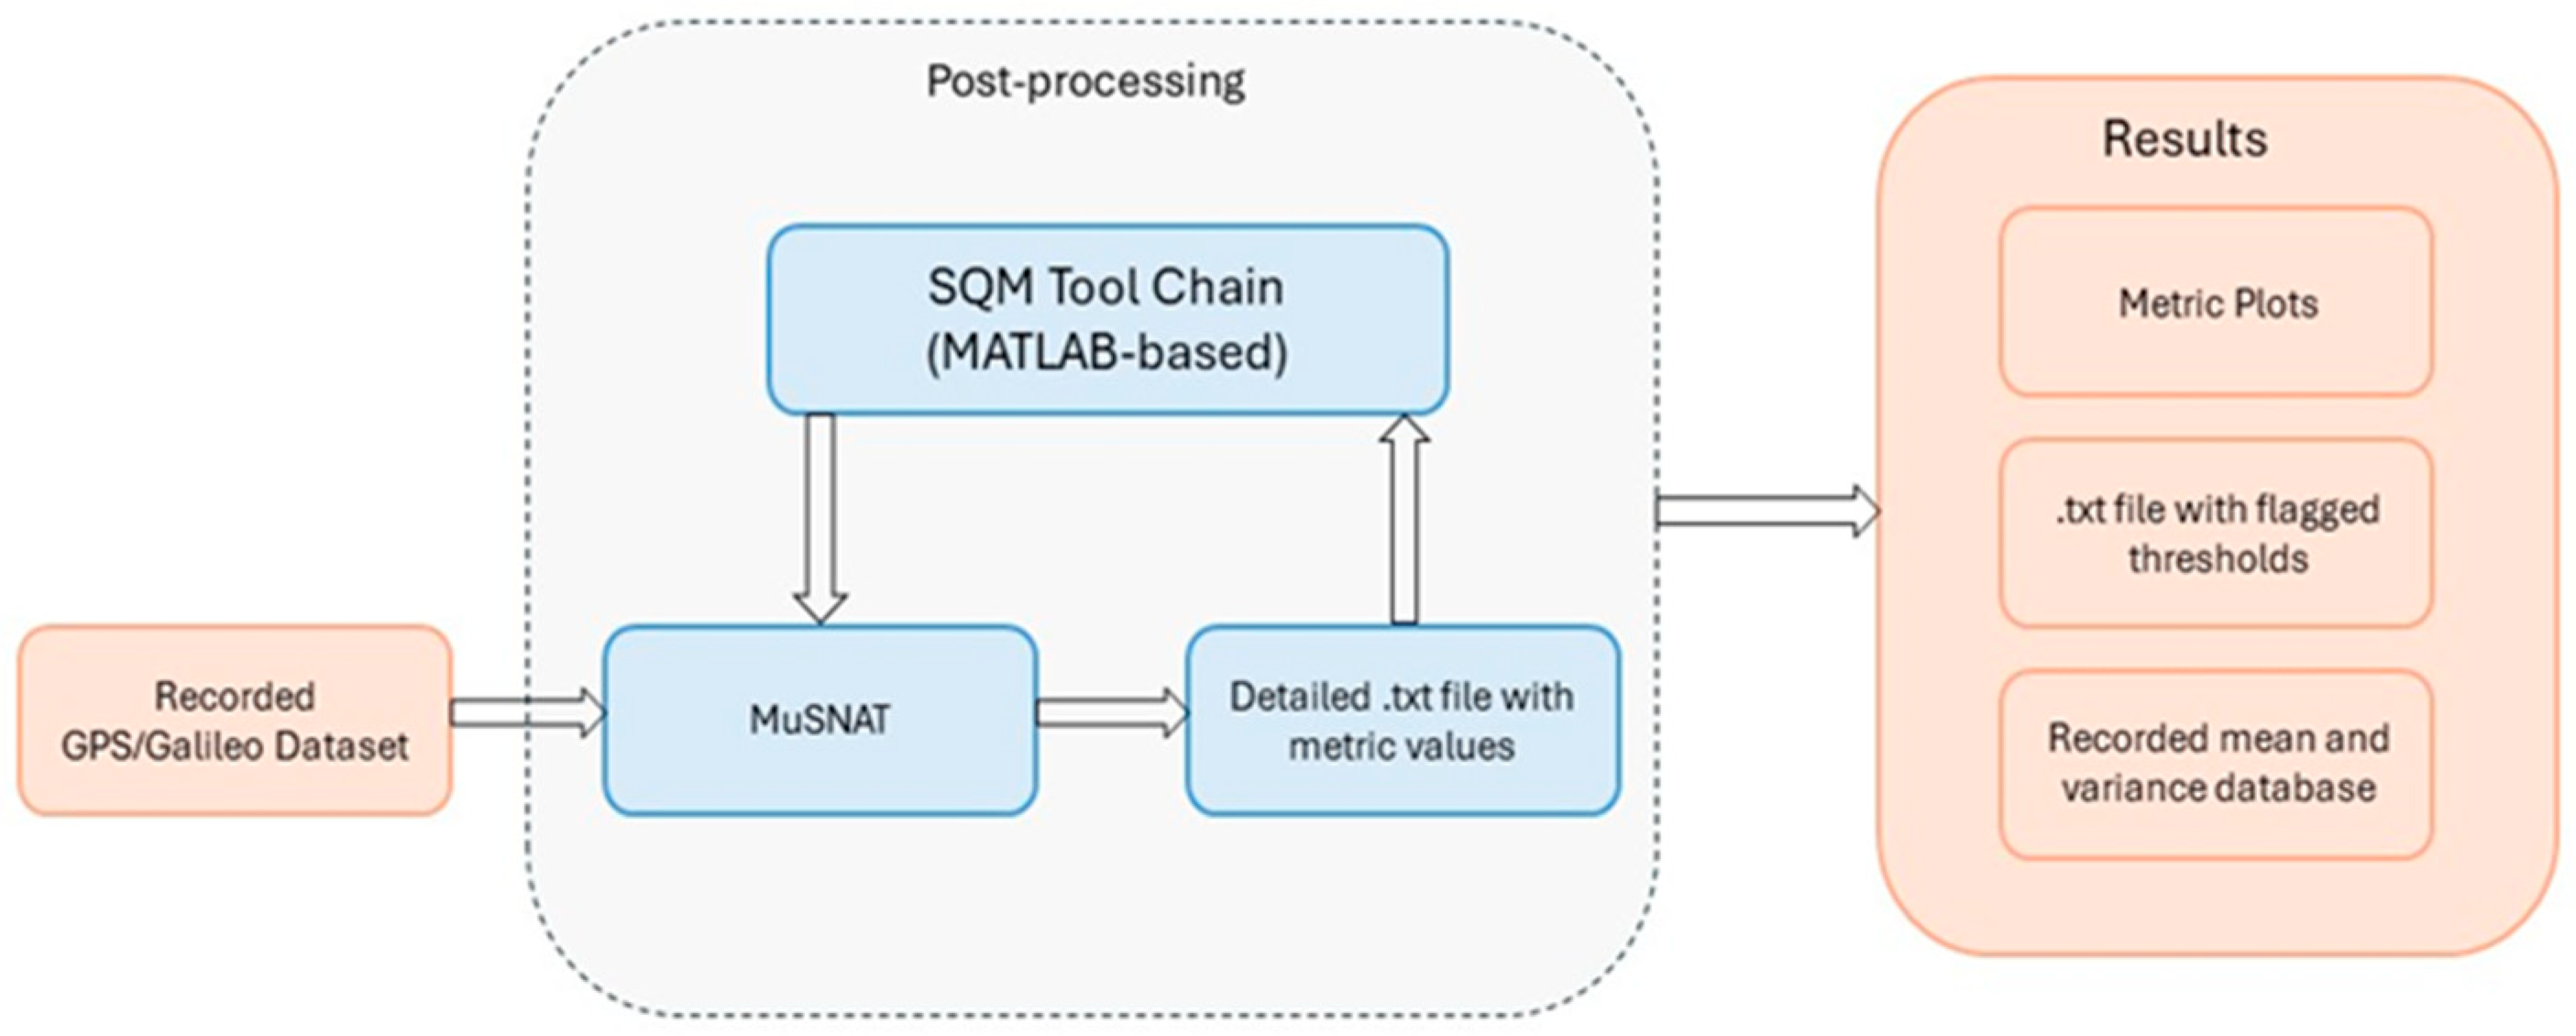
The recorded data were evaluated in post-processing using the MATLAB-based program SiMAS (Signal Monitoring Analysis Software, compiled march 24), developed at the UniBW.
Figure 2 shows the flow chart of the software toolchain.
The metadata of the IF (intermediate frequency) samples were evaluated by SiMAS and the configuration was prepared for further processing in MuSNAT. The subsequent processing used the Compute Unified Device Architecture (CUDA) framework on the GPU for the correlation, which has already shown a significant improvement in runtime [
8]. A total of 37 correlator points
with a spacing of 0.01023 chips were used and the various metrics are developed. The Single Sided Ratio (SSR), Delta (D) and DoubleDelta (DD) metrics were used in this study, normalized by
. These are defined as follows [
7]:
The dependence of the metrics was neglected in this study as this parameter remains very stable due to the measurement setup. Finally, the metrics for each epoch were stored in an ASCII-file, combined with a variety of tracking parameters like , Doppler, Discriminator outputs of delay (DLL), frequency (FLL) and phase-lock loops (PLL), code-minus-carrier (CMC) and others. The latter were used for the qualitative assessment of the computations.
After completing the MuSNAT processing, the results were read back into SiMAS for the analysis and visualization of the metrics. They were tested against stored thresholds and flagged in an output file when crossing them.
2.3. Data Analysis
The error of the satellite payload would lead to a constant error influence on the correlator, and thus also on the metrics formed. To determine this, it is crucial that the mean values of the metrics of error-free measurements remain stable over time. The first step was therefore to compare the periodic campaign results and assess their progression. The quality of the evaluation was checked for correctness using the output information of the MuSNAT processes.
Consequently, threshold values were formed over the longest common period
of the suitable measurements. The satellite specific threshold value uses the standard deviation
of the respective, suitable measurements and is scaled using the factor n. Assuming a normal distribution, this is calculated by
where
represents the inverse cumulative distribution function for each PRN and metric, and
is the false alarm probability, derived from a maximum false alarm rate of 1 over 10 years with a assumed daily number of 60 observations, enabling the recording of every GPS and Galileo satellite for a single selected signal. To estimate the minimum measurement time required, the
and means of the individual metrics were determined for each measurement period
in m seconds.
To test the sensitivity of these boundaries, signals with the ICAO described limitations were generated using the UniBW signal generation Tool YaSST, as shown by [
10]. The effects on the Code and on the respective correlator output can be seen in
Figure 3. For the digital failure TM-A, a generalized lead/lag on every falling flank was assumed for this study.
To test the probability of detection, the metrics of the undistorted and the distorted signal both follow the assumption that their distribution P is equal to those of the computed values of PRN E26. This satellite was chosen as it features the most measurements during the campaign. Testing the detection probability
was then determined as described in [
11], with d being the difference in the metric means of the threat model applied and the error-free, ideal, signal:
Lastly, in [
9] a comprehensive and sophisticated approach on benchmarking in relation to GNSS processing is given and used to test the CUDA computation for effects on the Core or Memory Clock. For this, the MSI Afterburner software was used to overclock the GPU’s (Nvidia GeForce RTX 4090) clocks and measure the computation rate in GSamples/second.
3. Results
The final list of recordings is presented in
Table A1. After computation, the metric outputs for each measurement are presented in
Figure 4. During the evaluation, problems with the configuration for high-energy signals became apparent. This could lead to false detections in the signal acquisition and later nonsensical tracking in the spectrum. After several iterations, a generally valid configuration was finally found.
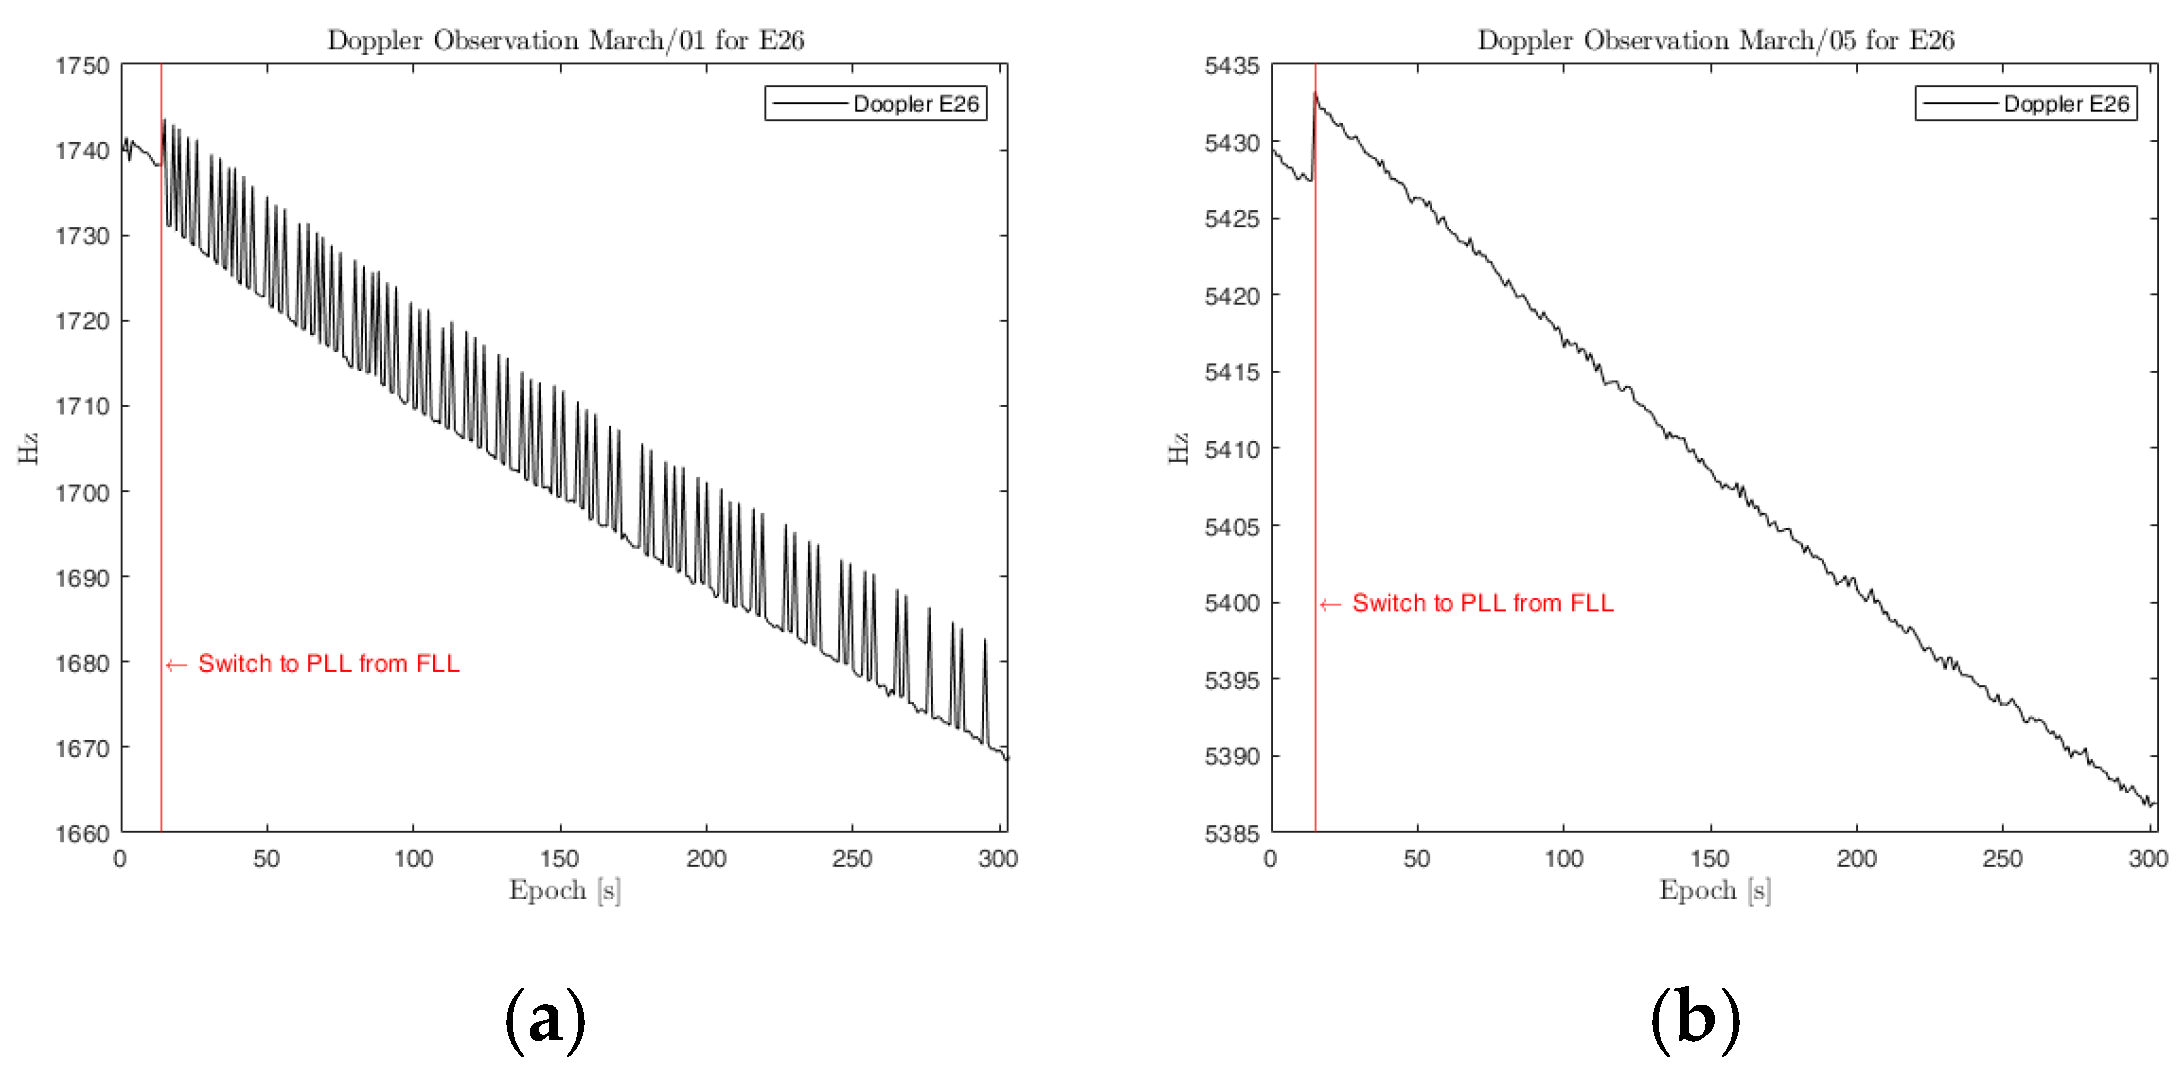
As becomes apparent, there are still some outliers in the results of E10 and E26 for 1 March. Upon further investigations, the tracking parameters show large errors during PLL tracking, as seen on the doppler tracking in
Figure 5. Even though this is still to be sorted out, we will not use these two recordings for further evaluation.
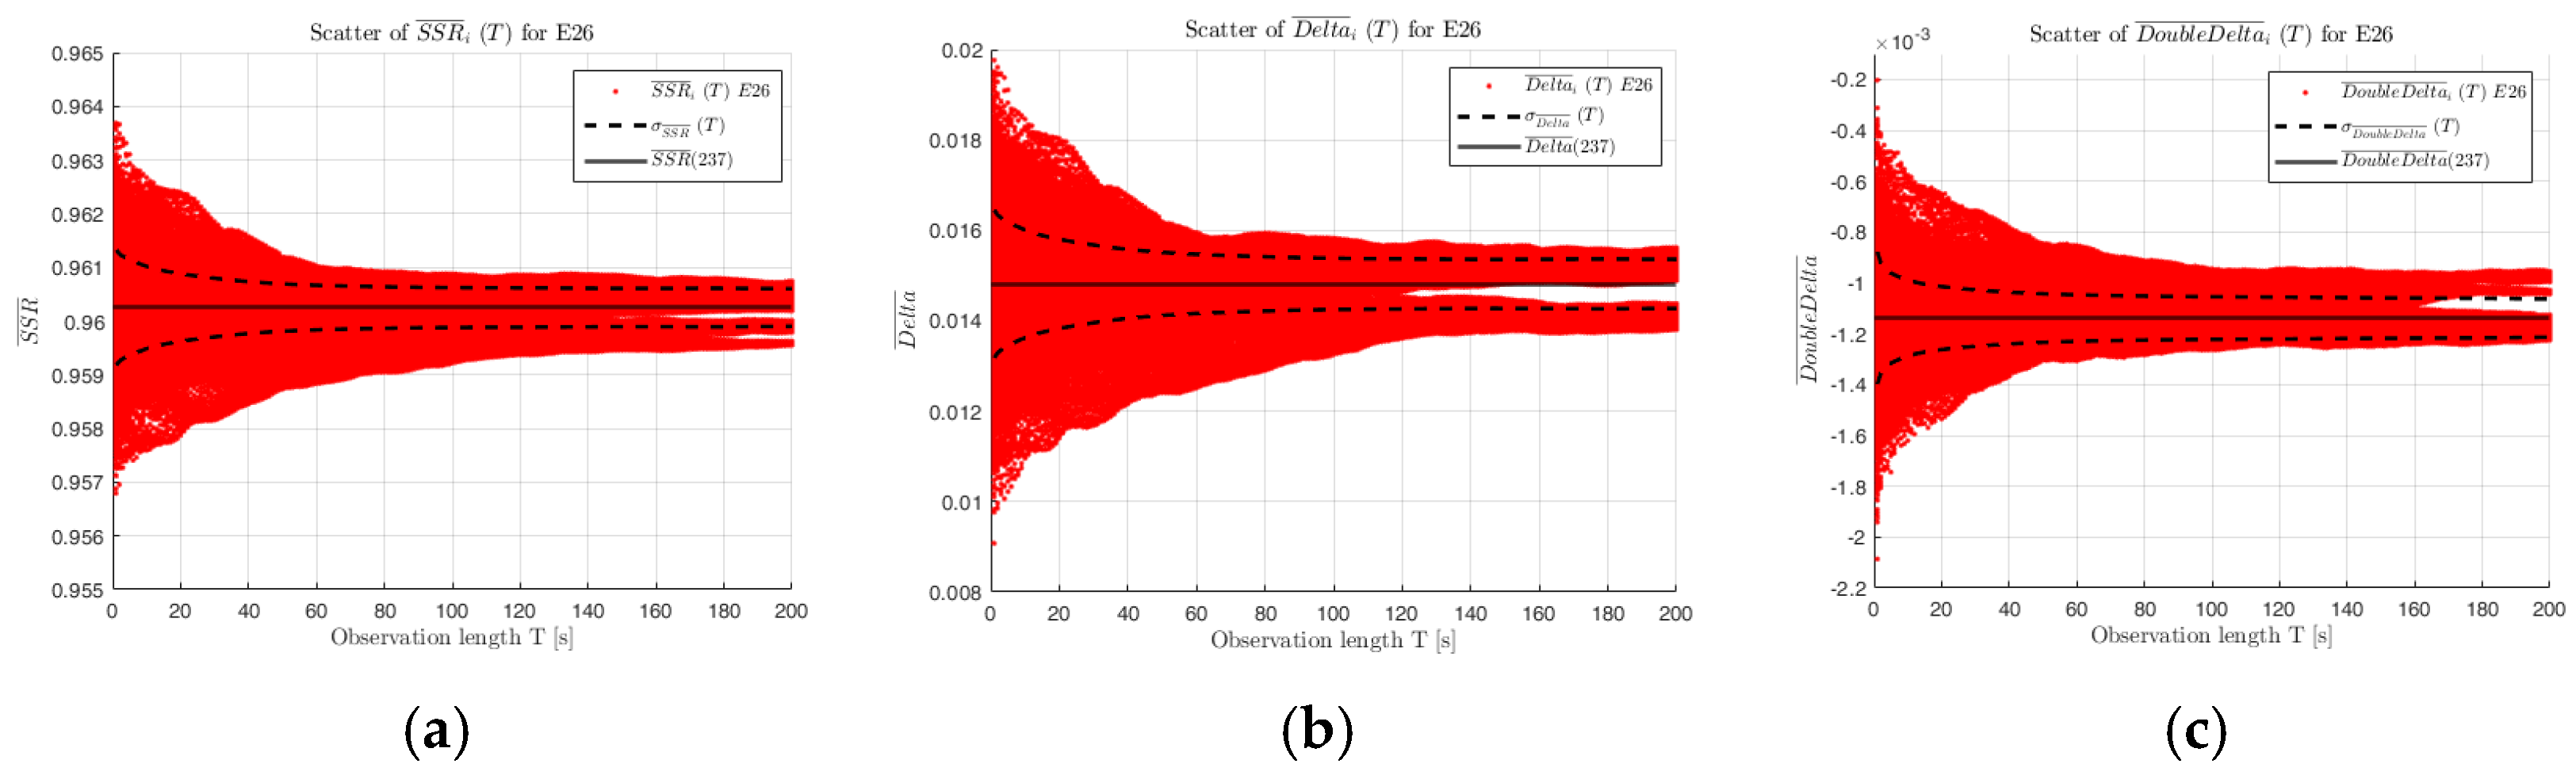
The remaining 28 recordings were then cut to the least common observation time (T = 237 s) and the threshold parameters for each PRN were set (
Table 1).
In addition, the means were formed for shorter measurement periods
(
Figure 6) and compared with the variance and the formed thresholds.
To determine the convergence behavior of the thresholds as a function of the observation time, the rate of change of
is determined (
Figure 7). It is shown that a stable estimate of the thresholds is possible after 150 s in the worst metric. Together with the time required for processing, a future observation period of 180–200 s is recommended.
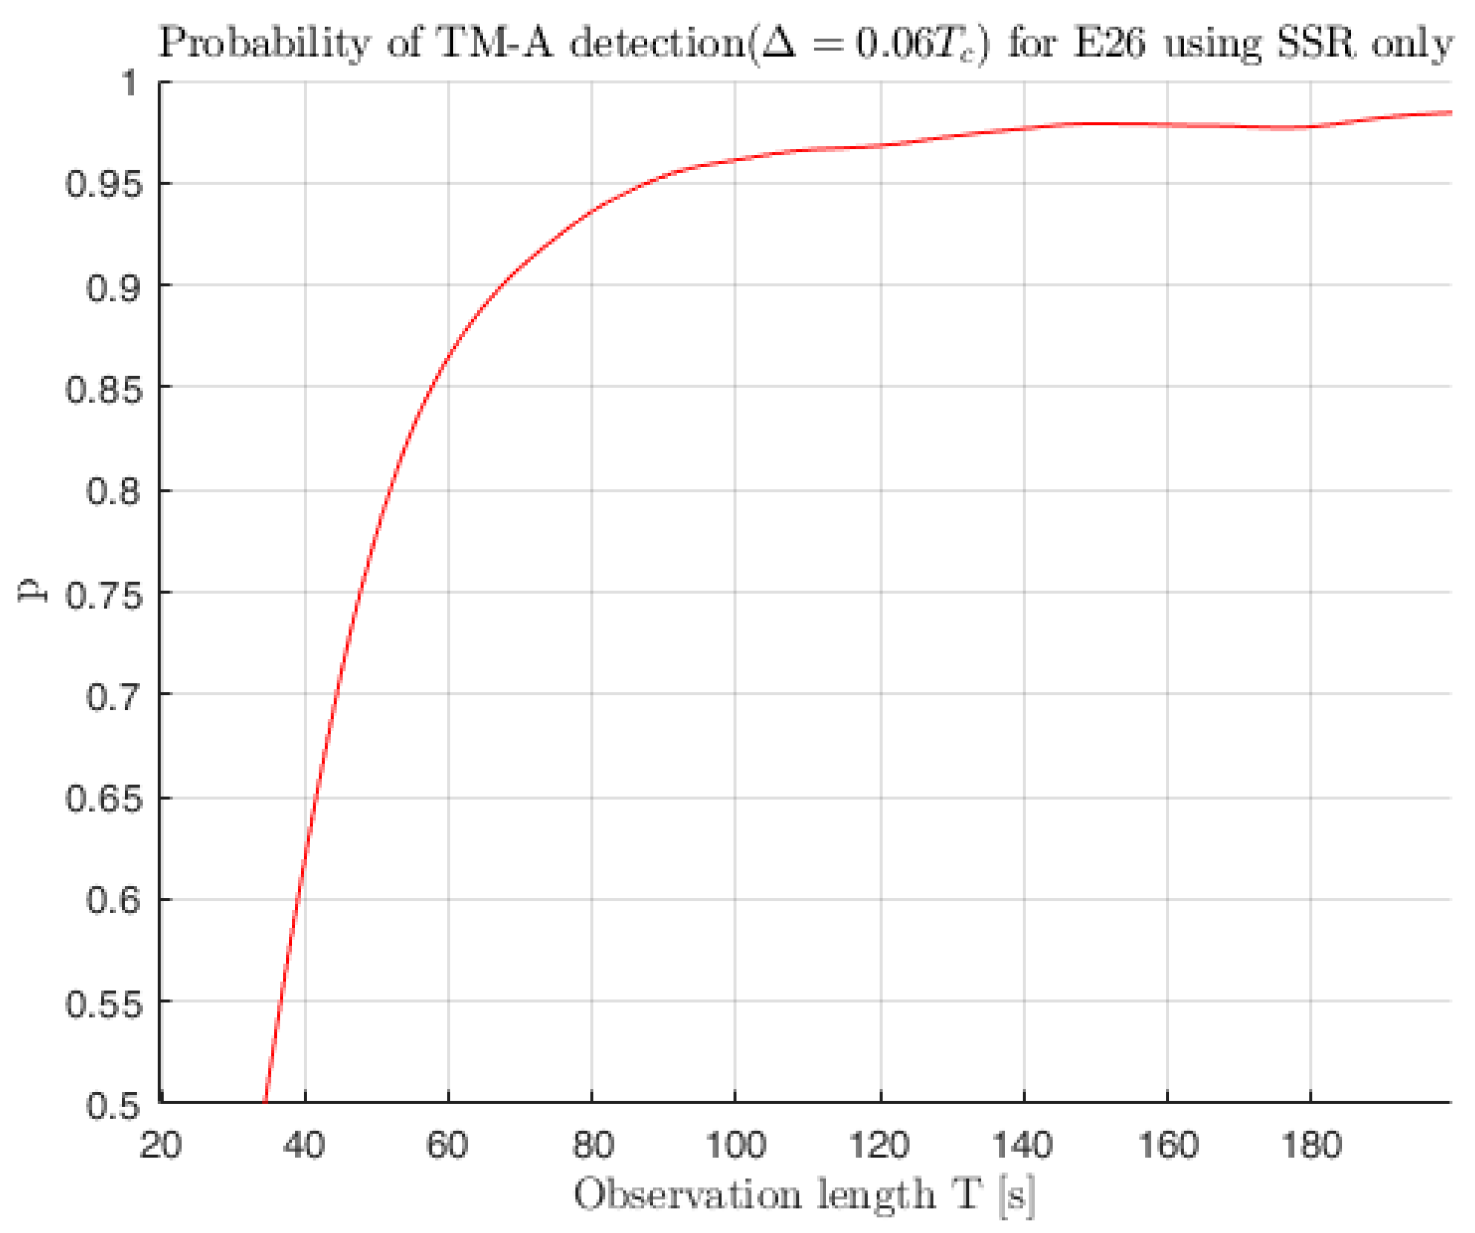
The subsequent test of the defined thread models, including the selected thresholds, proves to be successful for most parameters. The detection of TM-B works with a probability bordering on certainty with a chosen
of 1 MHz and damping factor = 0.8 Mnepers ×
. TM-A is sensitive up to a Δ lead/lag of 0.04
(percentage of chip) in the individual metrics, subsequently dropping to below 50% probability.
Figure 8 shows the detection probability for TM-A with a delta lag of 0.06. TM-C behaves as expected as a combined error influence with high sensitivity, especially with larger analog failure.
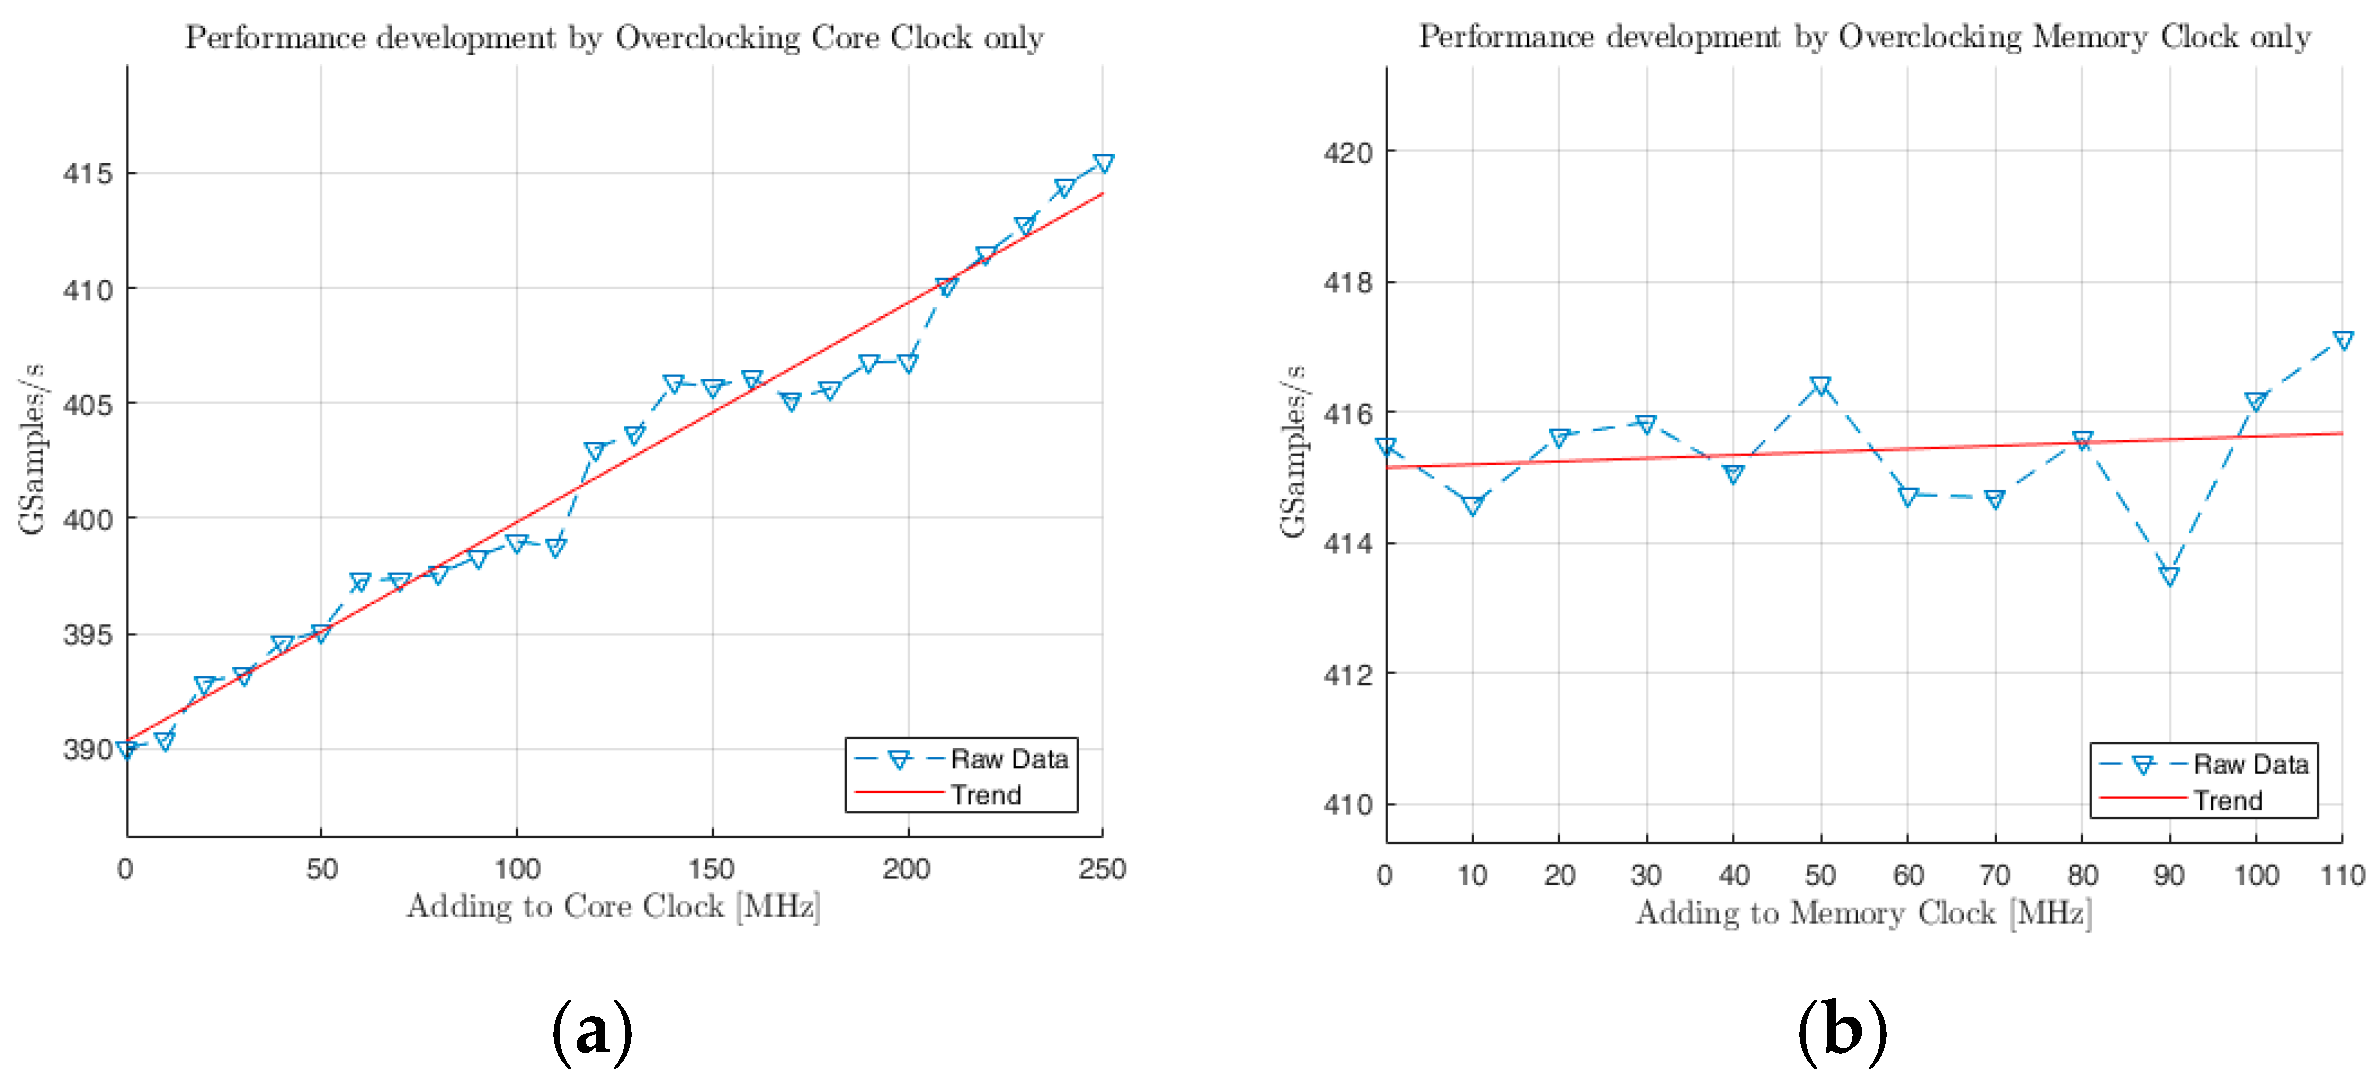
The results of the benchmarking, as shown in
Figure 9, are determined by consecutive additions to the clock and by using the mean observation of the sample processing rate. The core clock shows a least squares adjusted trend of 0.095222 GSamples × s
−1MHz
−1, while adding to the memory clock only results in a trend of 0.0047759 GSamples × s
−1MHz
−1, indicating a main dependency of the core clock for GPU-bound processing.
4. Discussion and Conclusions
Due to the false detection in two cases, the evaluated data show the need to obtain a robust and fine-tuned configuration for evaluating these high-energy signals. The remaining results show a good and stable performance in the metrics and allow for the setting of PRN specific thresholds. Tests against simulated EWFs show a satisfactory sensitivity of the solution, but need to be further developed and researched in the future. In addition to the inclusion of tracking parameters, a consideration of the metrics in relation to each other and the creation of new metrics using all available correlator points is planned. An in-depth look at the definition and simulation of possible threat models for Galileo E1B, as well as for other non-BPSK signals, should be considered.
The runtime estimation for Galileo E1B still needs to be compared with other signals for monitoring in order to define a refined measurement strategy for continuous monitoring. Further data should be used to test the assumptions made in this study under real conditions, which is why the medium-term recording of continuous measurement series is desired.
For future development, the outsourcing of computationally intensive processes to the GPU will be further promoted in order to carry out a systematic evaluation without the risk of race conditions. The detected positive effect on the GPU core clock provides conclusions about the bottlenecks of the GPU.
Author Contributions
Conceptualization, T.P. and F.B.; methodology, D.J.B. and F.B.; software, F.B.; validation, T.P., F.B.; formal analysis, F.B.; investigation, F.B.; resources, D.B, T.S., F.B. and T.P.; data curation, D.J.B. and F.B.; writing—original draft preparation, F.B.; writing—review and editing, D.B, T.S., F.B. and T.P.; visualization, F.B.; supervision, T.P.; project administration, D.J.B. and F.B.; funding acquisition, T.P. and TS. All authors have read and agreed to the published version of the manuscript.
Funding
This research was funded by the German Federal Agency for Cartography and Geodesy (Bundesamt für Kartographie und Geodäsie, BKG) as part of the cooperation project WESIS-β.
Institutional Review Board Statement
Not applicable.
Informed Consent Statement
Not applicable.
Data Availability Statement
The raw data supporting the conclusions of this article will be made available by the authors upon request.
Acknowledgments
The runtime measurement data for the correlation performance were collected by two students from the University of the Bundeswehr Munich, Ben Beckert and Michel Kötzner.
Conflicts of Interest
The authors declare no conflicts of interest.
Appendix A
Table A1.
Recordings conducted at the Geodetic Observatory Wettzell.
Table A1.
Recordings conducted at the Geodetic Observatory Wettzell.
PRN
(SV ID) | Color | Date—Starting Time
of Recording in UTC | Length (min)
of Recording | Azimuth/Elevation |
|---|
E08
(GSAT0208) | | 4 March 2024—05:40 | 5 | ~120°/32° |
| | 5 March 2024—18:25 | 5 | ~108°/34° |
| | 6 March 2024—23:30 | 5 | ~223°/73° |
| | 8 March 2024—17:22 | 5 | ~80°/25° |
| | 9 March 2024—23:30 | 5 | ~59°/54° |
| | 12 March 2024—19:13 | 5 | ~135°/45° |
| | 15 March 2024—05:45 | 5 | ~306°/30° |
E10
(GSAT0224) | | 1 March 2024—20:05 | 5 | ~300°/27° |
| | 4 March 2024—17:25 | 5 | ~260°/25° |
| | 7 March 2024—19:50 | 5 | ~96°/59° |
| | 8 March 2024—22:35 | 5 | ~306°/45° |
| | 10 March 2024—16:55 | 5 | ~54°/67° |
| | 11 March 2024—20:11 | 5 | ~300°/42° |
E21
(GSAT0215) | | 2 March 2024—16:52 | 5 | ~315°/30° |
| | 5 March 2024—18:05 | 5 | ~224°/32° |
| | 7 March 2024—05:35 | 5 | ~206°/23° |
| | 8 March 2024—17:02 | 5 | ~193°/28° |
| | 12 March 2024—17:45 | 5 | ~273°/38° |
| | 13 March 2024—05:45 | 5 | ~60°/51° |
| | 15 March 2024—16:33 | 5 | ~240°/48° |
E26
(GSAT0203) | | 1 March 2024—19:45 | 5 | ~95°/22° |
| | 4 March 2024—17:05 | 5 | ~70°/26° |
| | 5 March 2024—18:40 | 5 | ~283°/50° |
| | 6 March 2024—23:55 | 5 | ~312°/32° |
| | 8 March 2024—17:13 | 5 | ~282°/71° |
| | 9 March 2024—23:40 | 5 | ~265°/63° |
| | 11 March 2024—18:15 | 5 | ~83°/37° |
| | 11 March 2024—18:37 | 8 * | ~91°/29° |
| | 12 March 2024—19:44 | 5 | ~296°/39° |
| | 15 March 2024—17:10 | 5 | ~269°/37° |
References
- Enge, P.; Phelts, E.; Mitelman, A. Detecting Anomalous Signals from GPS Satellites; ICAO, GNSS/P: Toulouse, France, 1999. [Google Scholar]
- ICAO Convention—Annex 10: Aeronautical Telecommunications, Volume 1: Radio Navigation Aids, ICAO, 7th edition, July 2018. Available online: https://store.icao.int/en/annexes/annex-10 (accessed on 1 March 2024).
- Pagot, J.-B.; Julien, O.; Thevenon, P.; Fernandez, F.A.; Cabantous, M. Signal Quality Monitoring for New GNSS Signals. J. Inst. Navig. 2018, 65, 83–97. [Google Scholar] [CrossRef]
- Sun, A.; Zhang, Q.; Yu, Z.; Meng, X.; Liu, X.; Zhang, Y.; Xie, Y. A Novel Slow-Growing Gross Error Detection Method for GNSS/Accelerometer Integrated Deformation Monitoring Based on State Domain Consistency Theory. Remote Sens. 2022, 14, 4758. [Google Scholar] [CrossRef]
- MuSNAT, Multi Sensor Navigation Analysis Tool. Available online: https://www.unibw.de/lrt9/lrt-9.2/software-packages/musnat (accessed on 1 March 2024).
- Stöber, C.; Kneißl, F.; Krämer, I.; Pany, T.; Hein, G.W. Implementing Real-Time Signal Monitoring Within a GNSS Software Receiver, Proc. ENC GNSS 2008, Toulouse, France. Available online: https://www.academia.edu/34527504/Implementing_Real_time_Signal_Monitoring_within_a_GNSS_Software_Receiver (accessed on 4 March 2024).
- Blum, R.; Dütsch, N.; Stoeber, C.; Dampf, J.; Pany, T. New and Existing Signal Quality Monitoring Metrics Tested Against Simulations and Time Synchronized Signal Generator Attacks. In Proceedings of the 33rd International Technical Meeting of the Satellite Division of The Institute of Navigation (ION GNSS+ 2020), St. Louis, MO, USA, 22–25 September 2020; pp. 3835–3853. [Google Scholar] [CrossRef]
- Schipor, M.; Binder, F.; Dötterböck, D.; Schüler, T.; Pany, T. Updates on GPS/Galileo Signal Quality Monitoring Making use of CUDA Processing and a High Number of Correlators. In Proceedings of the 2024 International Technical Meeting of The Institute of Navigation, Long Beach, CA, USA, 23–25 January 2024; pp. 287–300. [Google Scholar] [CrossRef]
- Pany, T.; Moon, S.W.; Irsigler, M.; Eissfeller, B.; Fürlinger, K. Performance Assessment of an Under-Sampling SWC Receiver for Simulated High-Bandwidth GPS/Galileo Signals and Real Signals. In Proceedings of the 16th International Technical Meeting of the Satellite Division of The Institute of Navigation (ION GPS/GNSS 2003), Portland, OR, USA, 9–12 September 2003; pp. 103–116. [Google Scholar]
- Phelts, R. Multicorrelator Techniques for Robust Mitigation of Threats to GPS Signal Quality. Ph.D. Thesis, Stanford University, Stanford, CA, USA, 2001. [Google Scholar]
- Mitelman, A. Signal Quality Monitoring for GPS Augmentation Systems. Ph.D. Thesis, Stanford University, Stanford, CA, USA, 2004. [Google Scholar]
| Disclaimer/Publisher’s Note: The statements, opinions and data contained in all publications are solely those of the individual author(s) and contributor(s) and not of MDPI and/or the editor(s). MDPI and/or the editor(s) disclaim responsibility for any injury to people or property resulting from any ideas, methods, instructions or products referred to in the content. |
© 2025 by the authors. Licensee MDPI, Basel, Switzerland. This article is an open access article distributed under the terms and conditions of the Creative Commons Attribution (CC BY) license (https://creativecommons.org/licenses/by/4.0/).


