Abstract
Global Navigation Satellite System (GNSS) reference receivers are an essential part of ground stations that make the operation of Satellite-Based Augmentation Systems (SBAS) possible. Recently, there has been increasing concern about spoofing and interference events, which may seriously hinder the operation of GNSS receivers in liability- and safety-critical applications and, in particular, SBAS ground stations. In this context, the goal of this paper is two-fold. On the one hand, a set of spoofing and interference detection techniques should be presented specifically tailored to operate with the outputs provided by a NovAtel G-III SBAS reference receiver. On the other hand, assessing these techniques with various tests conducted using a Safran Skydel GSG-8 GNSS RF simulator in order to validate their implementation and effectiveness is necessary. This work concludes with an analysis of the obtained results, providing insightful recommendations and guidelines.
1. Introduction
Global Navigation Satellite Systems (GNSS) have become an indispensable component of modern navigation systems, providing accurate positioning, timing, and velocity information across various domains, from aviation to maritime and land-based applications. Satellite-Based Augmentation Systems (SBAS) further enhance the accuracy and reliability of GNSS signals by providing integrity monitoring and correction services. However, the proliferation of spoofing and interference threats poses significant challenges to the correct operation of SBAS-enabled GNSS receivers. Spoofing attacks involve the transmission of counterfeit signals, leading to erroneous positioning solutions. Interferences, on the other hand, encompass unintentional or malicious radio frequency (RF) signals that disrupt the reception of authentic GNSS signals.
The development of effective tests to detect and mitigate such threats has been a crucial research topic in recent years. For instance, Li. R et al. [1] propose methods based on signal analysis to identify spoofing patterns and data fusion techniques to improve GNSS receiver robustness. Other examples are given by Albright et al. [2] and Humphreys et al. [3], which present a testbed to evaluate anti-spoofing techniques. Furthermore, works such as those by Lemmenes et al. [4] analyze the effects of the scenarios presented in [3]. In this context, our article is intended to assess the performance of a representative set of interference and spoofing detection techniques when implemented on one of the SBAS GNSS reference receivers most widely used in safety-critical applications. Improving the robustness of these receivers thus becomes of paramount importance [5].
This work has two primary goals: first, it presents a set of spoofing and interference detection techniques specifically tailored to work with the output observables from a NovAtel G-III [6] SBAS reference receiver; second, it assesses the performance of these techniques through controlled testing using the Safran Skydel GSG-8 GNSS RF (Paris, France) [7] simulator to validate their implementation and effectiveness. Specific spoofing and interference scenarios have been created to evaluate the performance of the proposed detection techniques. This article is structured as follows. Section 2 introduces the spoofing and interference detection techniques under analysis. Then, Section 3 describes the methodology employed for testing the performance of such techniques on the SBAS receiver. Next, Section 4 presents the empirical results derived from the application of these techniques in the tests, and finally, conclusions are drawn in Section 5.
2. Spoofing and Interference Detection Techniques
In the present work, a set of selected spoofing detection techniques has been considered for processing the output data provided by a NovAtel G-III SBAS GNSS receiver (Calgary, AB, Canada). A brief description of these techniques is provided next to unveil their main features.
2.1. Signal Quality Monitoring (SQM)—Delta Metric
This technique is intended to monitor the symmetry of the correlation peak being tracked by the receiver correlators, which can be altered by the presence of spoofers or multipath [8]. Specifically, the Delta metric is defined in Equation (1):
where Ix represents the in-phase component of the early (−c) or late (+c) correlator, and I0 denotes the in-phase component of the prompt correlator output. Under nominal conditions, when no spoofer is present, the metric remains around zero due to the inherent symmetry of the correlation triangle. Deviations from this baseline value can indicate the presence of a spoofer or multipath, enabling the prompt detection of such threats. Such deviations occur when a replica of the authentic signal aligns with the authentic one in the pseudorange domain, making the aggregated correlation peak distort from its expected triangular shape. In the nominal scenario, when no attacker is present, the statistical behavior of the Delta metric can be well modeled by a t-Student distribution [9], which provides an analytical formulation that allows us to set a detection threshold depending on a desired probability of false alarm. It is worth mentioning that the values of the correlators that are needed to compute (1) are not provided directly by the NovAtel G-III receiver. Instead, as described in the receiver user manual, a linear combination of these correlator values is contained in the CORRDATAB data log message, and this transformation needs to be undone in order to have access to the actual correlator values.
2.2. Aggregated C/N0
This technique is intended to monitor variations in the carrier-to-noise spectral density ratio (C/N0), which typically arise when a spoofer is present. This is either due to the resulting distortion of the correlation peak or to the fact that the spoofer may significantly increase its power to take over the receiver, thus resulting in an artificially large estimated C/N0 value. By comparing this metric with a configurable threshold value of C/N0, potential spoofers can be detected. Equation (2) presents the metric used in this technique.
where denotes the number of satellites in view, represents the estimated C/N0 for the k-th satellite at the n-th epoch, and is the gain pattern of the antenna for the estimated elevation angle provided by the receiver.
2.3. Average C/N0 Difference per Elevation Angle
This technique is intended to check the consistency of the C/N0 measurements of a given satellite by comparing the current estimate with the average C/N0 computed over a given period of time at the same elevation angle. Due to the static position of SBAS reference receivers, changes in the C/N0 detected over time can unveil suspicious behavior due to external agents. The algorithm used in this technique is as follows, where a period of three days has been considered as an example:
- Check that the C/N0 measurement is valid and the elevation angle is greater than the elevation cut-off angle;
- Calculate the average C/N0 resulting from the past three days of data for the same satellite at the same elevation angle;
- Check the difference between the current C/N0 measurement and the one in step 2; if the difference lies within a given threshold, the database of C/N0 measurements for this satellite and elevation angle is updated with the current C/N0 measurement.
The metric can also be defined with Equation (3):
where is the C/N0 measurement at the n-th epoch of the k-th satellite at the e-th elevation on the d-th day. The metric is, therefore, based on the mean of the past 3 days registered in the database. Using the Narrowband–Wideband Power Ratio (NWPR) as the C/N0 estimator, the statistical properties of the metric in (3) can be approximated to follow a Gaussian PDF.
2.4. Receiver Position
Since the position where SBAS ground reference receivers are located is a priori known, position estimates are often not computed by SBAS reference receivers and must be computed externally if needed. This is the case when detection techniques relying on the quality of pseudoranges are considered. A conventional least-square method has been considered herein for implementing the following position-based metric,
where is a vector that contains the three coordinates of the externally estimated position at the -th time epoch, contains the coordinates of the a priori known position, and is the Euclidean norm. As happened in the aggregate C/N0 metric, the thresholds of detection are established based on the empirical results of the nominal behavior.
3. Methodology
3.1. Test Equipment
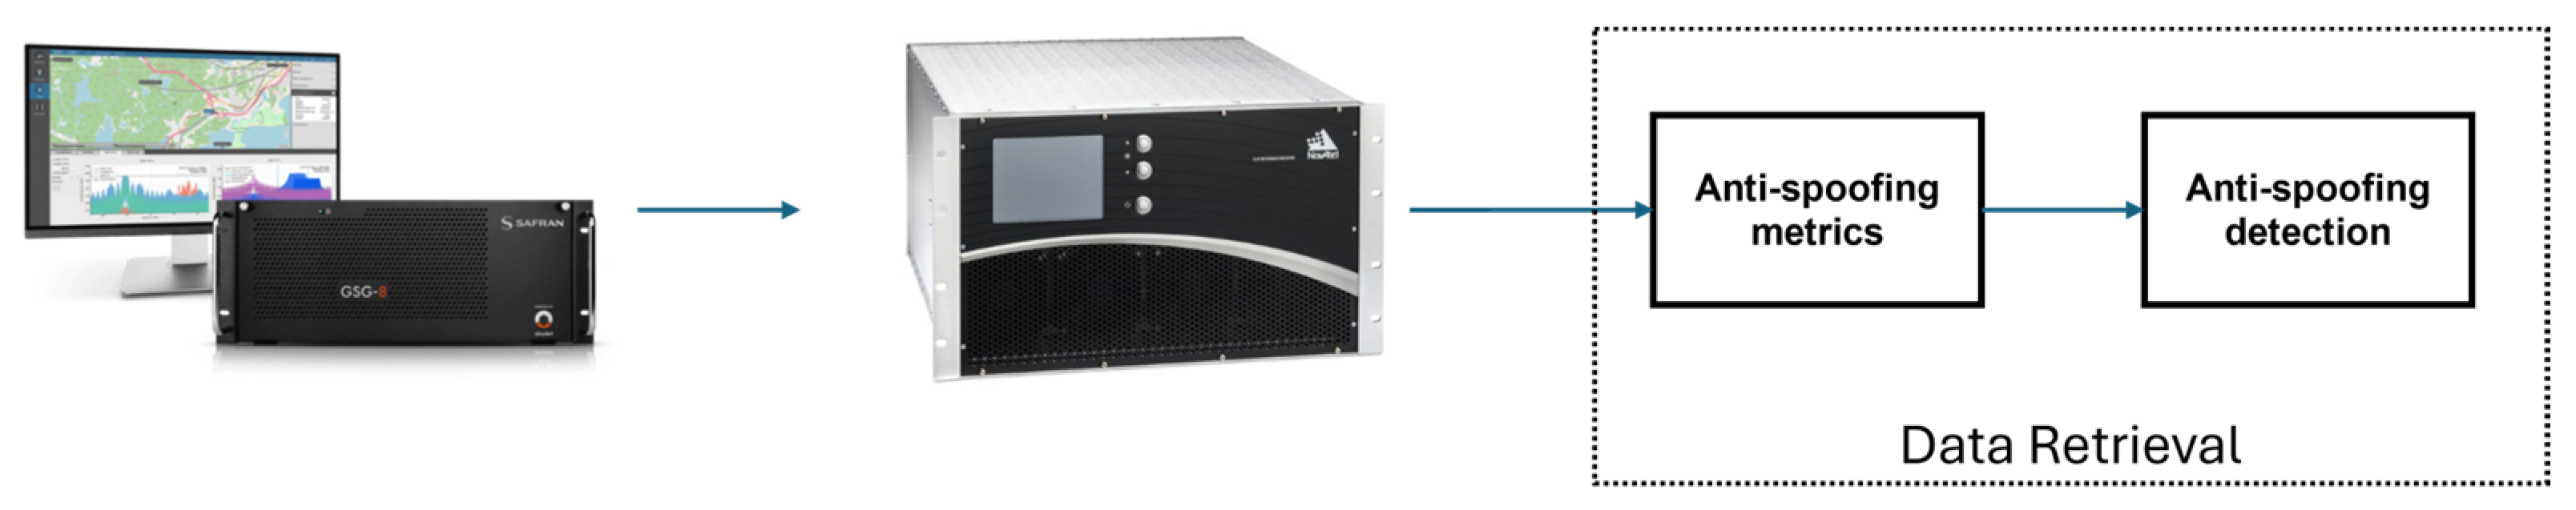
The simulation environment utilized in this study is composed of a Safran SkyDel GSG-8 simulator generating RF signals for various scenarios connected to a NovAtel G-III SBAS receiver. SkyDel, renowned for its versatility and accuracy, provides a robust platform for simulating GNSS signals under diverse conditions. In Figure 1, the test setup used is presented.

Figure 1.
Test setup for test execution and technique evaluation.
While the focus of this work is on the detection capabilities that can be deployed using the output observables from a representative SBAS reference receiver, it is true that these receivers often implement some kind of mitigation as well. While a thorough analysis of threat mitigation is out of the scope of the present work, some tests have been performed to illustrate the impact of the T-RAIM technique implemented in the NovAtel G-III SBAS receiver, as in the “position push” attack described in Section 4.2.
3.2. Scenario Description
Three distinct tests are considered herein. The first two tests consider the presence of a spoofer either implementing a “time-push” or a “position-push” attack, while the third test considers a jamming attack using a sweeping CW interference signal.
Spoofing attacks considered herein unfold across five stages, each lasting 30 min or 1800 (1-s) epochs. The initial stage (epochs 1 to 1800) serves as a baseline, free of any spoofing activity, thus allowing the receiver to acquire nominal GNSS signals and attain its baseline performance. Subsequently, the spoofing attack commences. The second stage (ephocs 1801 to 3600) is when the spoofer is activated and gradually starts to work by reducing its pseudorange offset from 1000 m to 0 m, thus eventually becoming totally aligned with the authentic signal in the pseudorange domain. The third stage (ephocs 3601 to 5400) focuses on increasing the power of the spoofer, thus forcing the receiver to lock onto the spoofed signal. Finally, the fourth stage (epochs 5401 to 7200) and the fifth stage (epochs 7201 to 9000) involve the attacker progressively pushing toward the target spoofed position and maintaining this push until the conclusion of the test. The two spoofing tests are the “position push” (test #1), which involves a 600 m position push with 6 dB of power advantage at the second phase and 3 dB at the push phase, and the “time push” (test #2), which performs a ~3 µs on the receiver clock offset and 10 dB of power advantage.
In the interference test (test #3), a CW interference is considered implementing a power sweep from a power spectral density of −165 dBm/Hz up to −125 dBm/Hz in steps of 1 dB maintained during 70 s each.
4. Results
4.1. Test #1: “Time-Push” Spoofer
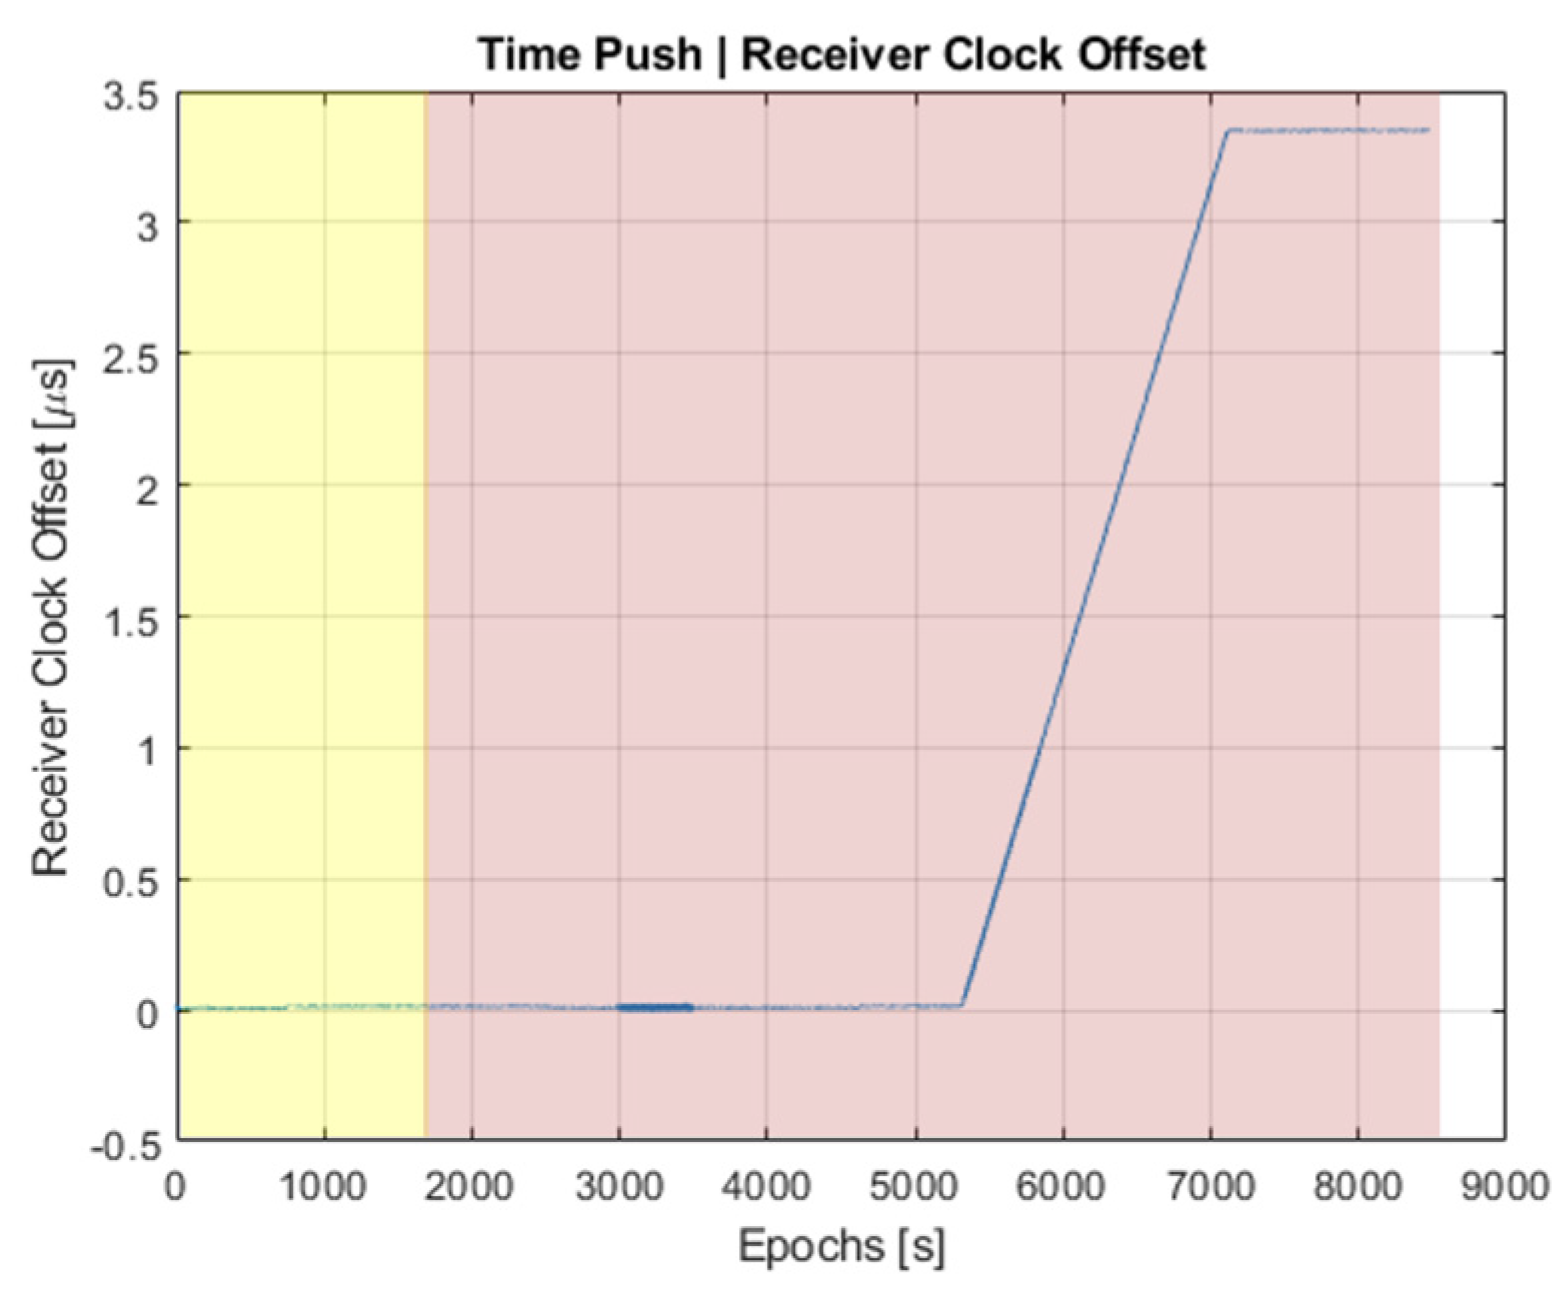
To reach the objective of this test, a common pseudorange offset moving from 0 m to 1000 m is applied to all satellites, thus ending up in a 3 µs push in the time estimate obtained by the receiver. The results for the clock offset estimated by the NovAtel G-III receiver are shown in Figure 2, where it can be confirmed that the test succeeds in pushing the clock offset as desired. Note that the region where the spoofer is inactive is colored in yellow, while the region where the spoofer is active is colored in red. This colored representation will be used henceforth for the sake of clarity.
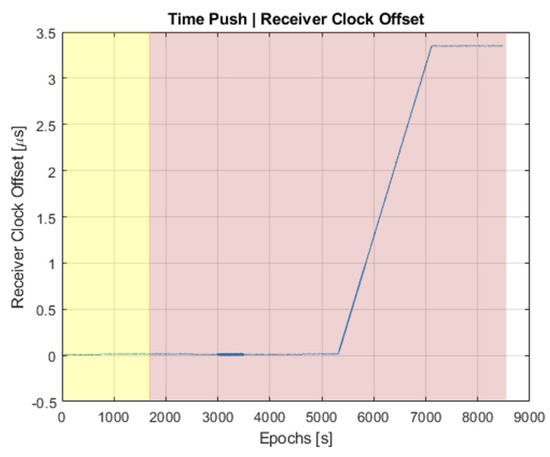
Figure 2.
The receiver clock offset was provided by the NovAtel G-III receiver during the time–push attack.
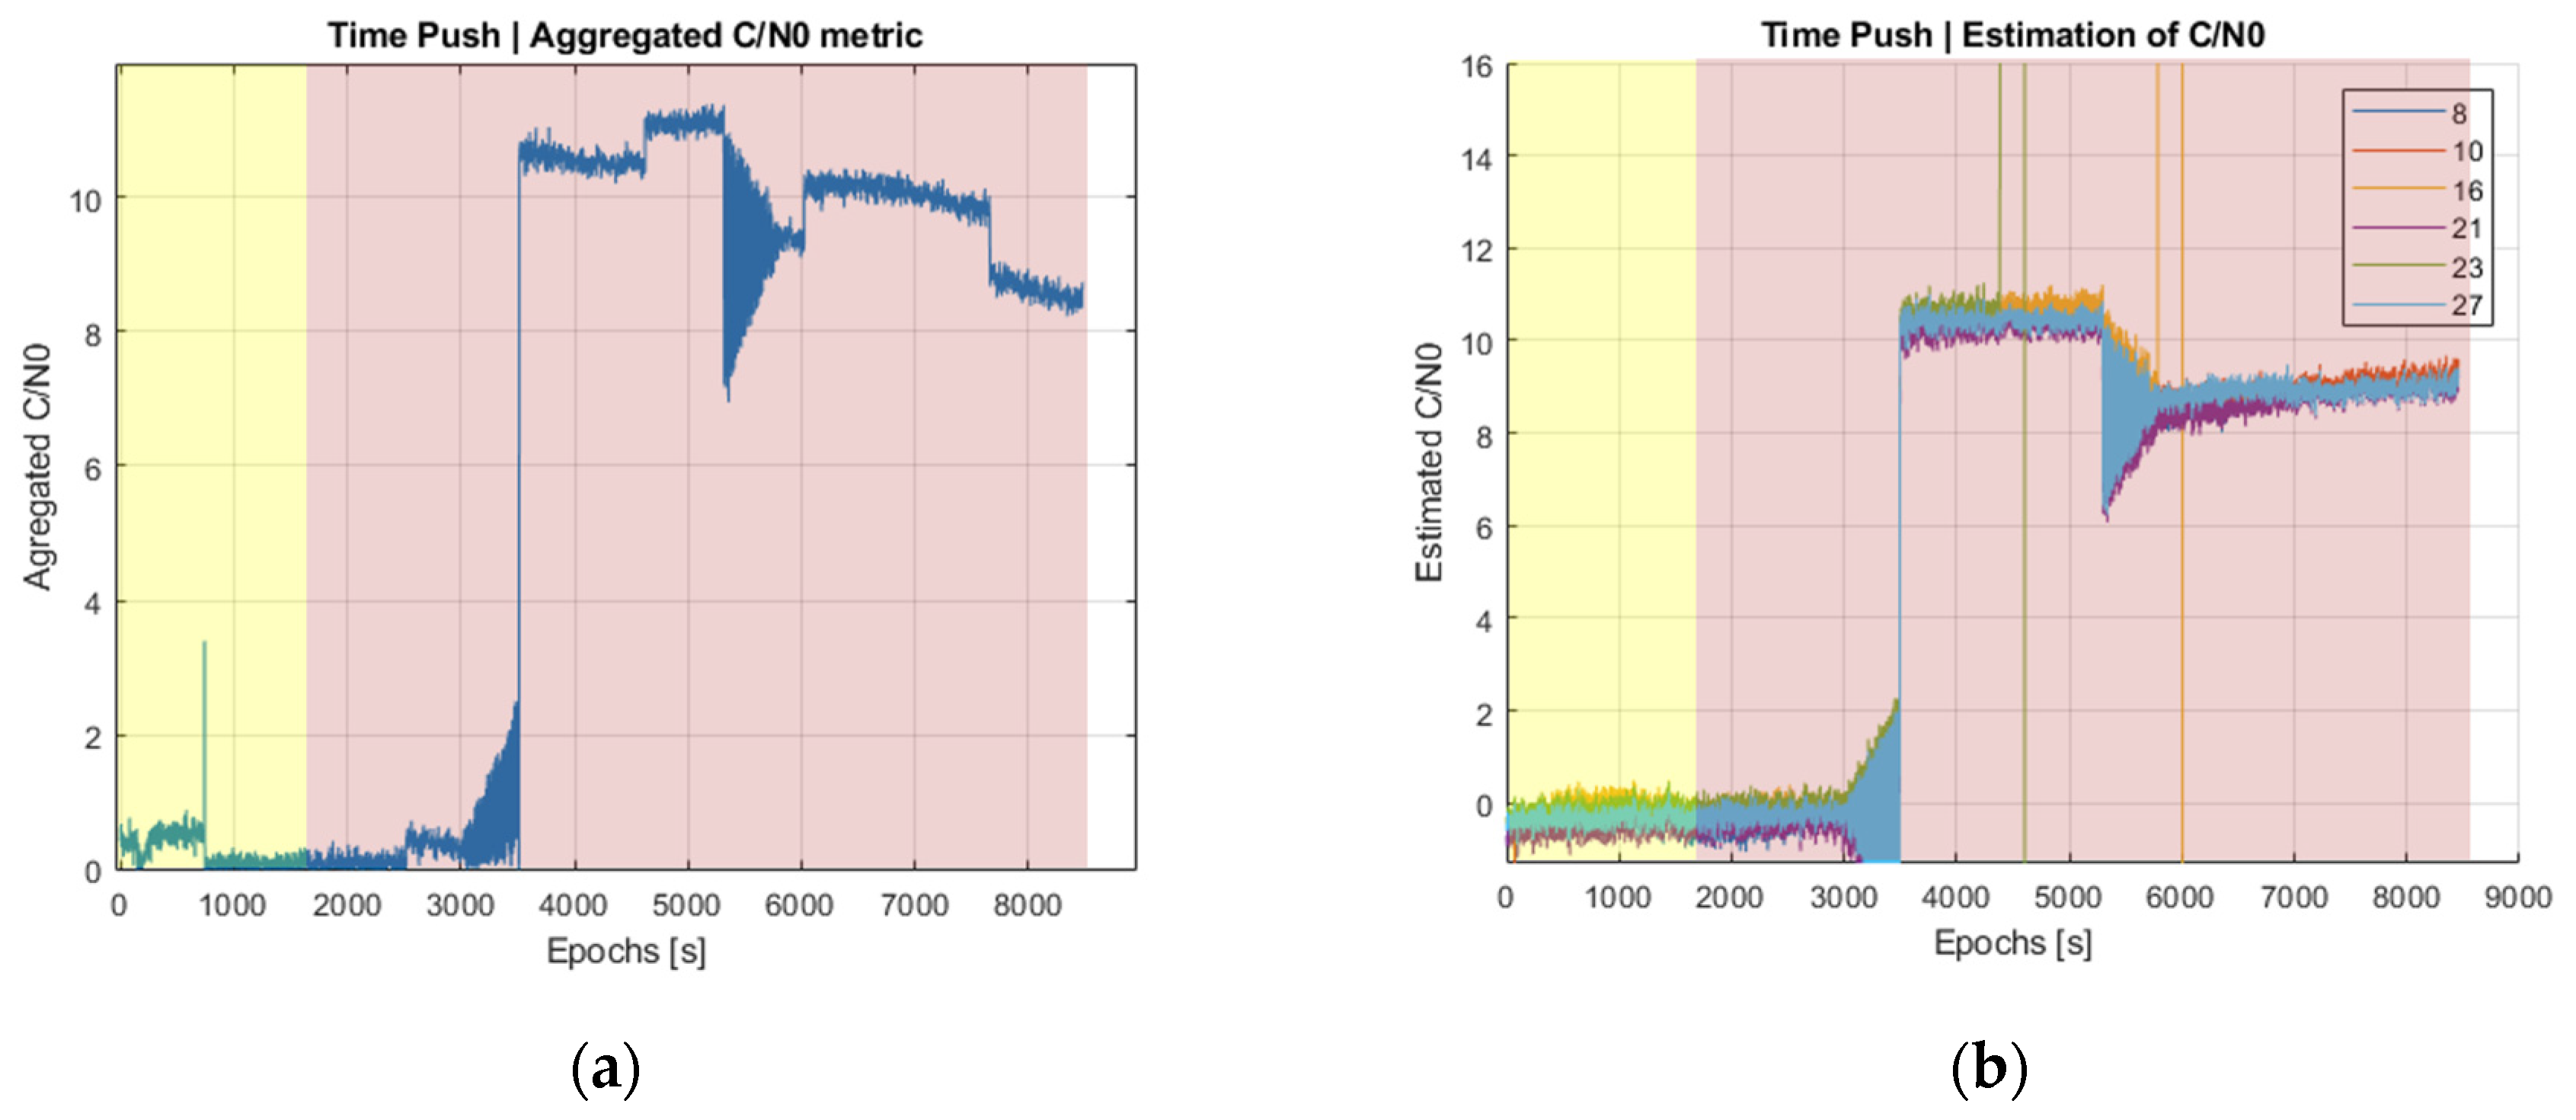
While the test is found to be successful from a spoofer point of view, one may wonder what the actual behavior of the spoofing detection metrics is. The answer is provided in Figure 3 for the case of the power-based detection metrics. One can see that while some disturbance in the measured C/N0 is observed around epoch 3200, it is not until epoch 3600 that a significant change is observed. This corresponds to the instant in time when the spoofer is closely aligned to the authentic signal and when the spoofer power starts to increase, thus causing power-based detection metrics to react accordingly. At this epoch, both the aggregated C/N0 difference and the average C/N0 difference per elevation angle exhibit an abnormal jump that clearly unveils the presence of the spoofer.
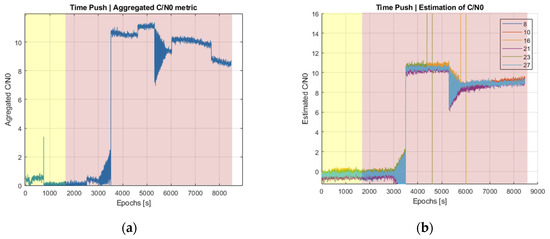
Figure 3.
Power-based detection metrics under a time–push attack. (a) Aggregated C/N0 difference and (b) average C/N0 difference per elevation angle.
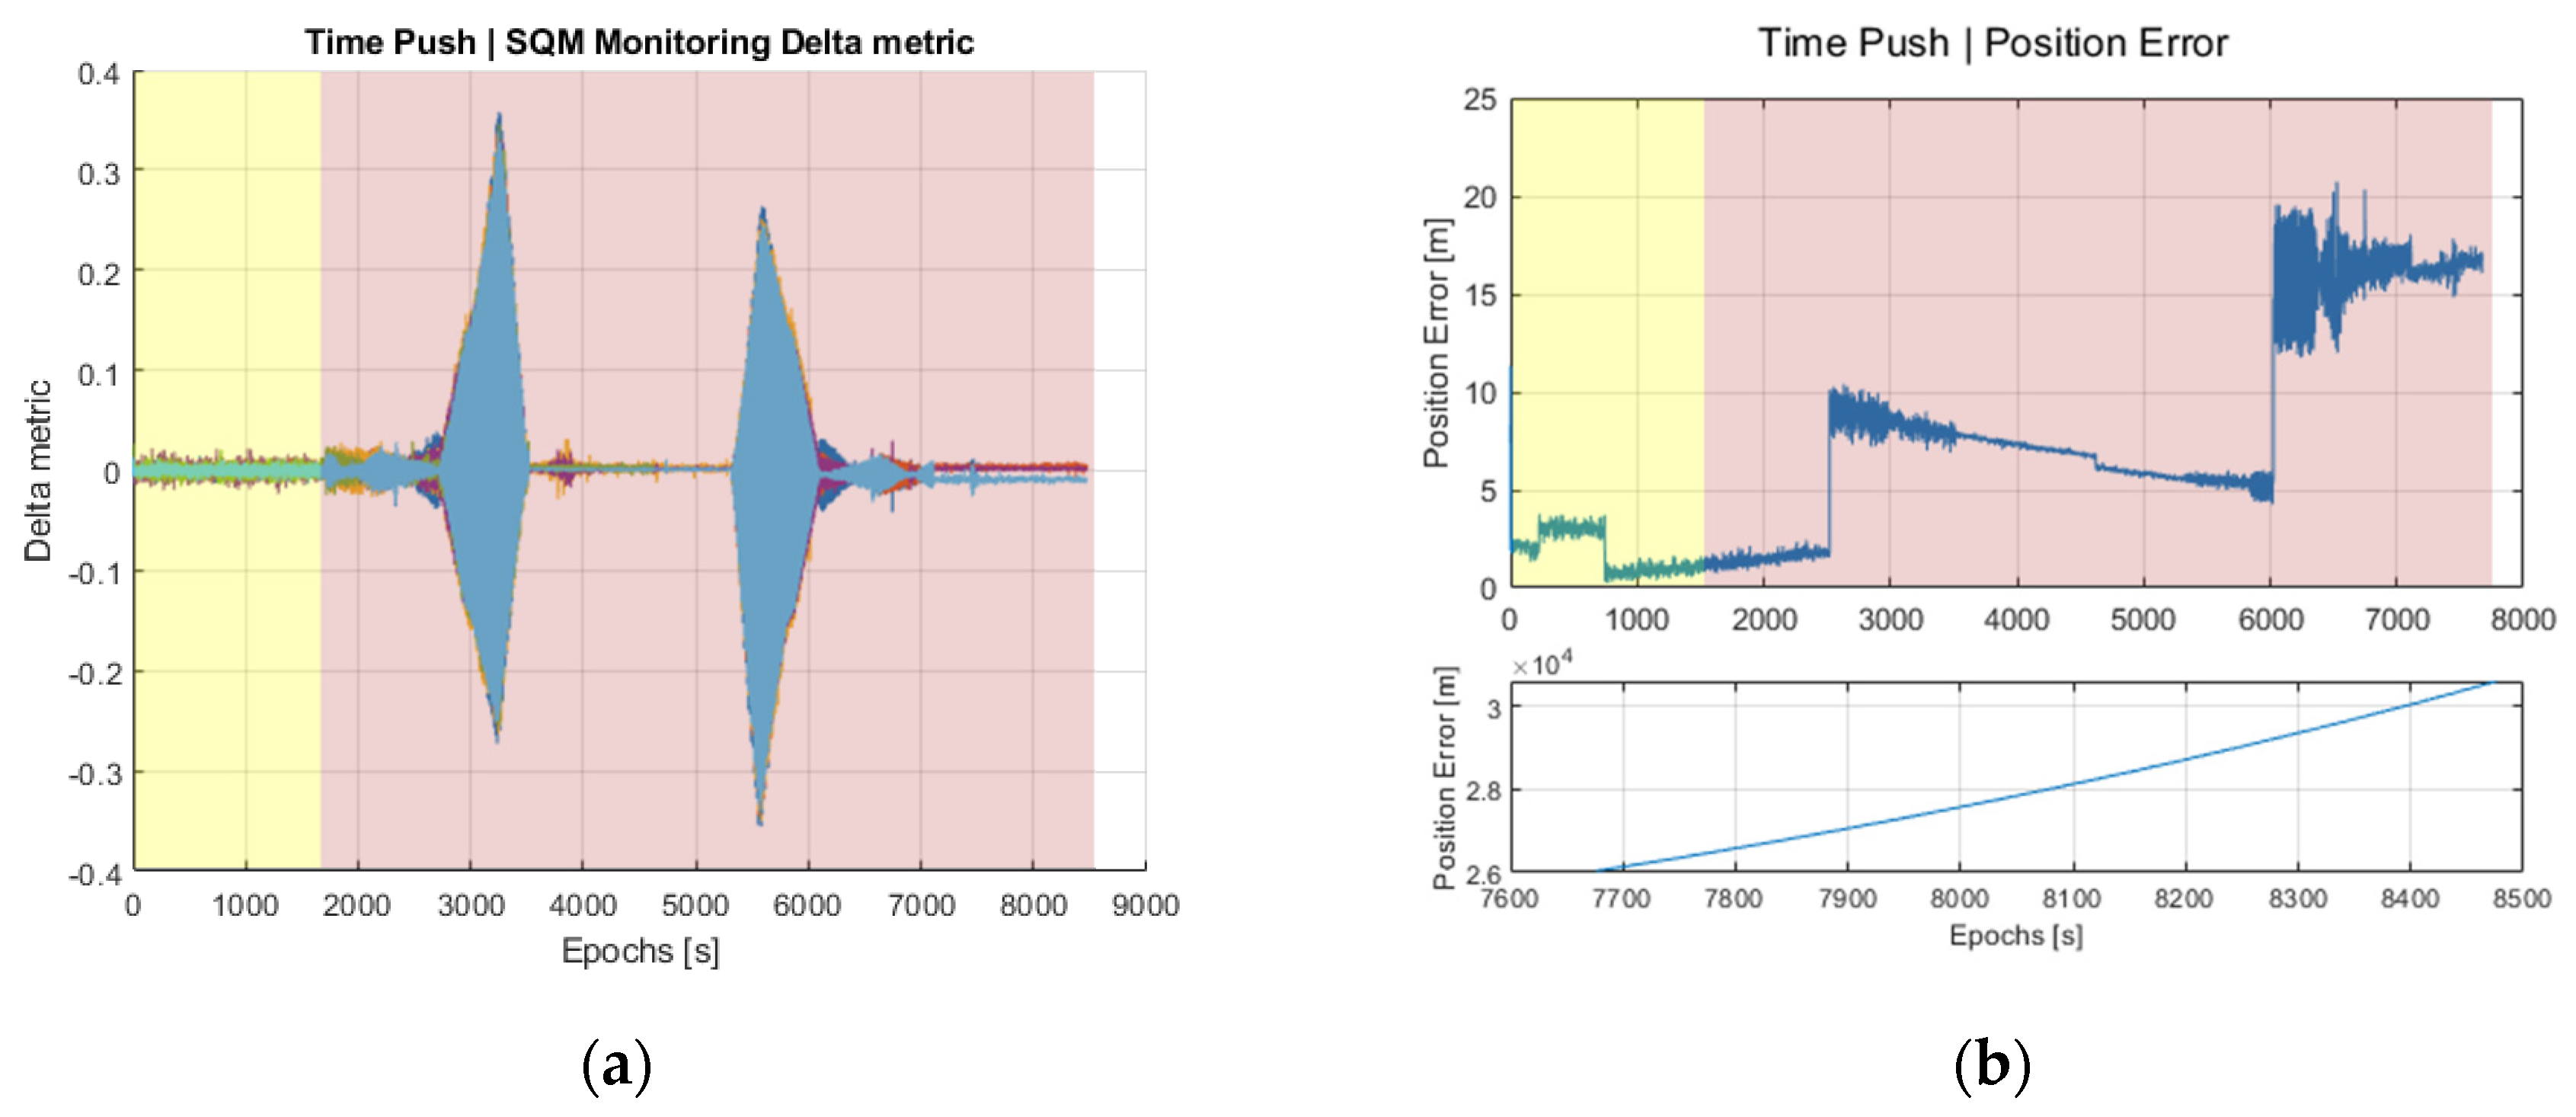
Figure 4a now shows the behavior exhibited by the SQM Delta matric, where two disturbance regions are clearly observed. The first one, close to epoch 3000, is when the spoofer starts to be gradually aligned with the authentic signal in terms of pseudorange. Note that this situation was not clearly perceived in the power-based detection metrics shown in Figure 3 until epoch 3600 when the spoofed signal was totally aligned with the authentic one. The second disturbance event corresponds to the pseudorange push applied at stage 4 of the test, starting at epoch 5401, once the spoofer has taken over the receiver and the spoofed signal is already being tracked. Figure 4b shows the impact in terms of position error, where the first disturbances are observed around epoch 2500, even earlier than for the SQM metric. However, the extent of such a jump is not large enough and could easily be confused with some other effects (e.g., a change in DOP due to satellite visibility). It is not until epoch 6000 that a clear abnormal jump is observed, but this is far too late as compared to the power-based and SQM-based metrics discussed before.
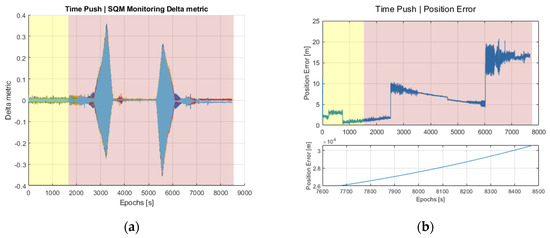
Figure 4.
(a) SQM metric under the time–push attack and (b) position error obtained externally using the pseudoranges provided by the NovAtel G-III receiver. In (b), the upper subplot represents the first, second, third, and fourth stages of the attack, while the lower subplot represents the fifth stage.
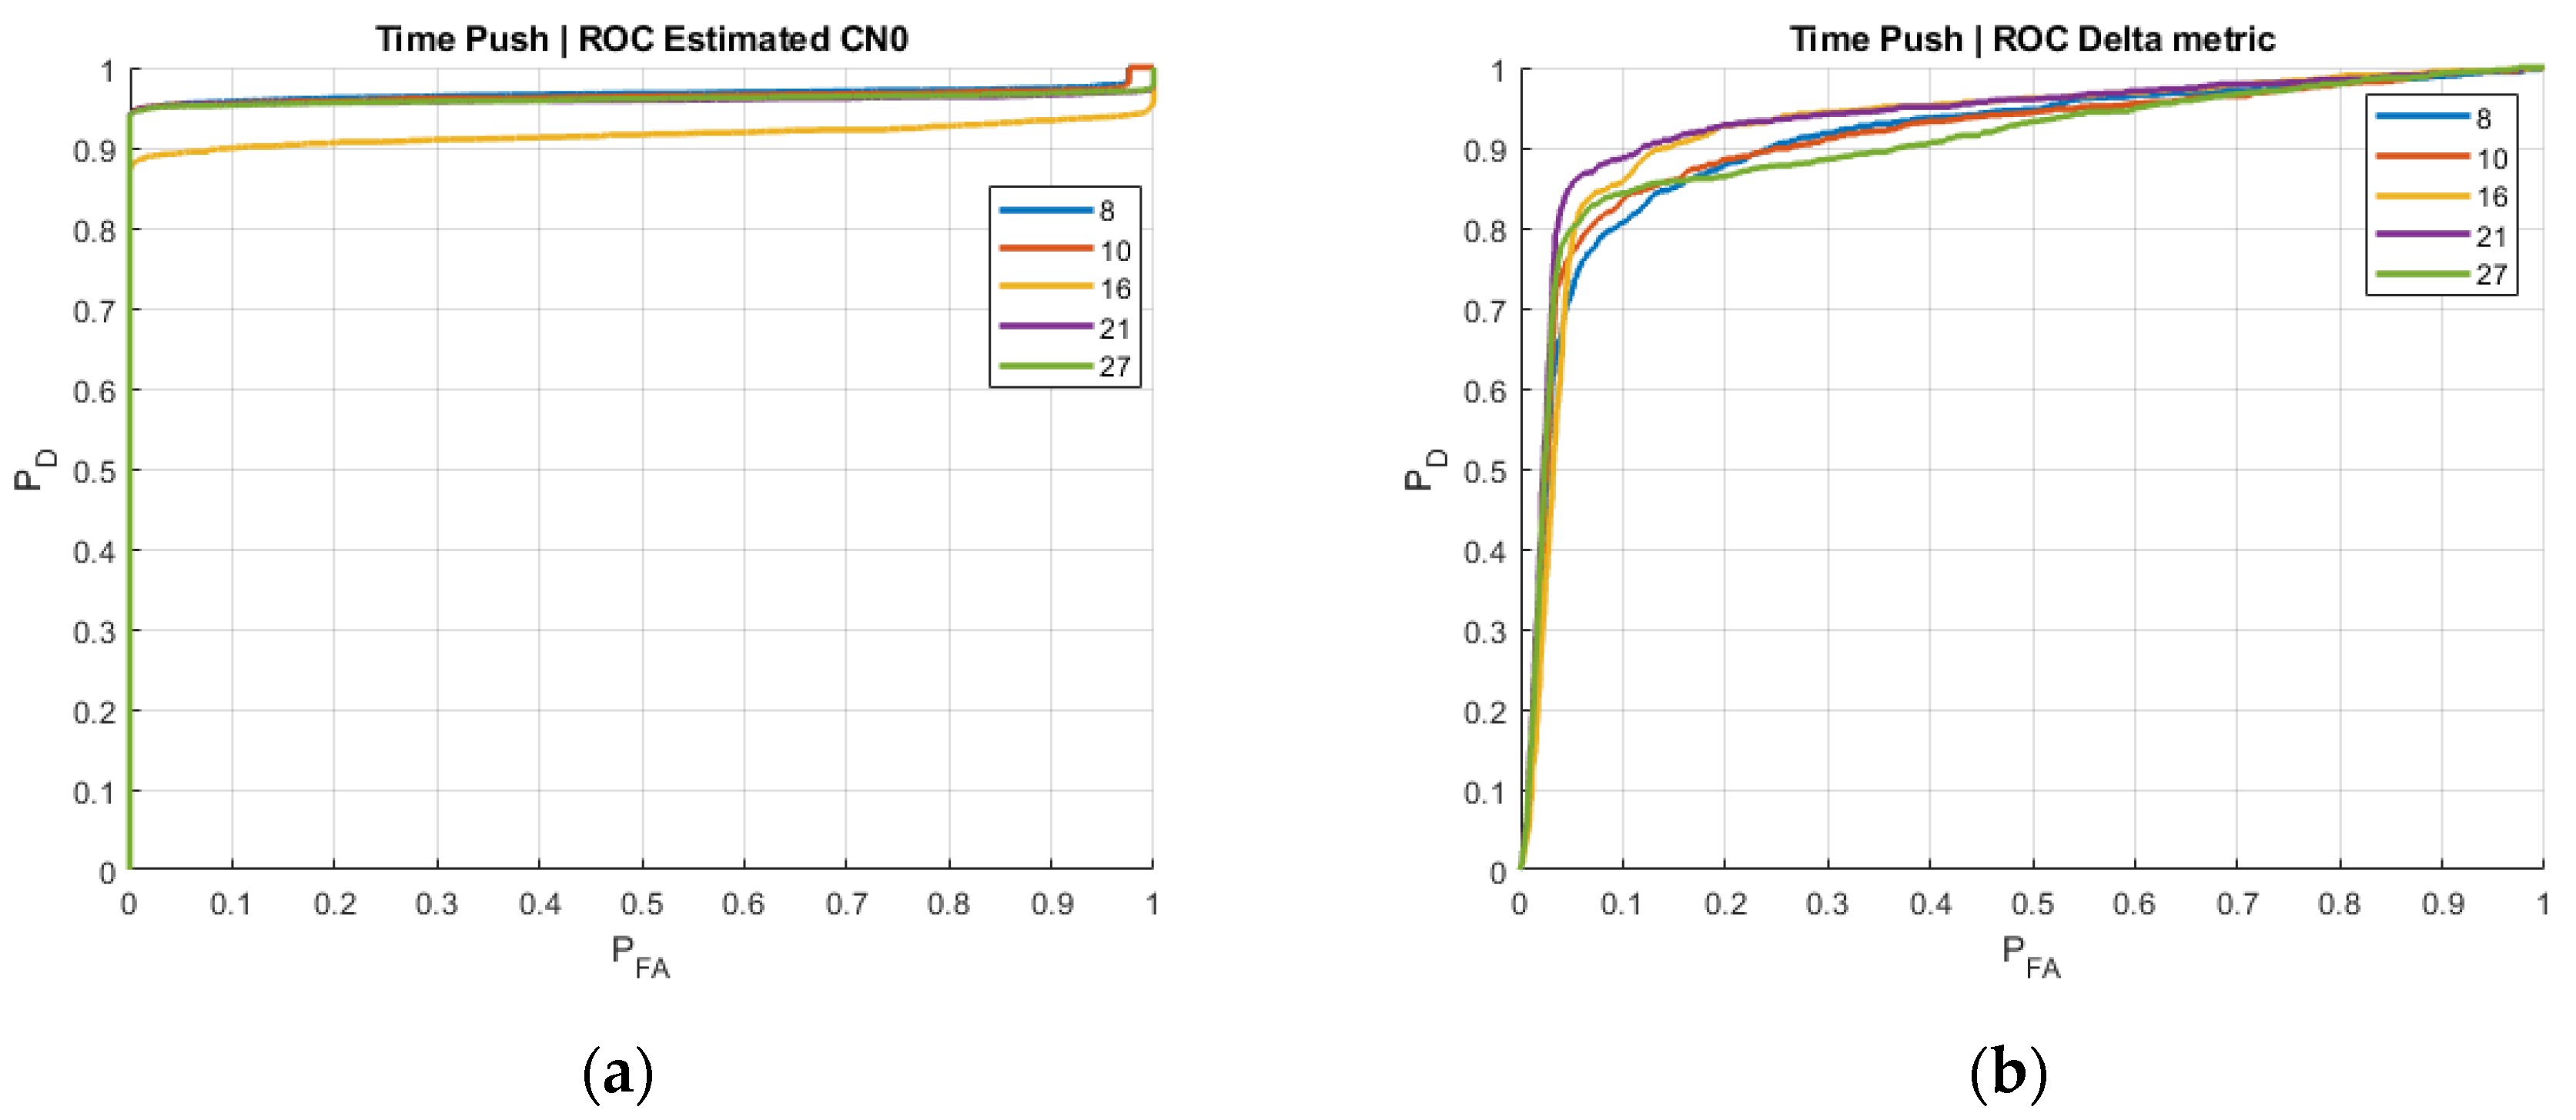
While the previous figures showed the performance of the spoofing techniques over time, it is also interesting to assess their performance in terms of probability of detection and probability of false alarm. This information is provided by the Receiver Operating Characteristic (ROC) curve, an empirical technique that can be used to represent the probability of detection (Y-axis) as a function of the probability of a false alarm (X-axis) [10]. Using this representation, one can easily compare different detectors and find out the one that provides a larger probability of detection for the same probability of false alarm.
The ROC curve is shown in Figure 5 for the SQM Delta metric and the average C/N0 difference per elevation angle. For a small probability of false alarm, as usually desired, the SQM Delta metric provides a larger probability of detection than the average C/N0 difference, thus indicating the superiority of the former in terms of detection capabilities.
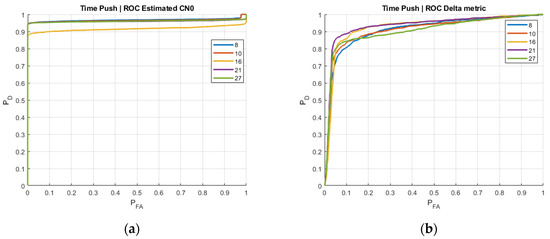
Figure 5.
Receiver Operating Curves (ROC) for (a) the average C/N0 difference per elevation angle and (b) the SQM Delta metric.
4.2. Test #2: “Position-Push” Spoofer
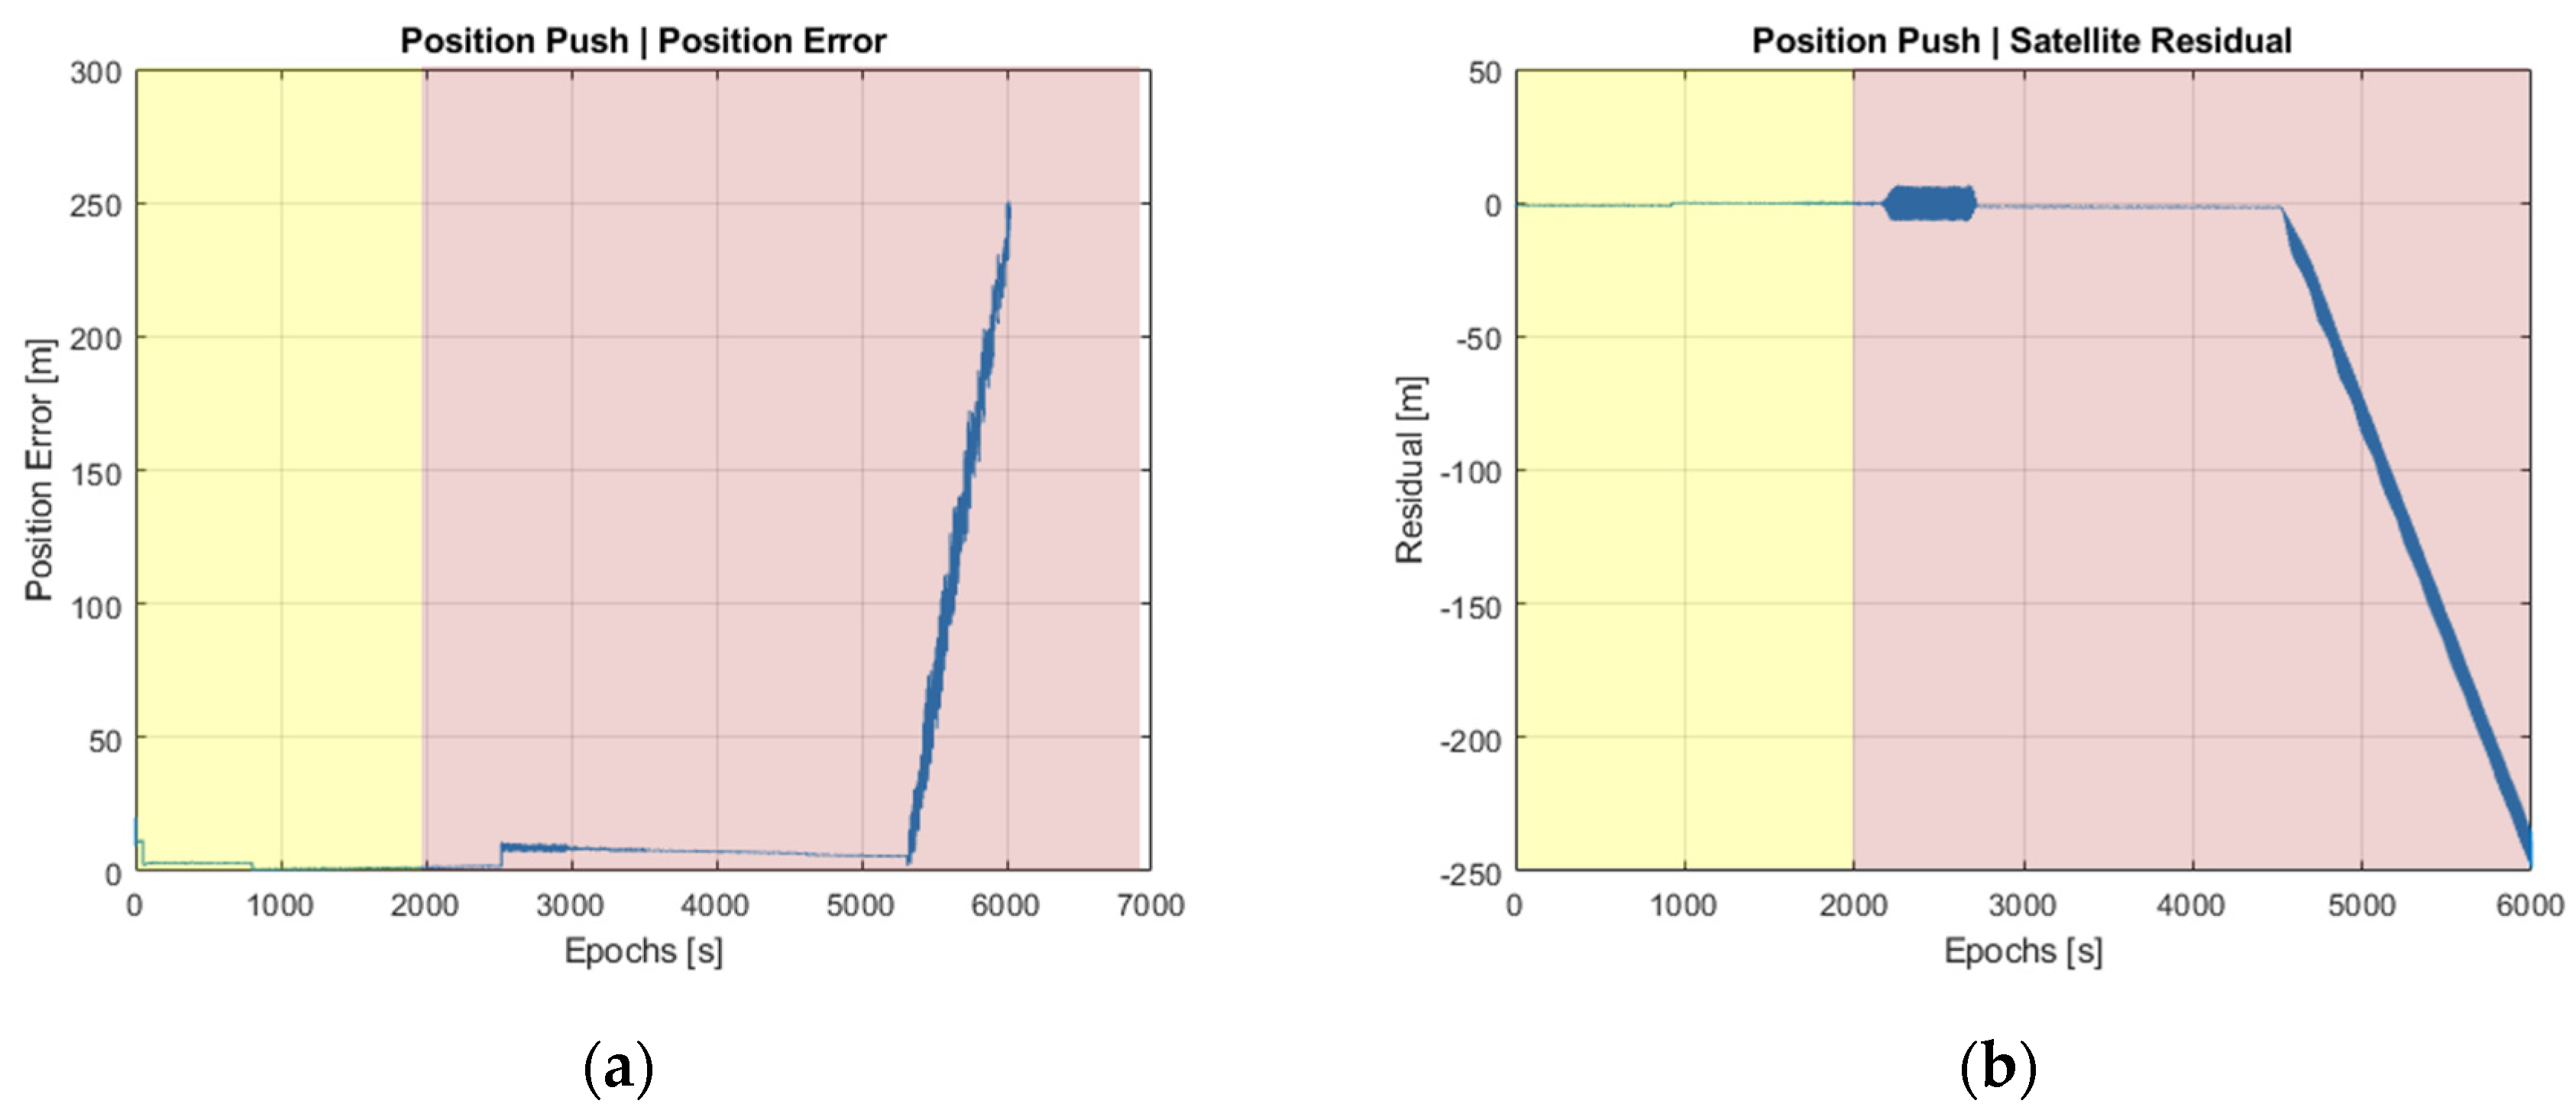
This test involves monitoring the residual errors of the position estimates, which, as mentioned in Section 2.4, are computed externally by the SBAS reference receiver. In contrast to the previous “time-push” test, where a common pseudorange offset was applied to all satellites, the present “position-push” test is intended to push the position estimates toward a fake location. To do so, different pseudorange offsets are applied to the visible satellites. Results in the position domain are shown in Figure 6.
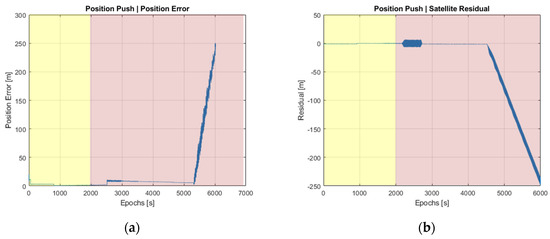
Figure 6.
Position monitoring performance during position–push attacks. (a) Temporal evolution of position error; (b) residual found in one of the attacked satellites.
As can be seen in Figure 6b, disturbances are observed around time epoch 2500, when the spoofer is approaching the authentic signal. It is not until epoch 4500, though, that it becomes clear that an abnormal effect is present. Beyond time epoch 6000, the T-RAIM method natively implemented in the NovAtel G-III receiver detects such abnormal situations and stops the receiver from providing additional measurements.
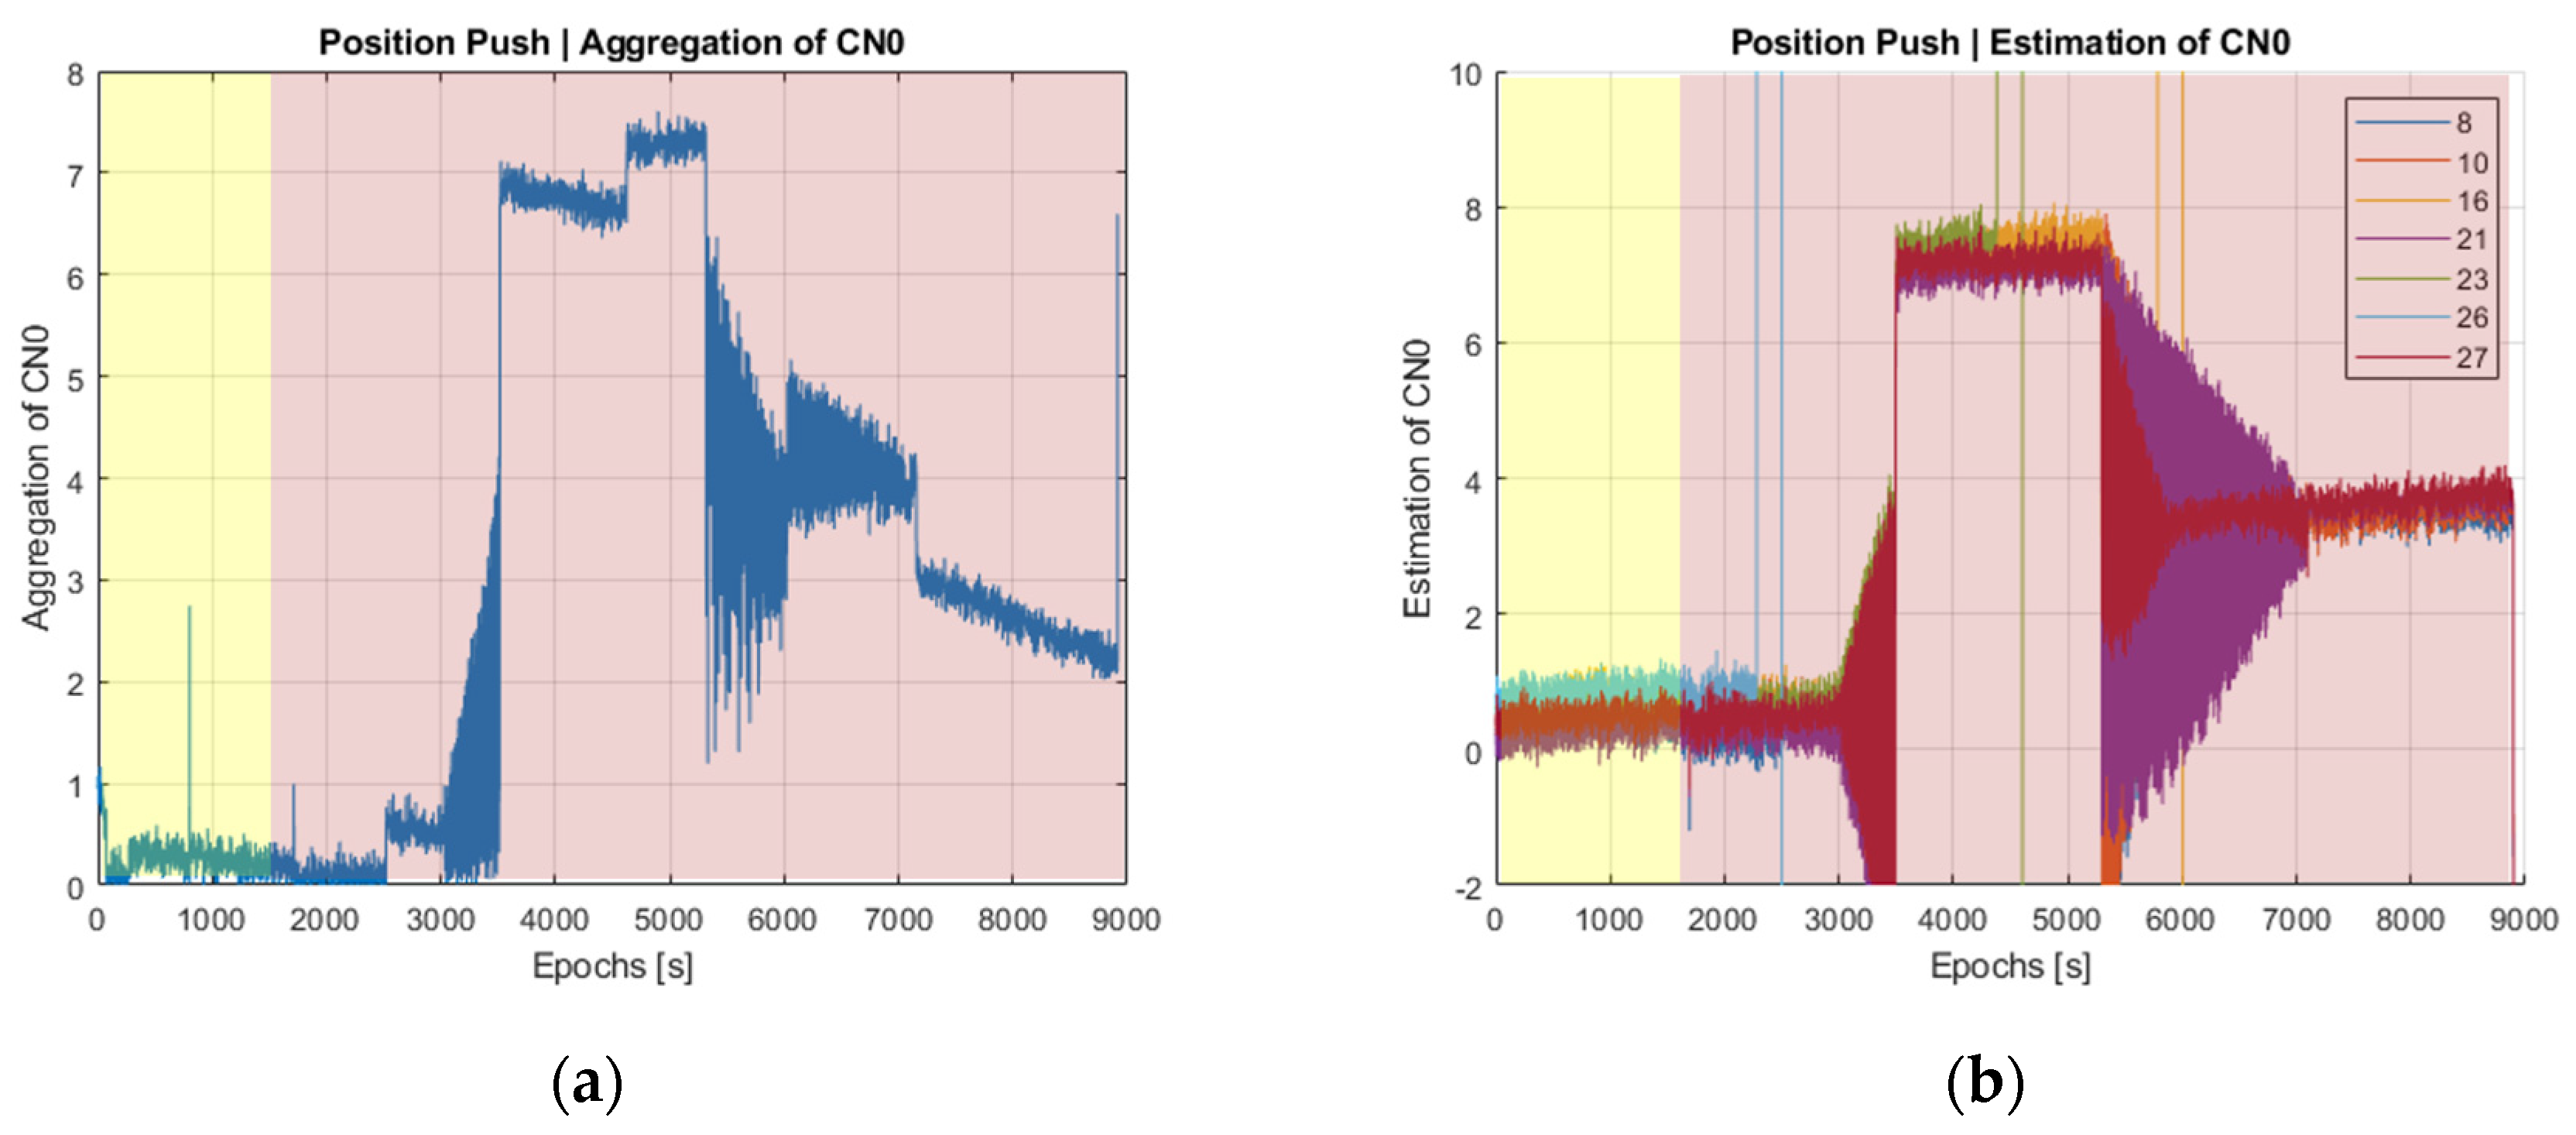
In turn, Figure 7 represents the behavior of power-based detection metrics. As can be observed in Figure 7a, the jump experienced by the aggregated C/N0 difference at epoch 3600 is now a bit smaller than for the time–push attack in Figure 3 (7 dB vs. 10 dB jump), while for the average C/N0 difference per elevation angle in Figure 7b, fluctuations are now much larger than in Figure 3b. This latter effect is due to the heterogeneity of pseudorange offsets, and thus spoofer alignments, in the position–push attack since not all satellites are pushed in the same manner. When compared to the results of the position-domain detection metrics in Figure 6, the observed jumps of power-based metrics do appear earlier and with a larger jump, which clearly unveils the presence of a spoofer.
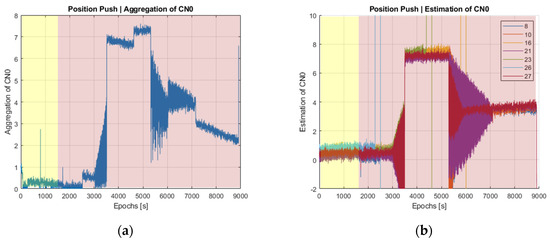
Figure 7.
Power-based detection metrics under a position–push attack. (a) Aggregated C/N0 difference and (b) average C/N0 difference per elevation angle.
The ROC analysis, depicted in Figure 8, confirms the capability of the considered techniques to reliably detect the presence of spoofer, particularly for power-based detection metrics, which provide a reliable detection for small probabilities of false alarm. In contrast, SQM-based detection metrics typically provide fast detection, but their ROC curve is more variable, suggesting a larger sensitivity to other propagation effects.
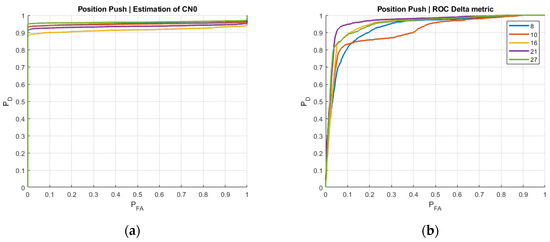
Figure 8.
Power-based metrics under a position–push attack. (a) ROC of the aggregated C/N0 difference and (b) average C/N0 difference per elevation angle.
4.3. Test #3: CW Interference
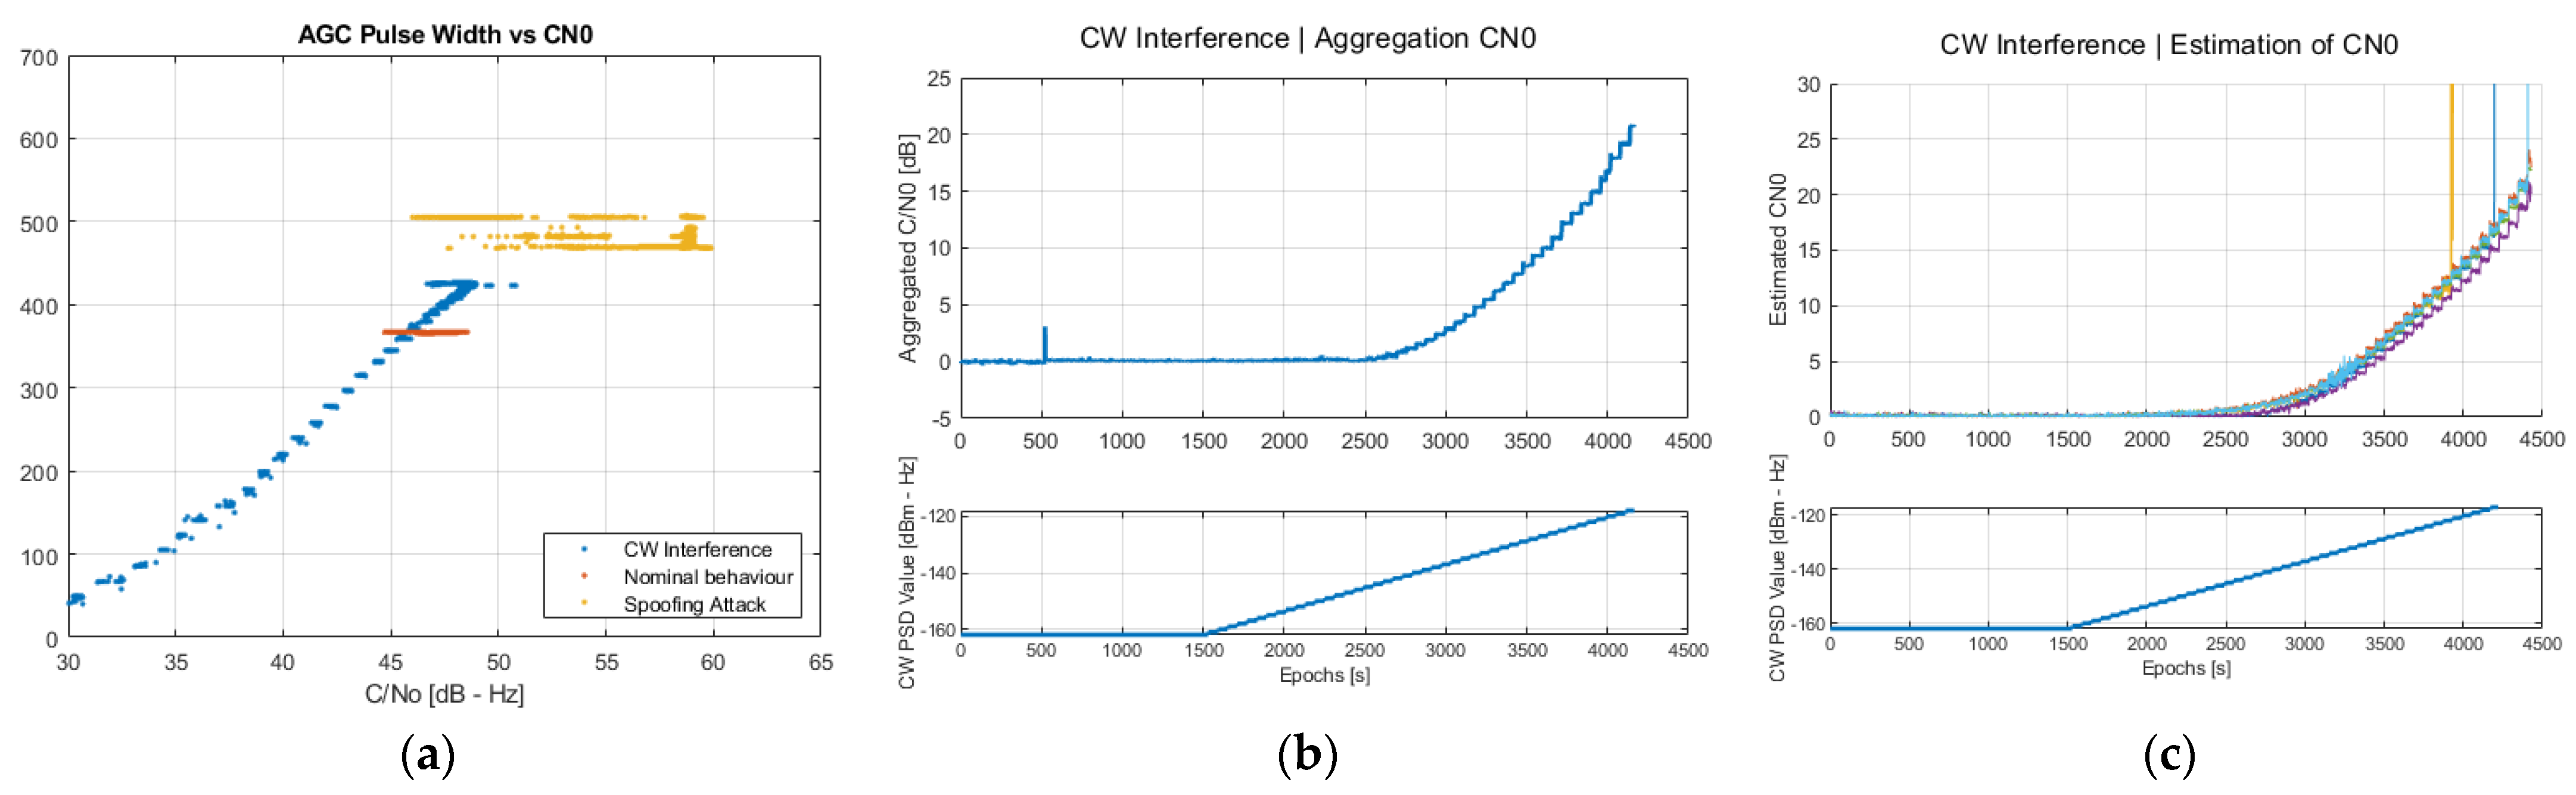
This test focuses on a jammer attack where a sweeping power CW interference is transmitted at the central frequency 1575.42 MHz + 10 MHz, close to the edge of the NovAtel G-III receiver bandwidth covering 1575.42 MHz 12 MHz. As an additional metric for this test, the values reported by the NovAtel G-III receiver on the automatic gain control (AGC) will be used, which are contained in the “Pulse width” field of the AGCINFOB log message. By comparing the reported AGC values against the measured C/N0, it is possible to distinguish between a spoofer or jammer attack, as shown in Figure 9a. In nominal conditions, the AGC pulse width should remain constant, and variations of the C/N0 may be observed as a result of the normal behavior of the visible satellites (see red dots in Figure 9a). In contrast, when interference is present, the AGC pulse width significantly departs from its nominal value (see blue dots in Figure 9a). Finally, when a spoofer is present, the AGC pulse width does not change significantly, provided that the spoofer power remains commensurate with that of authentic GNSS signals. However, variations on the C/N0 are clearly observed (see yellow dots in Figure 9a) due to the overlap of both signals at the receiver correlation. To sum up, the ability to classify potential attacks is an interesting feature that would allow for the improvement of the effectiveness of the developed countermeasures.
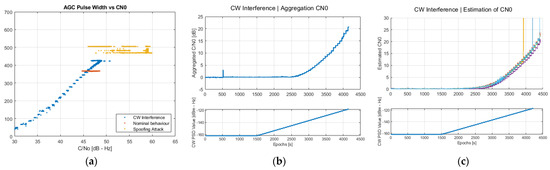
Figure 9.
Detection metrics under a CW jammer attack. (a) AGC pulse width vs. average C/N0; (b) aggregated C/N0 difference; (c) average C/N0 difference per elevation angle per satellite, every color represents a PRN tracked.
Finally, results in Figure 9b,c represent the evolution of the power-based detection metrics as a function of time, where the power sweep of the CW interference is shown in their bottom subplots. The noise spectral density at the input of the NovAtel G-III receiver was set to −142 dBm/Hz in nominal conditions. In general, and despite being an interference at the edge of the receiver bandwidth, power-based detection metrics are found to be quite sensitive to the presence of the CW jammer as soon as the power spectral density of the latter surpasses the noise floor. At this point, both the aggregated C/N0 difference and the average C/N0 difference per elevation angle exhibit a 3 dB increase, then linearly increasing, mimicking the behavior of the CW power. This suggests that detecting CW interference can easily be achieved by properly monitoring these metrics.
5. Conclusions
This work has focused on leveraging the output observables provided by the NovAtel G-III SBAS receiver to implement a selected set of interference and spoofing detection techniques. While techniques for this purpose have been widely studied in the existing literature, few contributions are available on their adaptation and application to an SBAS receiver. In this sense, the results presented so far are intended to shed light on how to use the available output data from an SBAS receiver and how the implementation of interference and spoofing techniques can clearly unveil the presence of such threats, thus providing an additional layer of security to SBAS receivers.
A total of four representative threat detection techniques have been implemented using the output data logs provided by the NovAtel G-III receiver. They correspond to the SQM-based Delta metric, the aggregate C/N0 difference, and the average C/N0 difference per elevation angle as representative power-based metrics, as well as the position and residual errors as position-based metrics. In general, it was found that the SQM-based Delta metric is providing the fastest response in front of spoofing attacks, being able to react to the presence of such threats well in advance with respect to power-based and position-based detection metrics. Nevertheless, power-based detection metrics were found to provide a more reliable detection in all attacks in terms of a higher probability of detection for a given probability of false alarm, as confirmed via the ROC analysis. This confirms that threat detection cannot rely on a single detection technique and must, instead, rely on a combination of them to ensure optimal performance.
Future research will focus on implementing attacker classification techniques, such as the one depicted in Figure 9a. This approach aims to distinguish among different types of attacks, thereby enabling the development of tailored mitigation strategies. Understanding the nuances of each attack type is crucial, as mitigation effectiveness directly correlates with the specific characteristics of the attack. By discerning between different attack scenarios, it becomes possible to devise more precise and targeted mitigation techniques, ultimately enhancing the integrity of SBAS reference receivers.
Author Contributions
Conceptualization, M.S.-G. and S.L.-S.; methodology, software, validation, formal analysis, and investigation, X.Á.-M., G.S.-G. and J.A.L.-S.; writing—original draft preparation, X.Á.-M.; writing—review and editing, X.Á.-M., M.S.-G., S.L.-S. and J.A.L.-S.; supervision, M.S.-G. and J.A.L.-S. All authors have read and agreed to the published version of the manuscript.
Funding
This work was mostly supported by a private contract with Indra Espacio and, in part, by the Spanish Agency of Research project PID2020-118984GB-I00/AEI/10.13039/501100011033.
Institutional Review Board Statement
Not applicable.
Informed Consent Statement
Not applicable.
Data Availability Statement
The datasets used in this work are part of a private contract and, therefore, are not publicly available.
Acknowledgments
The authors would like to thank the reviewers for their valuable comments, which helped improve the quality of the final paper.
Conflicts of Interest
M.S.-G and S.L-S. were employed by Indra Espacio. The remaining authors declare that the research was conducted in the absence of any commercial or financial relationships that could be construed as a potential conflict of interest. The authors declare that this study received funding from Indra Espacio. The funder had the following involvement with the study: study definition, workplan definition, and study supervision.
References
- Li, R.; Chen, G.; Lachapelle, G.; Feng, Y. A GNSS Spoofing Detection Method Based on Signal Analysis and Data Fusion. IEEE Trans. Aerosp. Electron. Syst. 2016, 52, 638–654. [Google Scholar]
- Albright, A.; Powers, S.; Bonior, J.; Combs, F.L. A Tool for Furthering GNSS Security Research: The Oak Ridge Spoofing and Interference Test Battery (OAKBAT). In Proceedings of the ION International Technical Meeting, Online, 21–25 September 2020. [Google Scholar]
- Humphreys, T.E.; Psiaki, M.L. The Texas Spoofing Test Battery: Toward a Standard for Evaluating GPS Signal Authentication Techniques. In Proceedings of the ION International Technical Meeting, Nashville, TN, USA, 17–21 September 2012. [Google Scholar]
- Lemmenes, A.; Corbell, P.M.; Gunawardena, S. Detailed Analysis of the TEXBAT Datasets Using a High-Fidelity Software GPS Receiver. In Proceedings of the ION International Technical Meeting, Portland, OR, USA, 12–16 September 2016. [Google Scholar]
- Jafarnia-Jahromi, A.; Broumandan, A.; Nielsen, J.; Lachapelle, G. GPS Vulnerability to Spoofing Threats and a Review of Antispoofing Techniques. Int. J. Navig. Obs. 2012, 2012, 127072. [Google Scholar] [CrossRef]
- Novatel. WAAS G-III Receiver. Available online: https://novatel.com/products/receivers/ground-reference-uplink-receivers/waas-g-iii-receiver (accessed on 8 October 2024).
- Safran. Skydel GNSS Simulation Software. Available online: https://safran-navigation-timing.com/product/gsg-8-advanced-gnss-simulator (accessed on 8 October 2024).
- Sun, C.; Cheong, J.W.; Dempster, A.; Zhao, H.; Feng, W. GNSS Spoofing Detection by Means of Signal Quality Monitoring (SQM) Metric Combinations. IEEE Access 2018, 6, 66428–66441. [Google Scholar] [CrossRef]
- Manfredini, E.G.; Akos, D.M.; Chen, Y.-H.; Lo, S.; Walter, T.; Enge, P. Effective GPS Spoofing Detection Utilizing Metrics from Commercial Receivers. In Proceedings of the 2018 International Technical Meeting of The Institute of Navigation, Reston, VA, USA, 29 January–1 February 2018; pp. 672–689. [Google Scholar]
- Fawcett, T. An Introduction to ROC Analysis. Pattern Recognit. Lett. 2006, 27, 861–874. [Google Scholar] [CrossRef]

Disclaimer/Publisher’s Note: The statements, opinions and data contained in all publications are solely those of the individual author(s) and contributor(s) and not of MDPI and/or the editor(s). MDPI and/or the editor(s) disclaim responsibility for any injury to people or property resulting from any ideas, methods, instructions or products referred to in the content. |
© 2025 by the authors. Licensee MDPI, Basel, Switzerland. This article is an open access article distributed under the terms and conditions of the Creative Commons Attribution (CC BY) license (https://creativecommons.org/licenses/by/4.0/).