3.1. Impact Category Results
Table 4 and
Table 5 present the environmental impact category results for the four scenarios.
Table 4 shows that for impact assessed per m
3 of concrete produced, scenarios with UHPC (scenarios 2, 3, and 4) led to a much higher environmental impact for most of the impact categories compared to conventional concrete results (scenario 1). This was already expected, as the rate of cement in UHPC was much higher than in conventional concrete, leading to an increase in environmental impacts directly related to cement consumption.
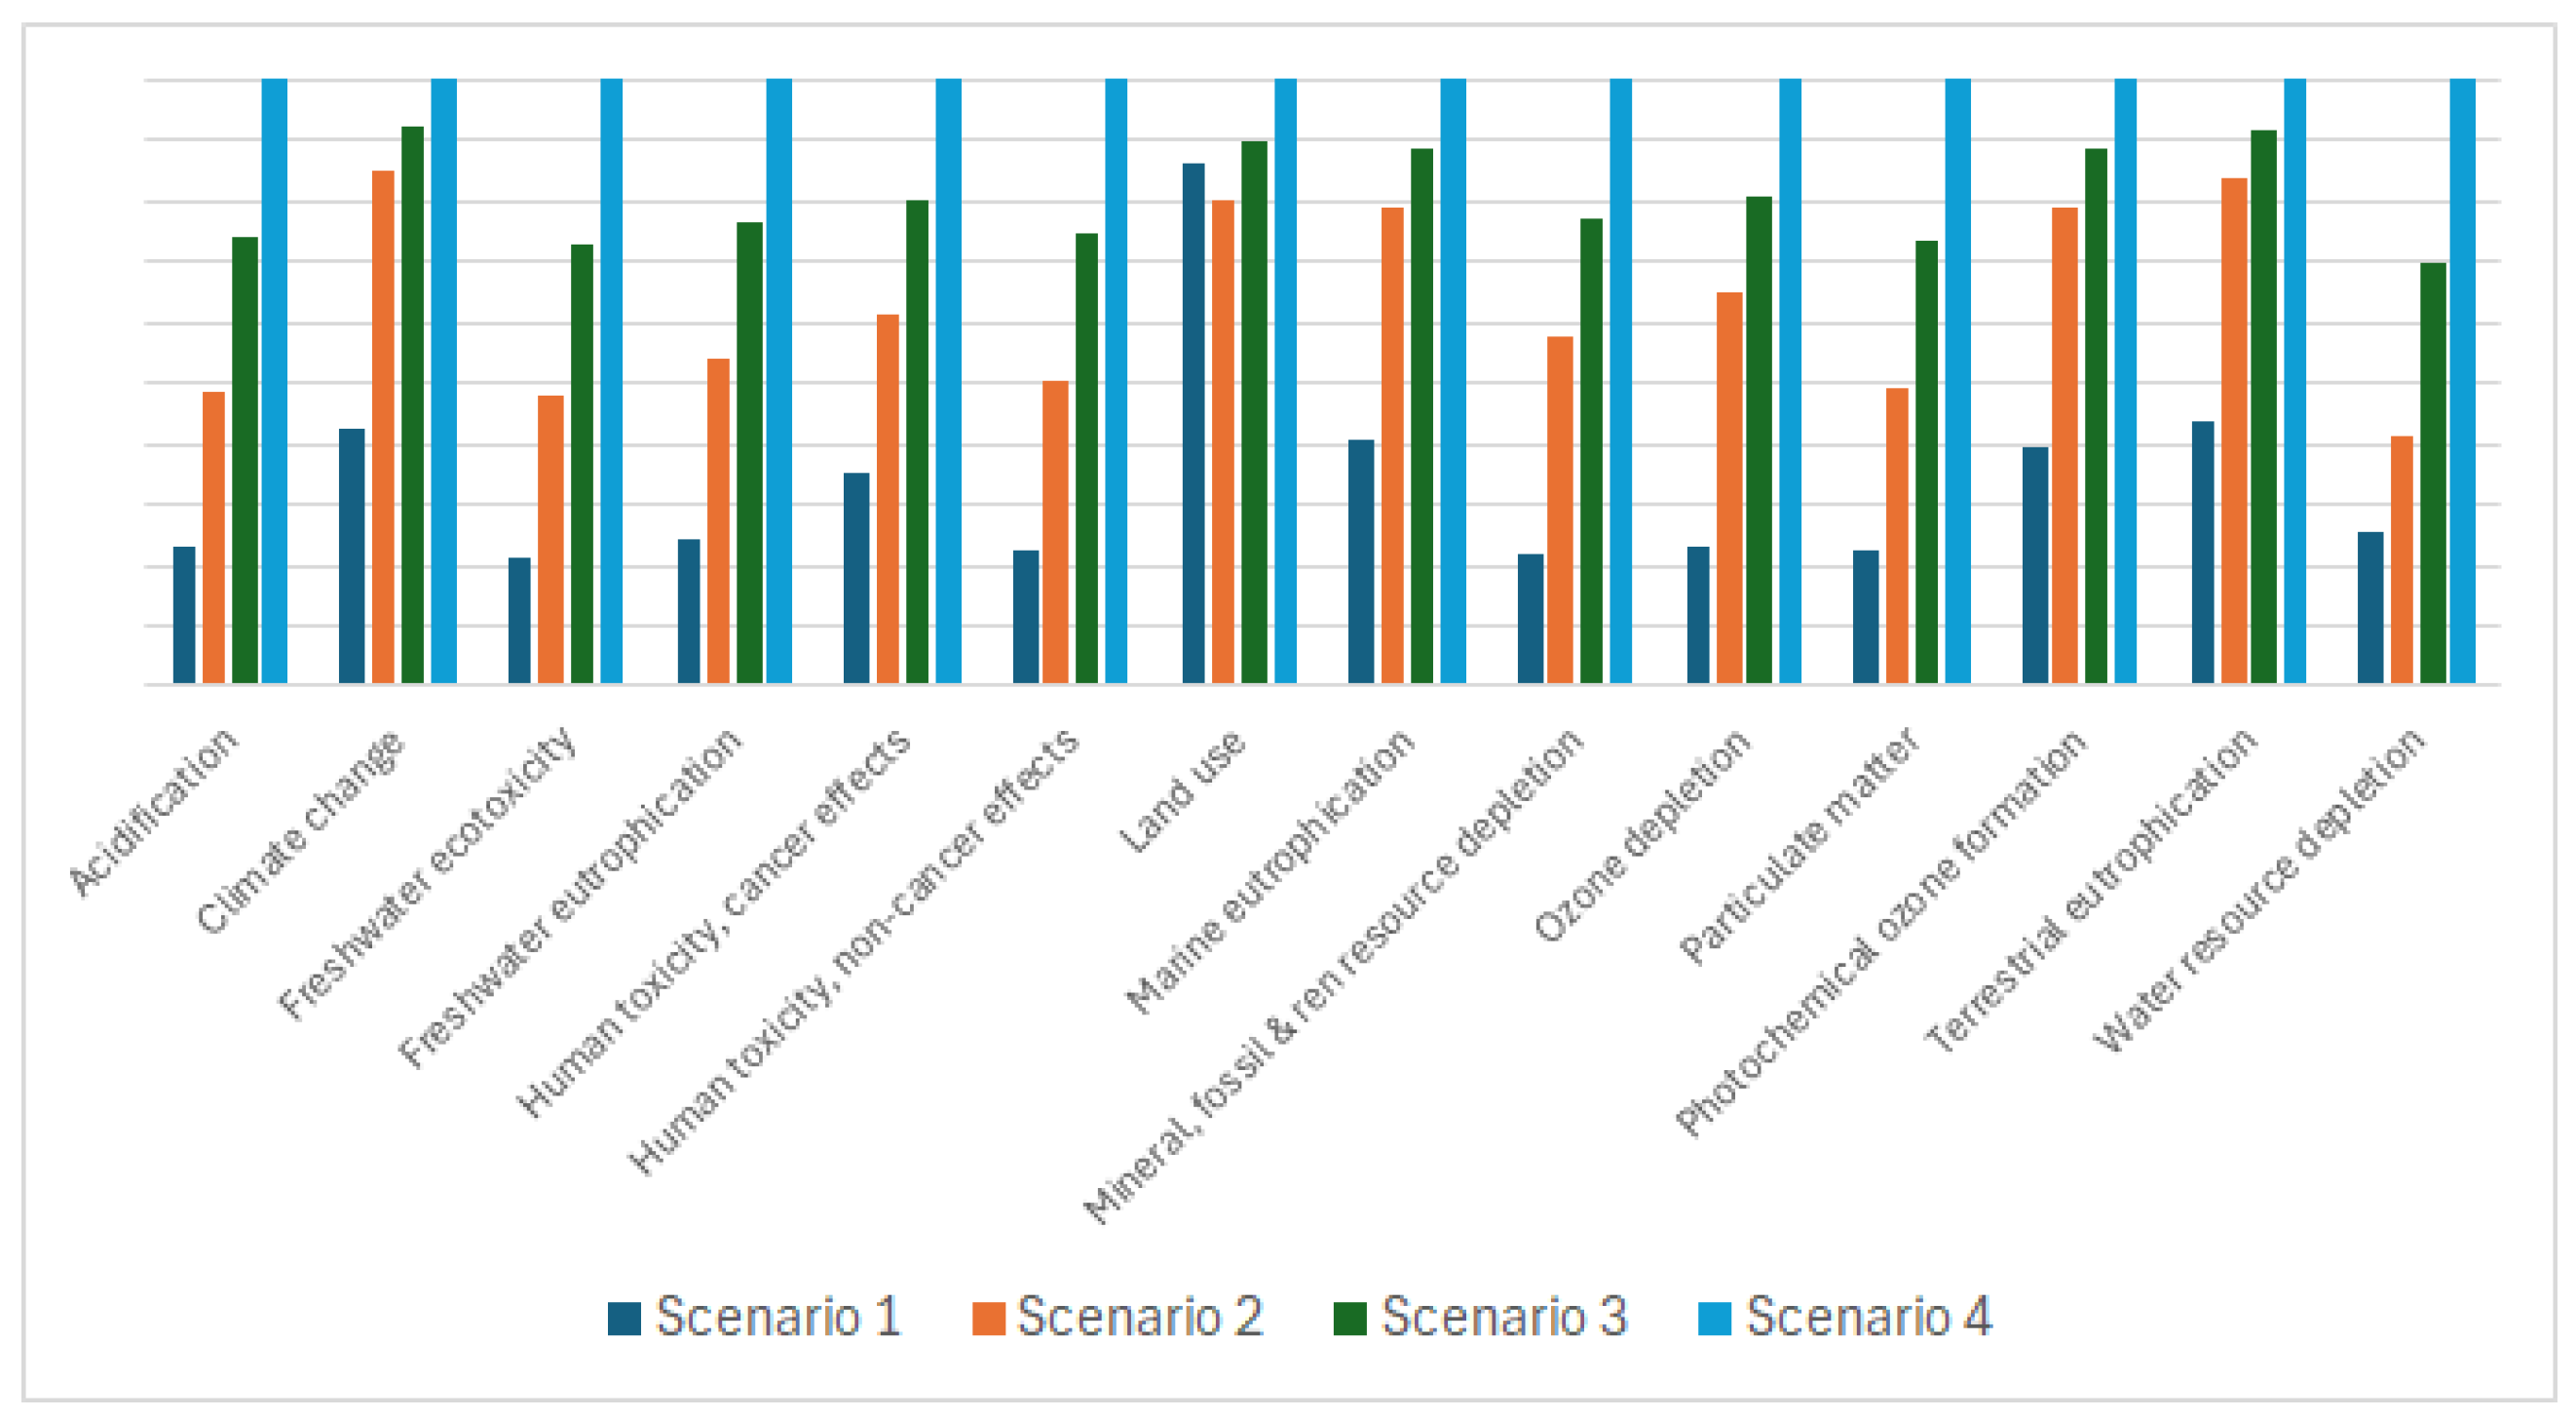
This can be seen in
Figure 1, which shows the impact ratio for scenarios 2 to 4 compared to scenario 1, considering FU impacts per m
3 of concrete. This explains the difference in the climate change impact category, in which the demand for cement plays an important role in the result of that category. Indeed, the climate change emissions for scenario 4 are 731 kg CO
2eq, which is 2.4 times higher than for scenario 1 (309 kg CO
2eq).
For mineral resource depletion, scenarios 2 to 4 also presented a much higher impact than scenario 1. This is also related to the higher cement rate in UHPC, and was even worse in scenarios 3 and 4, due to the additional demand for resources used in the production of GO. Regarding eutrophication, scenarios 3 and 4 presented a much higher impact due to phosphate emissions linked to chemicals required for GO production.
For acidification, impacts in this category were mainly related to nitrogen oxides and sulfur dioxides emissions during clinker production, followed by plasticizer manufacturing related flows. Concerning water depletion, it can also be seen that the scenarios including GO in concrete also resulted in 3 times more impact for that category than the baseline case (scenario 1), mainly due to the water demand related to GO production, as the water ratio from conventional concrete and UHPC is not very different, as shown in
Table 2.
According to
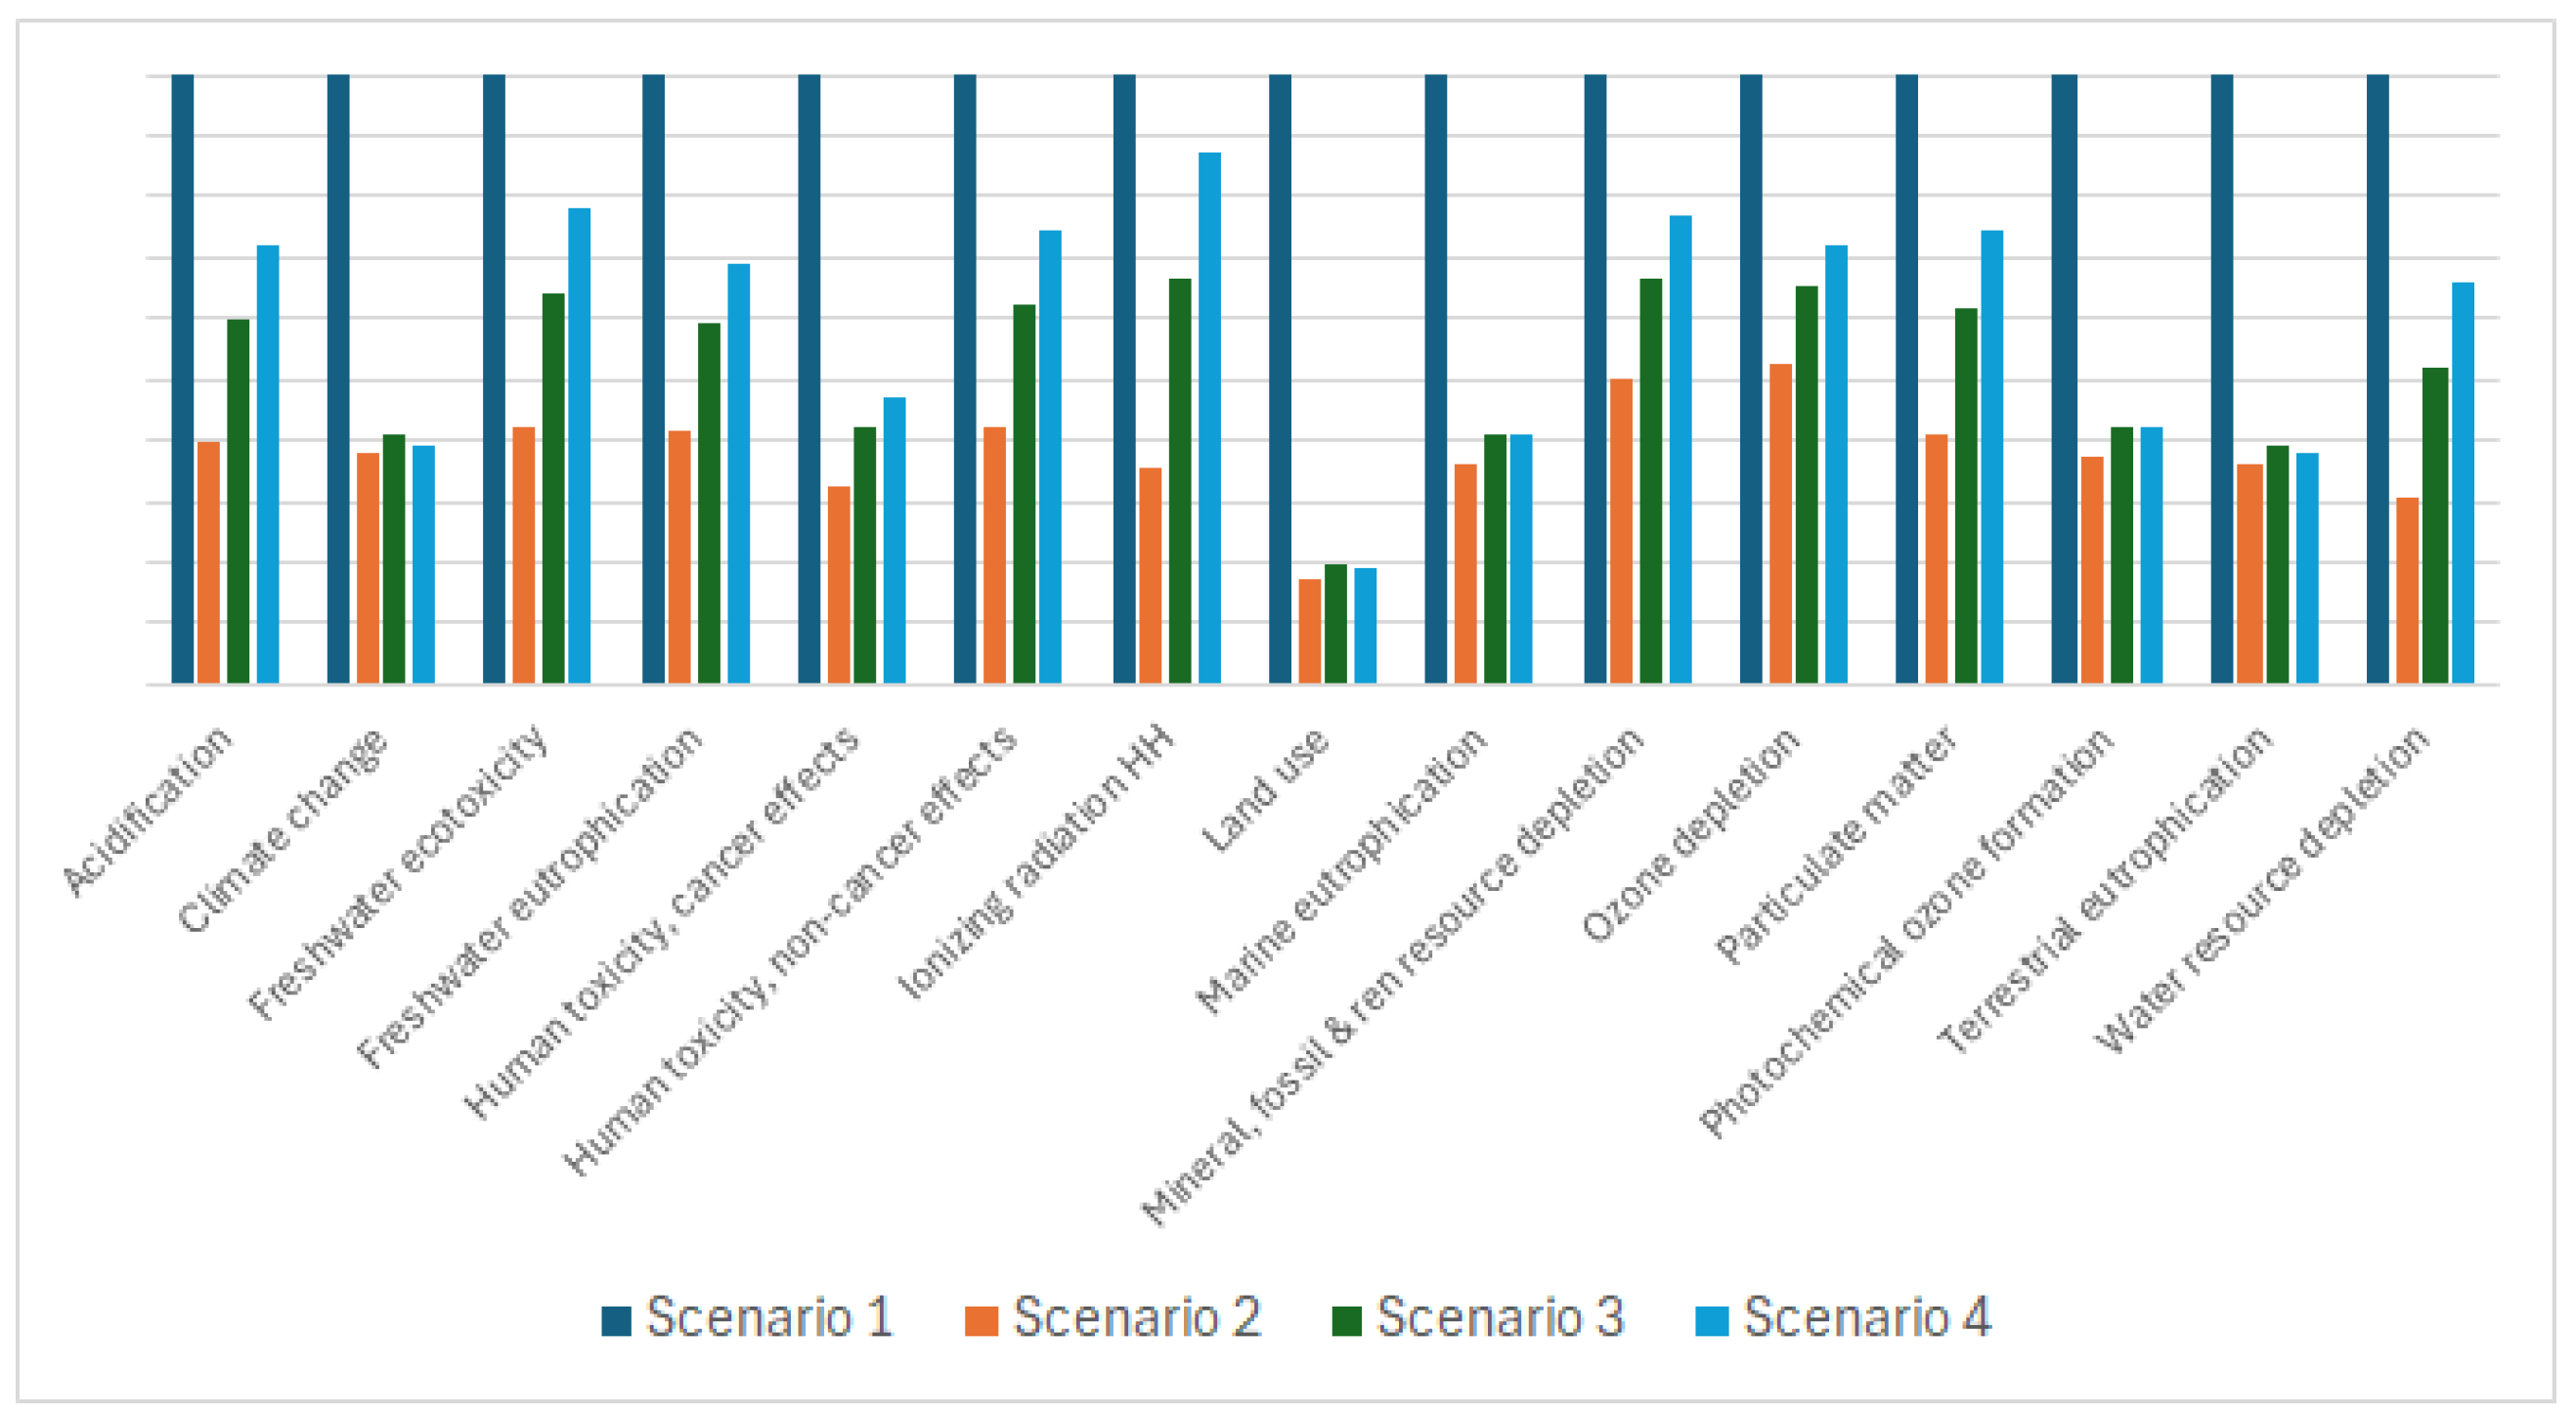
Table 5, when impacts are assessed per MPa of compression strength, the UHPC scenarios showed a much lower environmental impact than scenario 1. This can be seen in
Figure 2, which shows the impact ratio for scenarios 2 to 4 compared to scenario 1, considering impacts per MPa of compression strength. Differently from what is shown in
Figure 1, in this case, all impact categories have lower impacts in scenarios 2 to 4 than in scenario 1.
Actually, scenario 2, which considered UHPC without GO, resulted in equal or lower environmental impacts than scenarios 1, 3, and 4 in all impact categories. Scenarios 3 and 4 also had lower impacts than scenario 1 for all of the impact categories. Still, they also had higher values than scenario 2 for all impact categories. Notably, scenario 4, with a higher content of GO, resulted in a higher environmental burden than scenario 2 due to a higher increase in impacts through the addition of GO compared to the increase in strength (from 160 MPa to 180 MPa). Especially in terms of resource demand, the addition of GO in UHPC resulted in a high impact in resources depletion and water scarcity, as presented in
Figure 2. This indicates that GO has the potential to contribute to the reduction in impacts for different categories as it enables an increase in concrete strength for UHPC, but the enhancement of the GO manufacturing process would be required mainly in terms of resources demanded for the production. Since the LCI data for GO production were based on small-scale laboratory tests, the scalability of GO manufacturing process could be supportive to reduce environmental impacts by considering commercial production of this material. However, the degree to which this contributes should be further investigated.
It is important to highlight that this study did not consider the effect of GO in the durability of concrete, which can also be another aspect that can contribute to lowering the impacts of UHPC, provided that it is expected that GO will enable increased concrete durability and, therefore, service life. For this reason, it is highly recommended to include durability studies in further studies in order to better compare the benefits of adding GO in UHPC.
On the one hand, a reduction in concrete demand for UHPC is expected compared to conventional concrete due to the increase in compression strength. On the other hand, the reduction in concrete demand would not necessarily be proportional to the increase in compression strength, as design codes and standards typically impose limitations in the design of concrete elements, which can undermine the benefit of the increased strength, mainly for the scenario with the higher strength values (scenario 4). Minimum cover, sectional dimension limits, and minimum reinforcement rates are just some examples of typical requirements defined in codes for reinforced concrete design that can limit the reduction in concrete demand when using UHPC. So, in order to better determine the real benefit of UHPC with GO, it is recommended that further research considering a specific structural design case in which the functional unit adopted will be impacts per unit of structural capacity. Anyways, the use of UHPC with GO is not only a solution for enhancing the mechanical properties of concrete, but also has the potential to contribute to more sustainable construction. This analysis should be conducted case by case, considering not only the concrete mixes but also the implications of those choices in structural design and the final project.
3.2. Sensitivity Analysis Results
Concerning the sensitivity analysis, the results of the Monte Carlo simulation resulted in the following variability, presented in
Table 6. For most of the impact categories, sensitivity analysis resulted in a relative standard deviation below 20%. Notably, for climate change and acidification, the values were below 10%, indicating the reliability of the aforementioned discussion in which these categories were mentioned.
However, eutrophication, land use, human toxicity, and resource depletion impact categories have a relative standard deviation in the range of 20% to 50%, which indicates a significant degree in variability. In particular, for ionizing radiation, relative standard deviation was higher than 120%, for all scenarios, which means that the range of variation of values exceeded the average value of impact, indicating a high uncertainty in the results, which means that the results for this impact category must not be used as hotspot for comparison due to the high degree of variation. So, this indicates the need for further studies better addressing the sensitivity of results not only in terms of background processes, but also considering other aspects like energy sources, electricity mixes, cement types, and GO production processes.


