Abstract
Unpredictable climate patterns and mounting groundwater depletion are major challenges to sustainable agriculture. The purpose of this research is to improve predictive accuracy in IoT-based smart irrigation systems using machine learning models for soil fertility estimation and water optimization. In contrast to existing research, this paper compares state-of-the-art ensemble learning models (LRBoost, LR+RF) with conventional methods to ascertain their real-time effectiveness in water usage prediction. Training and testing data were derived from open access agricultural data repositories, including soil moisture, temperature, humidity, and rainfall. Feature selection was performed through correlation analysis and model performance was evaluated using R2 score, mean squared error (MSE), and root mean squared error (RMSE). Our results indicate that the hybrid ensemble model LR+RF performed better than others with an R2 measure of 96.34%, an MSE of 0.0016, and an RMSE of 0.040. The findings confirm the capability of the system in minimizing water wastage and maximizing crop production.
1. Related Works
Agriculture in India heavily depends on groundwater for irrigation. Food security has been threatened; Earth.org and UN News have highlighted the severe depletion of groundwater in regions like Punjab in their reports. An IoT-based smart irrigation system provides an innovative solution to such challenges by using real-time data and predictive algorithms to minimize water usage. This paper describes the development, implementation, and evaluation of the system, highlighting how it reduces water consumption and its advantages, improving crop yields, and minimizing operational costs. For sustainable development, we must use water efficiently as it is a finite resource. Globally, the agricultural sector is responsible for most water usage, and any inefficiency leads to wastage and major environmental issues. Smart irrigation systems can modernize traditional farming methods along with providing benefits for the environment and economy by integrating IoT technology with advanced data analysis. Soil moisture sensors, temperature and humidity sensors, rain sensors, and other weather data collection sensors are used to collect the data so the system will provide the water when needed. Arduino or Raspberry Pi-like microcontrollers are used to process the data from sensors and control the irrigation valves based on parameters. We have used different machine learning models like SVM, Linear Regression, Decision Tree, Random Forest, Boosting, Bagging, and two hybrid ensemble models—LRBoost (Linear Regression and Boosting) and LR+ RF (Linear Regression and Random Forest)—to predict water usage. Morchid, A. et al. [1] proposed one model able to predict how much water is needed on their land using IoT sensors. They developed an intelligent irrigation system using machine learning and IoT sensors. Muthuramalingam, R. et al. [2] discussed a smart irrigation system using IoT systems. They developed a software system using Arduino IDE 1.8.19 and its components, like NodeMCU, a robot, and a controller. They designed the program in such a way that data were collected from several sources through sensory devices and processed. Et-taibi, B. et al. [3] developed a model which allowed the collection of data from different sources which were then sent to the cloud environment that optimizes the water. They proposed a model that allows the centralization of the data for smart farming. Once the data were collected, they were then used to predict the weather in a real-time environment. Aakunuri, M. [4] developed a system for smart farming using NodeMCU ESP8266. The author deployed different sensors to monitor the soil parameters. The proposed system collects the data and provides notifications and email alerts to the farmers. The system is controlled through remote as well as mobile applications. Hema, R. et al. [5] developed model-based IoT sensors that allow monitoring of the water, which was referred to as a smart irrigation system. This helps the farmer to stop the wasting of water. The authors used WSN for handling the real-time data. The proposed model allows the control of parameters like soil moisture, water level, ambient light, etc. The proposed system was developed using hardware components like an Arduino UNO microcontroller, ESP-8266 Wi-Fi, etc. Ismaili, S. et al. [6] discuss a smart irrigation system using Total Dissolved Solids, pH levels, and soil moisture. The collected data from different sources are preprocessed through machine learning classifiers as well as IoT sensors like Arduino Uno R4 Wi-Fi. For smooth data transmission, they used Arduino Cloud, which helps the farmer to handle the real-time data. The results emphasize the importance of putting smart agriculture technology into practice to successfully handle the difficulties encountered in contemporary farming, with a particular focus on the role that data analysis and real-time monitoring play in improving agricultural efficiency. Peter, M. J. et al. [7] implemented the collected data from different sources for a smart irrigation system. Their focus was to integrate the collected data using sensors. The experiment showed that it not only conserves the water but also maintains crop productivity. It is primarily used for precision agriculture purposes as well as cloud computing to optimize water usage. It also discusses how crop yield can be optimized. The originality of this research is in the comparative assessment of hybrid ensemble models (LRBoost and LR+RF) for predictive performance in IoT-based smart irrigation systems. Although existing research has employed conventional machine learning models (e.g., decision tree, random forest, and SVM) for smart irrigation, this study is novel in that it introduces the following:
Hybrid Ensemble Models: Contrary to earlier studies, we adopt LRBoost (Linear Regression + Boosting) and LR+RF (Linear Regression + Random Forest), which take advantage of the capabilities of both regression-based and tree-based models to improve predictive performance.
Feature Importance-Based Optimization: Optimizing model performance using feature importance analysis by emphasizing important features (soil moisture, soil temperature, and air temperature) and minimizing computational overhead by eliminating low-impact variables.
Scenario-Based Flexibility: Our product is tested under arid, semi-arid, and humid environments to assure flexibility in diverse climates.
Comprehensive Performance Metrics: Contrary to earlier research that was based on one evaluation metric, we compare models based on R2 score, MSE, and RMSE, demonstrating that hybrid models significantly enhance accuracy.
Real-Time IoT Integration: The system incorporates real-time sensor data along with past weather data, which is an improvement compared to static irrigation scheduling systems.
2. Material/Methods
In this section, we propose a model for a smart irrigation system and the detailed components are presented below:
The workflow involves the following steps:
- Sensor data collection:
The data for this work were obtained from Kaggle’s agricultural repositories and comprised about 50,000 data points gathered over 24 months. The data included soil moisture, temperature, humidity, rainfall, pH levels, and types of crops. The data were split in a ratio of 80% training data and 20% testing data to allow for balanced assessment.
- 2.
- Data processing and feature extraction:
The system gathers real-time sensor readings and combines them with past environmental data. A preprocessing pipeline standardizes the data, eliminates outliers, and applies feature selection methods to provide the best data quality prior to feeding it into the machine learning models.
- 3.
- Machine learning-based prediction of water needs:
The models were chosen for their capacity to deal with non-linear relationships in farm data. Support Vector Machine (SVM) offers high accuracy for intricate patterns, Random Forest is overfitting-resistant, and hybrid models such as LRBoost (Linear Regression + Boosting) and LR+RF (Linear Regression + Random Forest) take advantage of the strengths of both regression- and tree-based approaches for better predictive accuracy.
Figure 1 below represents the flowchart for a smart irrigation system using sensors and a microcontroller. It shows the efficient workflow of water management by controlling the soil conditions and controlling a water pump.

Figure 1.
Smart irrigation model.
2.1. Flowchart Involves the Following Steps:
- Start;
- Initialize sensors and microcontrollers;
- Read sensor data;
- Check soil moisture level;
- Activate water pump;
- Deactivate the water pump;
- Send data to cloud;
- Repeat the process.
Figure 2 below represents the flowchart for the smart irrigation system using sensors and a microcontroller. It shows the efficient workflow of water management by controlling the soil conditions and the water pump.
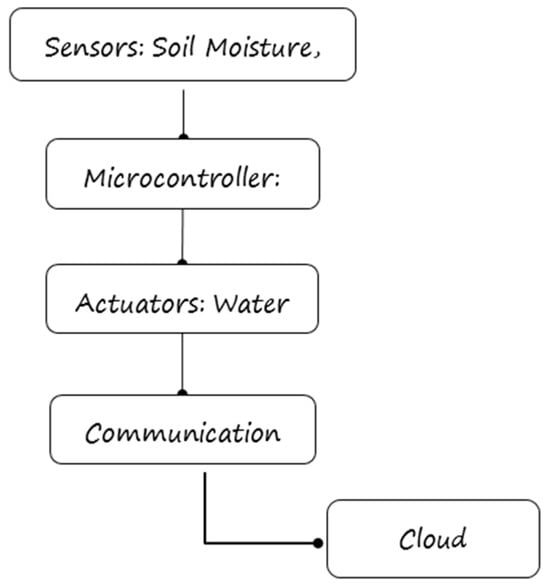
Figure 2.
Schematic diagram for smart irrigation using sensors and microcontroller.
2.2. Flowchart Involves the Following Steps:
- Start.
- Initialize sensors and microcontrollers: the system begins by activating soil moisture, temperature, humidity, and weather sensors.
- Read sensor data: The sensors continuously collect real-time environmental parameters and send the data to the microcontroller.
- Check soil moisture level: The system compares soil moisture levels with predefined thresholds to determine whether irrigation is required.
- Activate water pump: If the soil moisture level is below the threshold, the water pump activates to irrigate the field.
- Deactivate the water pump: If moisture is sufficient, the pump remains off, preventing over-irrigation.
- Send data to cloud: Sensor data are stored and analyzed in the cloud.
Figure 3 below depicts the data flow of this research paper. In this, the data are collected using IoT sensors and external data sources, which are processed through a data ingestion module. Then, the data are fed to our predictive model; the stored data are used in scenario analysis to simulate the environmental conditions and provide actionable insights; and our users can interact with it by using an interactive UI where it can predict and visualize the insights.

Figure 3.
Proposed model for smart irrigation.
Key Components in the Proposed Model:
- IoT Sensors: Collect real-time environmental data like soil moisture, temperature, and humidity.
- External Data Sources: Provide historical and additional environmental data inputs.
- Data Ingestion: Aggregates data from IoT sensors and external sources for further processing.
- Data Preprocessing: Cleans and prepares the data for modeling and analysis.
- Historical Environmental Data: Stores past environmental data for predictive modeling and scenario analysis.
- Processed Data: Refined data that are ready for predictive modeling.
- Prediction Model: Predicts water requirements for irrigation.
- Prediction Results: Outputs the predicted results.
- Scenario Analysis: Simulates different environmental conditions to provide insights.
- Visualization and Reporting: Presents processed data and insights in an understandable format.
- User Management: Controls users’ access and permission.
- User Data and Settings: Stores users’ preferences and historical interactions.
Figure 4 below represents the use case diagram. It outlines the interaction between farmers and users. Users can input key environmental data like soil moisture, soil temperature, soil pH, humidity, temperature, crop type, and rainfall into the system and obtain the generated prediction from the system.
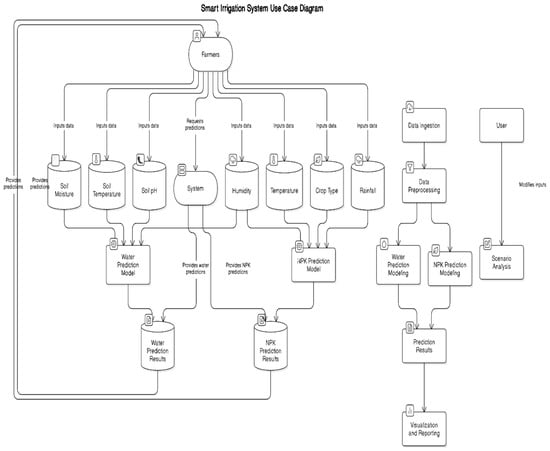
Figure 4.
Use case diagram for smart irrigation system.
Key Components in the Use Case Diagram:
Actors:
- Farmers: Input crop type and soil conditions, receive water usage recommendations.
- Data Inputs:
- Soil moisture;
- Soil temperature;
- Soil pH;
- Humidity;
- Temperature;
- Crop type;
- Rainfall.
System Workflow:
Farmers provide initial crop data (e.g., soil type, crop type, historical water usage).
IoT sensors collect environmental data.
The machine learning system analyzes historical and real-time inputs to recommend optimal irrigation levels.
Farmers receive alerts and real-time insights on the dashboard, enabling smart decision-making.
- Data Integration: Processing real-time sensor data and external climatic data were challenging because of inconsistencies. A data ingestion framework based on preprocessing pipelines enhanced accuracy. These were addressed through preprocessing methods like data normalization, removal of outliers, and time-series interpolation for missing values.
- Computational Load: Execution of hybrid models needed a high-processing GPU for real-time prediction. The model takes at least 16 GB of RAM and an architecture with GPU support for faster real-time prediction. Training consumes around 2 h on an ordinary CPU and around a second or less for predictions.
2.3. Machine Learning Models
To give plants water when they need it, the system uses soil moisture, temperature, humidity, rain, and other weather sensors to gather data. Microcontrollers like Arduino or Raspberry Pi take that data and use it to control the water valves. We used different machine learning models like SVM, LR.DT, RF, BOOSTING, and BAGGING, and two mixed models (LINEAR REGRESSION AND BOOSTING and LINEAR REGRESSION AND RANDOM FOREST) to guess how much water to use. These models are good at spotting tricky patterns in farm data. Support Vector Machine (SVM) is very accurate, Random Forest does not become confused by too much data, and the mixed models, LRBoost and LR+RF, combine the best parts of simple and complex methods for better guesses.
To evaluate performance under varying conditions, we tested the model in simulated humid, dry, and moderately dry weather. The adaptive models adjusted water usage based on these conditions, which proved more effective than applying a fixed watering amount.
We kept the errors (MSE, RMSE) low by taking the following precautions:
- Ensuring the data was balanced and unbiased.
- Applying ensembles of methods to reduce confusion.
- Continuously validating and refining the model.
We fixed issues where the model became too obsessed with the training data by cross-checking, and we avoided the opposite issue (not learning enough) by picking the right features, adding more data, and tweaking the model’s settings.
Regular watering usually follows a schedule or someone’s gut feeling, which wastes water by over- or under-watering. These old methods do not pay attention to how wet the soil is, what the weather is like, or what the crops actually need, so they are not great for the environment.
However, machine learning systems use sensors to watch the soil, air, and rain in real time and then guess how much water is really needed. Models like Random Forest, SVM, and the mixed models (LRBoost and LR+RF) can change the watering schedule to cut down on waste.
For example, normal watering might soak a field every day no matter what, but a smart system will only water when things are dry, making the most of every drop. Our mixed models were very good at guessing correctly (96.34% R2) and did not make large mistakes (mean squared error of 0.0016), showing they water far better than old-fashioned methods.
As such, ML-based watering is significant. It is precise, flexible, and efficient, leading to bigger harvests and less water waste. Soil moisture sensors, temperature and humidity sensors, rain sensors, and other weather data collection sensors are used to collect the data so the system will provide the water when needed. Arduino or Raspberry Pi-like microcontrollers are used to process the data from sensors and control the irrigation valves based on parameters. We have used different machine learning models like SVM, LR.DT, RF, BOOSTING, and BAGGING, and two hybrid ensemble models, LINEAR REGRESSION AND BOOSTING and LINEAR REGRESSION AND RANDOM FOREST, to predict the water usage. The models were chosen for their capacity to deal with non-linear relationships in farm data. Support Vector Machine (SVM) offers high accuracy for intricate patterns, Random Forest is overfitting-resistant, and hybrid models such as LRBoost (Linear Regression + Boosting) and LR+RF (Linear Regression + Random Forest) take advantage of the strengths of both regression and tree-based approaches for better predictive accuracy.
To assess adaptability in various climates, the model was tested in simulated conditions for humid, arid, and semi-arid climates. Findings show that hybrid models dynamically adjusted irrigation requirements, performing better than static rule-based systems.
- Prediction errors (MSE, RMSE) were minimized using the following precautions:
- Feature normalization to minimize bias.
- Ensemble techniques mitigating overfitting.
- Real-time feedback loops providing model improvement.
Overfitting was resolved via cross-validation, regularization, and ensemble approaches such as Bagging and Boosting. Underfitting was avoided with feature selection, data augmentation, and hyperparameter optimization for providing an optimized and well-balanced mode.
2.4. Model Performance
Extensive testing was conducted to evaluate model performance using measures such as accuracy, mean squared error (MSE), and root mean squared error (RMSE). The following observations were made:
From the above Table 1, we compared the R2 score, MSE, and RMSE of the various models employed in this research. The R2 score indicates how well the model fits the variance in the data (greater is better), while MSE measures the average squared error between actual and predicted values (smaller is better). RMSE, the square root of MSE, gives a more understandable measure of prediction error; we found that most models have an R2 score of more than 92%. Out of all the models that we have employed, the ensemble Linear Regression and Random Forest model performed better than the rest by achieving an accuracy of 96.34%, an MSE score of 0.0016, and an RMSE score of 0.040.

Table 1.
Performance of ML Models.
The Decision Tree model overfits, so it is not reliable for high-variability agricultural data. It was less predictive of performance than ensemble models, as noted by its lower R2 score of 92.74%. Overfitting occurs because DT models capture noise in the training data, making them less reliable for real-world agricultural conditions with high variability.
Hybrid ensemble models minimize bias and variance through the integration of multiple learning methods. LRBoost combines linear regression with boosting to detect both linear and non-linear patterns. It effectively captures both linear and non-linear relationships by combining Linear Regression with Boosting., and LR+RF is aided by Random Forest’s feature selection and generalization. These models always had higher R2 values, reflecting better predictive capability compared to single models. LR+RF achieved the best performance, with a 96.34% R2 score, 0.0016 MSE, and 0.0404 RMSE, because it leverages Random Forest’s ability to select important features while maintaining interpretability through Linear Regression.
2.5. Visual Results
Graphs comparing predicted water usage against actual requirements validate the model’s accuracy. These results underscore the system’s ability to make real-time adjustments, ensuring optimal water utilization.
The Figure 5 shows the accuracy of the ensemble model (Linear Regression + RF) used in our paper. It compares the predicted water usage (y-axis) against the actual water usage (x-axis). The clustering of points around the red line indicates that the model performs well, with minimal error. This shows that our model has high accuracy.

Figure 5.
Ensemble model prediction accuracy.
Figure 6 represents the important features of our model. The most significant features used for prediction were soil moisture, soil temperature, air temperature, solar radiation, humidity, wind speed, pH, and crop type. The most prominent features obtained with feature importance analysis were as follows:

Figure 6.
Feature importance.
Soil moisture (highest, 45%);
Soil temperature and air temperature (moderate effect, 25–30%);
Solar radiation and humidity (low influence, 10–15%);
Wind speed, pH, and crop type (minimal influence, 5% or lower).
Low-impact attributes like pH and crop type were omitted from certain models to improve computational speed and minimize overfitting. The most pertinent attributes (temperature, humidity, and soil moisture) were kept to optimize prediction accuracy.
Figure 7 discusses the performance of all the machine learning models using three metrics: R2 score (blue bars), mean squared error (MSE, orange bars), and root mean squared error (RMSE, green bars). It is a graphical representation of our observation table in the Results Section.
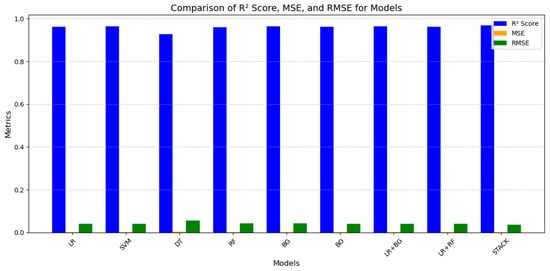
Figure 7.
Comparison of performance metrics of different models.
Figure 8 below discusses the R2 comparisons of the different models. It presents the percentage of variations in the models. The suggested best models are LR+RF, BG, and SVM because their R2 values are good for predicting accuracy. Similarly, we observed that DT obtained less R2 in comparison to the other models.
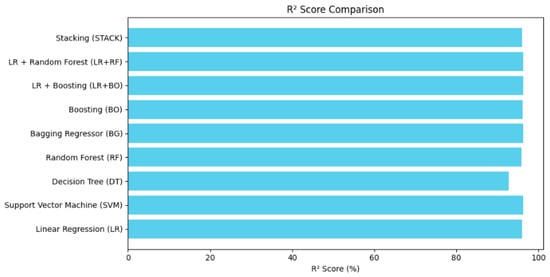
Figure 8.
R2 comparison of different models.
Figure 9 below presents the MSE comparison among all the models. It presents how far the predicted values deviate from the different models’ actual values. From our experimental work, we observed that the model SVM obtained the lowest MSE, i.e., SVM’s predicted score was close to the actual values. Similarly, DT had the highest MSE, representing a higher prediction error.

Figure 9.
MSE comparison of the different models.
Figure 10 represents the RMSE of the different models. It can be observed that the model stacking regressor obtained the lowest RMSE, i.e., it perfectly maintained the balance between the predictive accuracy and error minimization. Similarly, DT had the highest RMSE. Ensemble models give good results. STACK provides a good balanced model when accuracy and error are considered together.
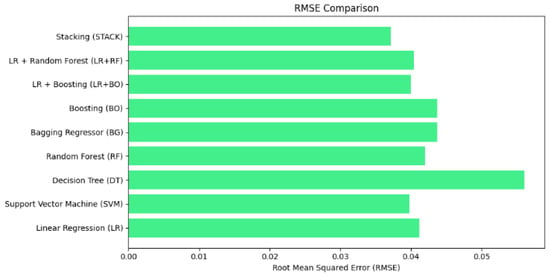
Figure 10.
RMSE comparison of different models.
Best Model:
| Model | Support Vector Machine (SVM) |
| R2 Score | 96.3484 |
| MSE | 0.0015 |
| RMSE | 0.0398 |
From the above representation, we conclude that the model SVM gives the best R2 of 96.34. From the above figures, it can be seen that the best model is the stacking regressor that provides a balanced R2 and low MSE and RMSE. The traditional models like linear regression and SVM perform well in general. When compared to the advanced model, it shows a lower performance. Figure 11 depicts the detailed parameters that are used for smart farming. The DT model performs the poorest across all kinds of metrics, and hence it is the weakest model for smart irrigation systems. Ensemble models, particularly stacking, emphasize the benefit of integrating diverse methodologies to achieve superior forecasts in an IoT-based smart irrigation system for soil fertility evaluation.
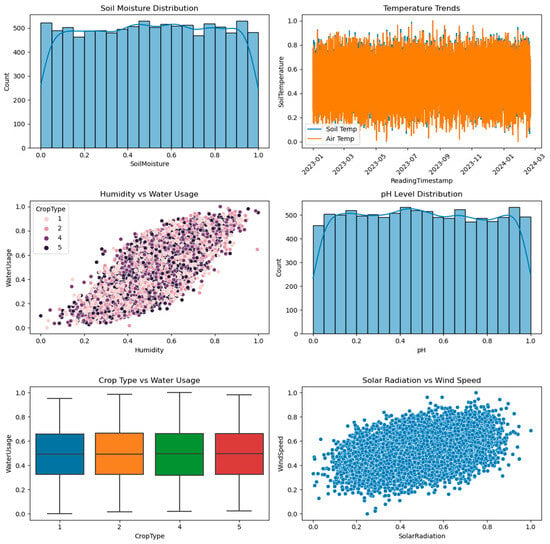
Figure 11.
Detailed visualization of irrigation parameters.
3. Discussion
The IoT-based smart irrigation system is a modern approach to water management in agriculture. For adaptive and accurate irrigation strategies, reduced resource wastage, and enhanced crop yields, the integration of IoT and machine learning seems to be the best approach. From small farms to large-scale plantations, the system’s scalability ensures that it applies to various agricultural environments.
Challenges include the initial setup cost, reliance on consistent internet connectivity, and potential sensor malfunctions. Adoption rates can be further improved by addressing the above-mentioned challenges through cost-effective components and robust system design.
Future enhancements may include the following:
- Integration of real-time weather data APIs.
- Expansion to support multi-crop environments.
- Enhanced user interfaces for better farmer accessibility.
4. Conclusions
After using different kinds of regression models, we have found that among all the models, the ensemble Linear Regression and Random Forest model outperformed the other models, acquiring an accuracy of 96.34%, an MSE score of 0.0016, and an RMSE score of 0.040. Therefore, we have chosen this model. The system can be modified by adding real-time weather APIs, soil type-based calibration of soil moisture sensors, and region-specific data for more accurate predictions. Multi-crop adaptability will be added in future updates to increase precision.
Author Contributions
Conceptualization, S.P. and N.P.; Methodology, S.P.; Software, S.P.; Validation, N.P. and R.P.; Formal Analysis, D.M.; Investigation, N.P.; Resources, S.M.; Data Curation, N.P.; Writing—Original Draft Preparation, S.P.; Writing—Review and Editing, N.P.; Visualization, S.M.; Supervision, N.P. and R.P.; Project Administration, R.P.; Funding Acquisition, N.P. All authors have read and agreed to the published version of the manuscript.
Funding
This research received no external funding.
Institutional Review Board Statement
Not applicable.
Informed Consent Statement
Not applicable.
Data Availability Statement
The dataset used in this study is publicly available and can be accessed from the Kaggle platform.
Acknowledgments
We would like to thank our mentors and the School of Engineering and Technology, Department of Computer Science and Engineering, Gandhi Institute of Engineering and Technology University (GIETU) faculties for their valuable recommendations, professional guidance, expert advice, and encouragement during the preparation of this paper.
Conflicts of Interest
The authors declare no conflicts of interest.
References
- Morchid, A.; Jebabra, R.; Khalid, H.M.; El Alami, R.; Qjidaa, H.; Jamil, M.O. IoT-based smart irrigation management system to enhance agricultural water security using embedded systems, telemetry data, and cloud computing. Results Eng. 2024, 23, 102829. [Google Scholar] [CrossRef]
- Muthuramalingam, R.; Rathnam Velu, R.; Baskar, H.; Vellan Swaminathan, M.H. An IoT-Based Smart Irrigation System. Eng. Proc. 2024, 66, 13. [Google Scholar]
- Et-taibi, B.; Abid, M.R.; Boufounas, E.M.; Morchid, A.; Bourhnane, S.; Hamed, T.A.; Benhaddou, D. Enhancing water management in smart agriculture: A cloud and IoT-Based smart irrigation system. Results Eng. 2024, 22, 102283. [Google Scholar] [CrossRef]
- Aakunuri, M. Smart Irrigation System using IOT. EAI Endorsed Trans. IoT 2024, 10, 1–7. [Google Scholar] [CrossRef]
- Hema, R.; Subbulakshmi, S.; Jyothi, B.; Gurulakshmi, R.; Vignesh, M.; Queen Mary, M.B. Smart Automated Irrigation through IoT Technology. In Proceedings of the 2024 5th International Conference on Smart Electronics and Communication (ICOSEC), Trichy, India, 18–20 September 2024; pp. 833–838. [Google Scholar] [CrossRef]
- Ismaili, S.; Idrizi, F.; Rustemi, A.; Ibraimi, M.; Idrizi, H. IoT-Based Irrigation System for Smart Agriculture. In Proceedings of the 2024 XXXIII International Scientific Conference Electronics (ET), Sozopol, Bulgaria, 17–19 September 2024; pp. 1–6. [Google Scholar] [CrossRef]
- Peter, M.J.; Kalaiyarasi, R.; Vijayashanthi, V.; TA, M.; Menaga, D.; Suresh, P.M. IoT-based Smart Irrigation System for Precision Agriculture in Greenhouse Environment. In Proceedings of the 2024 5th International Conference on Electronics and Sustainable Communication Systems (ICESC), Coimbatore, India, 7–9 August 2024; pp. 411–416. [Google Scholar] [CrossRef]
Disclaimer/Publisher’s Note: The statements, opinions and data contained in all publications are solely those of the individual author(s) and contributor(s) and not of MDPI and/or the editor(s). MDPI and/or the editor(s) disclaim responsibility for any injury to people or property resulting from any ideas, methods, instructions or products referred to in the content. |
© 2025 by the authors. Licensee MDPI, Basel, Switzerland. This article is an open access article distributed under the terms and conditions of the Creative Commons Attribution (CC BY) license (https://creativecommons.org/licenses/by/4.0/).