Proceeding Paper

Air Quality Health Index and Discomfort Conditions in a Heatwave Episode During July 2024 in Rhodes Island †

by
Ioannis Logothetis
1,2,*,
Adamantios Mitsotakis
1 and
Panagiotis Grammelis
1
1
Centre for Research and Technology Hellas, Chemical Process and Energy Resources Institute, Thermi, 57001 Thessaloniki, Greece
2
Laboratory of Atmospheric Physics, Department of Physics, Aristotle University of Thessaloniki, 54124 Thessaloniki, Greece
*
Author to whom correspondence should be addressed.
Presented at the 5th International Electronic Conference on Applied Sciences, 4–6 December 2024; Available online: https://sciforum.net/event/ASEC2024.
Eng. Proc. 2025, 87(1), 59; https://doi.org/10.3390/engproc2025087059
Published: 29 April 2025
(This article belongs to the Proceedings of The 5th International Electronic Conference on Applied Sciences)

Abstract

Climate conditions in combination with the concentration of pollutants increase the human health stress and exacerbate systemic diseases. The city of Rhodes is a desirable tourist destination that is located in a sensitive climate region of the southeastern Aegean Sea in the Mediterranean region. In this work, hourly recordings from a mobile air quality monitoring system, which is located in an urban area of Rhodes city, are employed in order to measure the concentration of regulated pollutants ( S O 2 , N O 2 , O 3 , P M 10   a n d   P M 2.5 ) and meteorological factors (pressure, temperature, and relative humidity). The air quality health index (AQHI) and the discomfort index (DI) are calculated to study the impact of air quality and meteorological conditions on human health. The analysis is conducted during a hot summer period, from 29 June to 14 July 2024. During the second half of the studied period, a heatwave episode occurred that affected the bioclimatic conditions over the city. The results show that despite the fact that the concentration of pollutants is lower than the pollutant thresholds (according to Directive 2008/50/EC), the AQHI and DI conditions degrade significantly over the heatwave days. In particular, the AQHI is classified in the “Moderate” class, and the DI indicates that most of the population suffers discomfort. The AQHI and DI simultaneously increase during the days of the heat episode, showing a possible negative synergy for the health risk. Finally, both the day maximum and night minimum temperature are increased (about 0.8 and 0.6 °C, respectively) during the heatwave days as compared to the whole studied period.

1. Introduction

An increased concentration of pollutants in the atmosphere degrades the air quality, and they are injurious for human health. Previous studies have shown that air pollution is linked with a high risk of mortality, morbidity, health disorders (such as cardiovascular and respiratory disorders), cancers, cognitive impairment, neurological diseases, etc. [1,2]. The sectors of industry, transport, energy, power generation, urban planning, heating and cooling, as well as urban and agricultural waste management are some of the dominant air pollutant emitters. These emissions align with the climate crisis, negatively affecting ecosystems and increasing the health stress on the population [3,4]. The United Nations Environmental Program (UNEP) said that air pollution and climate change are “two sides of the same coin” that affect human health, well-being, and the environment [3]. Future projections show that weather and climate extremes are increasing both on a regional and global scale due to global warming [5]. The Mediterranean region is one of the most responsive regions to climate change. Model simulations project changes in various climate features and atmospheric circulation parameters such as wind speed, temperature, precipitation, cloudiness, and relative humidity [6,7,8,9]. Focusing on the eastern Mediterranean area, heatwave events tend to occur more frequently and present higher persistence [10]. The combined effects of extreme weather conditions (i.e., high temperatures and dryer conditions) and increased levels of air pollutants negatively affect human health [11].
Rhodes Island is located in the sensitive, with respect to climate change, area of the southeastern Mediterranean region [6,7,12,13]. This area is considered to be a desirable tourist destination because it combines the mild climate of the Mediterranean region with culture and high-quality tourist provisions. The increased tourist density and traffic activity (increased number of vehicles and port activity during the peak tourist period) tend to increase the concentration of pollutants degrading the air quality over the city [13,14,15]. Additionally, atmospheric circulation features, such as the local wind pattern (the Etesians) and African dust episodes, and climate conditions (such as high temperatures and dry conditions during the summer period) affect the variability in the concentration of pollutants over the region of Rhodes Island [12,13,14,15].
The synergic action between air pollution and meteorological factors increases the health risk for the general population [1,2,14,15,16,17]. In this context, there are calculated indices that take into consideration the concentration of pollutants (such as the air quality health index, AQHI) and climate conditions (bioclimatic indices such as the discomfort index, DI), providing information regarding dangers to people’s health that are related to pollutant levels and climate conditions [13,16,17,18].
This work is performed in the context of the “ELEKTRON” project [19], which aims, inter alia, to study the impact of traffic emissions on air quality over the southeastern Aegean Islandic regional-based ecosystems. In general, cities are considered as critical actors in climate crisis, contributing to tackling the air quality degradation [3]. This project focuses on the coastal city of Rhodes. The results of this project indicate that traffic emissions and climate conditions define the level of and variability in pollution in this area [13,14,15]. In particular, traffic (vehicle)-related emissions are associated with degraded air quality in the city center of Rhodes (in terms of the CAQI index, [13]). Additionally, extreme climate conditions (i.e., high temperatures and strengthening Etesian winds) increase the occurrence of dangerous wildfire events, affecting the air pollution over the eastern Mediterranean region (i.e., the wildfire events of southwestern Turkey and Rhodes Island contributed to the poor air quality in Rhodes city during the summer of 2021) [6,13].
The results of the “ELEKTRON” project have provided elements regarding the green transition and sustainable development over the southeastern Aegean area. Green mobility (energy-efficient transportation) equipment was set up in Rhodes city, and a number of subtasks regarding the energy autonomy (involving RES and electro-mobility penetration) were conducted during the project life (for more information, please see the following link, [19]). The follow-up of “ELEKTRON”, the “NHSOS” project, provides a holistic and sustainable vision involving the principles of “GReco Island” [20] and “Clean Energy” for the EU Islands [21]. In this context, the investigation of air quality and climate variability over the islandic regional-based ecosystems of the southeastern Aegean region is considered a priority (following the principles of the National Smart Specialization Strategy—S3 [22,23]).
This work aims to study the impact of air pollution and meteorological conditions on human health during a summer high traffic period when a heatwave event occurred (from 29 June to 14 July 2024). This study is organized as follows: In Section 2, the materials and methods that were used in the analysis are presented. The results and the discussion are presented in Section 3. Finally, in the conclusion (Section 4), the main findings of this work are summed up.

2. Materials and Methods

Hourly recordings of (a) the concentration of pollutants—nitrogen dioxide ( N O 2 ), ozone ( O 3 ), sulfur dioxide ( S O 2 ), and particulate matter with a diameter of less than or equal to 2.5 and 10 μm ( P M 2.5   a n d   P M 10 ) —and (b) the meteorological factors—temperature, relative humidity, and air pressure—are measured at about 3 m above the road in an urban area of Rhodes city (Agios Nikolaos region, Canada Street, Figure 1) [12]. The measurement campaign covers the period from 29 June to 14 July 2024. This analysis is considered as a case study during a summer period in which an extreme temperature episode occurred (over the second half of the studied period). During the days from 7 to 14 July, the temperature and relative humidity increased compared to the previous studied period. During this period (which is considered as a heatwave episode for the analysis), the maximum mean daily temperature increased (about 2.0 °C) compared to the previous period, providing the ability to investigate the air quality and discomfort sense (in terms of the AQHI and DI) under heat conditions. Furthermore, the mean daily temperature during these days was about 31.5 °C (about a 3.5 °C increase compared to the climatological mean temperature of July (from the average over the period from 1955 to 2010) [24].
For this campaign, a calibrated AQ-Mesh mobile air quality monitoring system (AQMS) equipped with air quality and meteorological sensors is employed. In general, the use of air quality monitoring systems (equipped with LCSs) provides a solution to monitor the concentration and variability of pollutants in areas that have not been previously investigated. LCSs have attracted the interest of the scientific community because the new digital technologies increase the efficiency of sensors, in combination with their affordability and mobility. In this context, LCSs can be an alternative for air quality monitoring in regions where there are not any stable, labor-intensive, and expensive air quality systems [25,26,27,28,29,30,31]. In addition, the development of sensor technology involves innovative solutions to the field of air quality monitoring due to their ability to develop networks of LCSs providing high spatiotemporal coverage [31]. Nevertheless, LCSs have lower accuracy and precision in capturing the absolute values of pollutant concentrations compared to stable and authorized labor air quality instruments. In addition, environmental factors, such as temperature and humidity, can reduce the desirable accuracy of LCSs, affecting their response to these (meteorological) conditions [25] due to their possible impact on the electrochemical elements of (electrochemical) sensors such as S O 2 and N O 2 . Furthermore, particle growth due to water absorption can affect the accuracy of measurements in optical PM10 sensors.
In order to investigate the bioclimatic conditions and the impact of air pollution on human health, the discomfort index (DI) and the air quality health index (AQHI) are calculated, respectively. In particular, the DI is calculated in order to study the discomfort sense (in terms of temperature and relative humidity) of the general population [14,15,16,18]. The DI is calculated by the following Equation (1):
D I = T h 0.55 × 1 0.01 R H × T h 14.5
where T h is the mean hourly value of air temperature and R H is the relative humidity.
The AQHI is calculated in order to investigate the health risk of the population that is related to the concentration of the basic pollutants ( N O 2 ,  O 3 , and P M 2.5 ) [14,16]. The AQHI is calculated by Equation (2):
A Q H I = 10 10.4 × 100 × e 0.000871 × N O 2 1 + e 0.000537 × O 3 1 + e 0.000487 × P M 2.5 1
The classes of the DI and AQHI and the related messages for the population are presented in Table 1 and Table 2, respectively.
The AQHI is a health index that is related to the concentrations of P M 2.5 , N O 2 , and O 3 . One of the limitations of this study, which is related to the AQHI, is the fact that the concentration of S O 2 is affected by shipping traffic. Generally, shipping traffic is increased during the summer months due to high tourist activity in Rhodes Island. The port of Rhodes is located about 1 Km north of the studied area. The distance of the studied area from the port, in combination with the low concentrations of SO2 (recordings from the mobile monitoring system), possibly shows that the AQHI can provide a reliable measure for the impact of air quality on human health for this air quality campaign. The AQHI and DI provide general messages for the general population. Sensitive groups show different responses to pollutant exposure [32]. Moreover, the DI provides important messages regarding humans’ feelings, but it is unable to reproduce exactly the living environment conditions that are related to people’s sense of discomfort [33]. Despite the limitations of the AQHI and DI, they reflect the impact of air pollution and discomfort conditions on the health of the general population [16,18].
The mean daily and mean diurnal concentration of pollutants ( N O 2 , S O 2 , O 3 ,   P M 2.5   a n d   P M 10 ) , the ratio of P M 2.5 to P M 10 ( P M 2.5 P M 10 ) , and the indices (DI and AQHI) are calculated in order to investigate the mean daily and hourly variability of these pollutants and indices. Note that the limits that are set by the air pollution Directive are based on observed health impacts that are associated with various pollutants. The thresholds provide alert and information values of pollutant concentrations in order to protect human health (2008/50/EC). In general, the P M 2.5 P M 10 ratio is indicative of the anthropogenic activities, and it is increased during degraded air quality conditions. Additionally, the correlation coefficients (Pearson correlation) among the concentrations of pollutants, indices, and meteorological factors are calculated in order to study the possible relations among these factors [12,13,14,15]. The box-plot of day maximum and night minimum hourly temperatures as well as the day maximum and night minimum temperature mean anomalies (with reference to the period day maximum and night minimum temperatures, respectively) are calculated to investigate the differences between the temperature hourly profiles during the heatwave event (as compared to the whole studied period). These analyses are also taken under consideration in order to discuss the synergy of air quality degradation and climate conditions to human health risk over the urban area of Rhodes city. Finally, for the calculated differences, the statistical significance was estimated using the two-tailed t-test at a 95% statistical significance level.

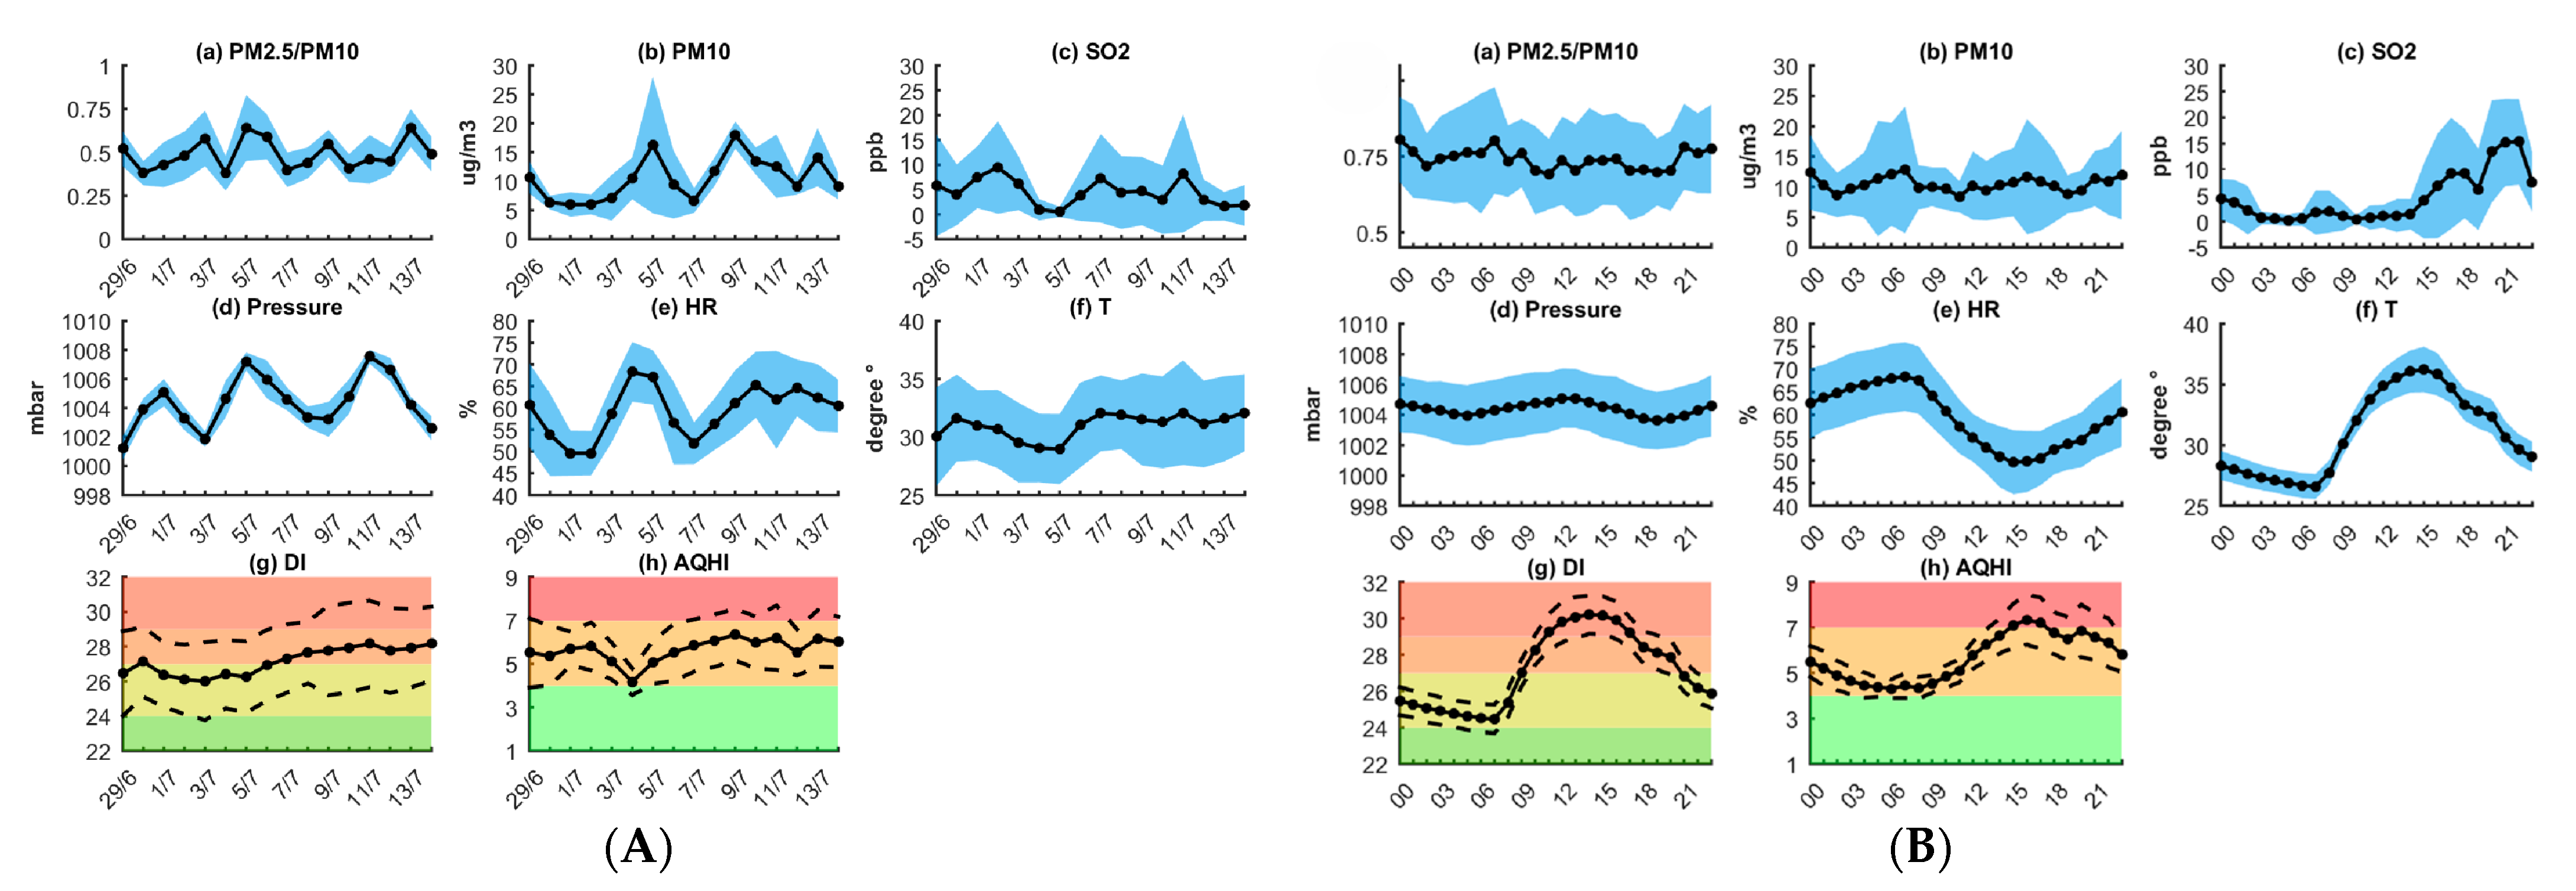
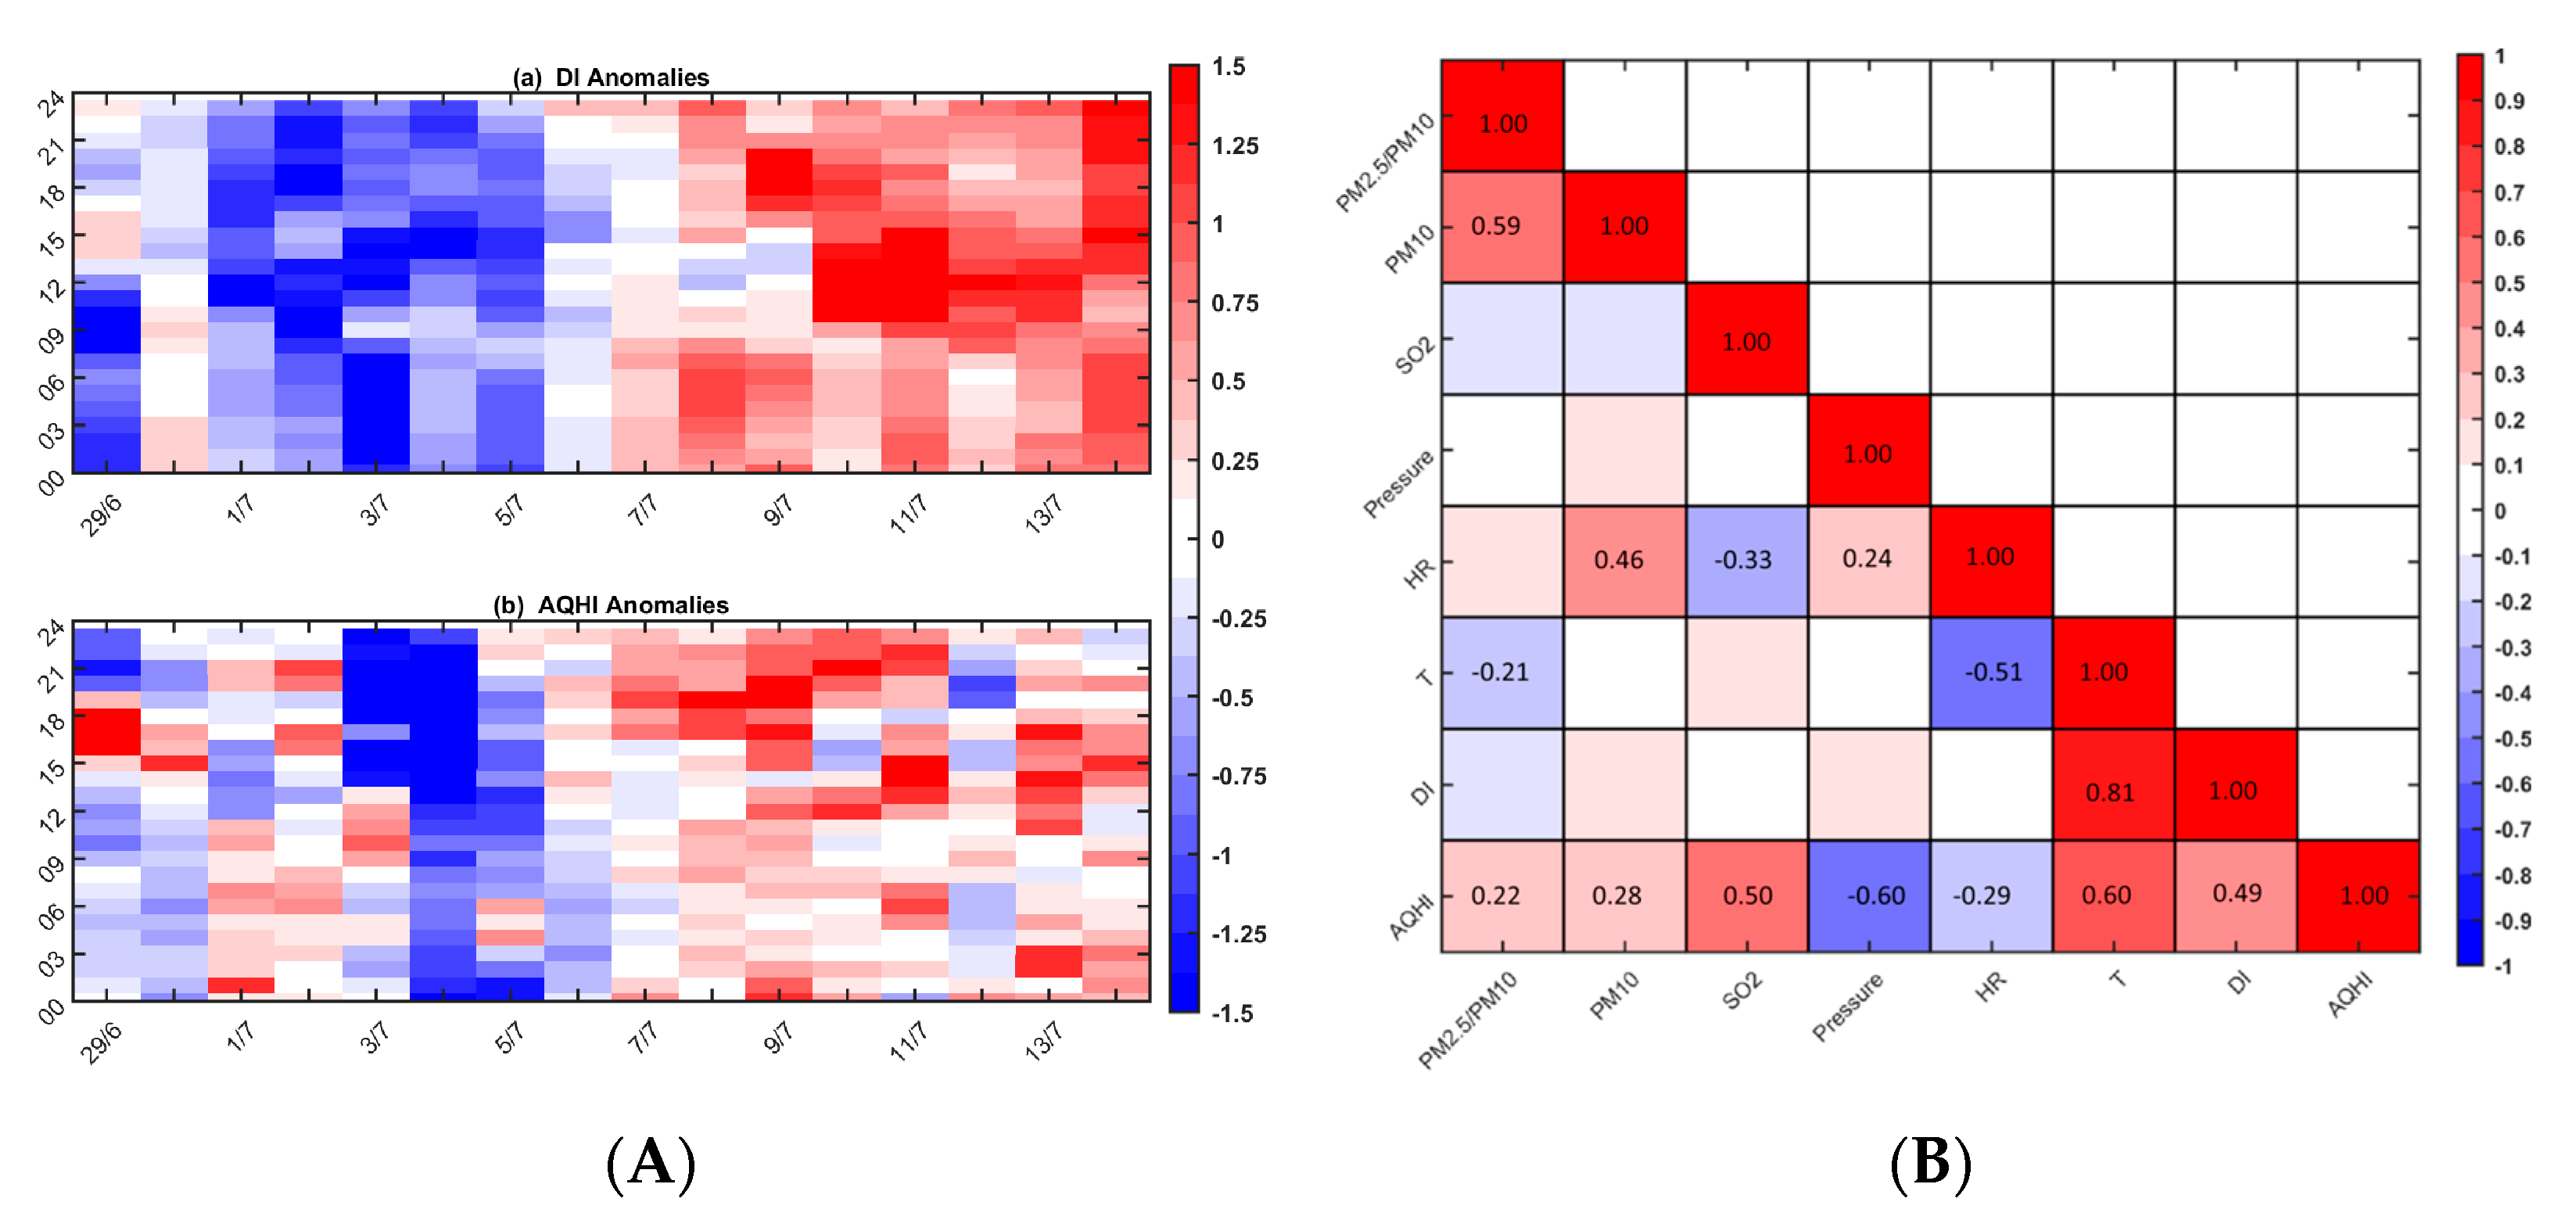
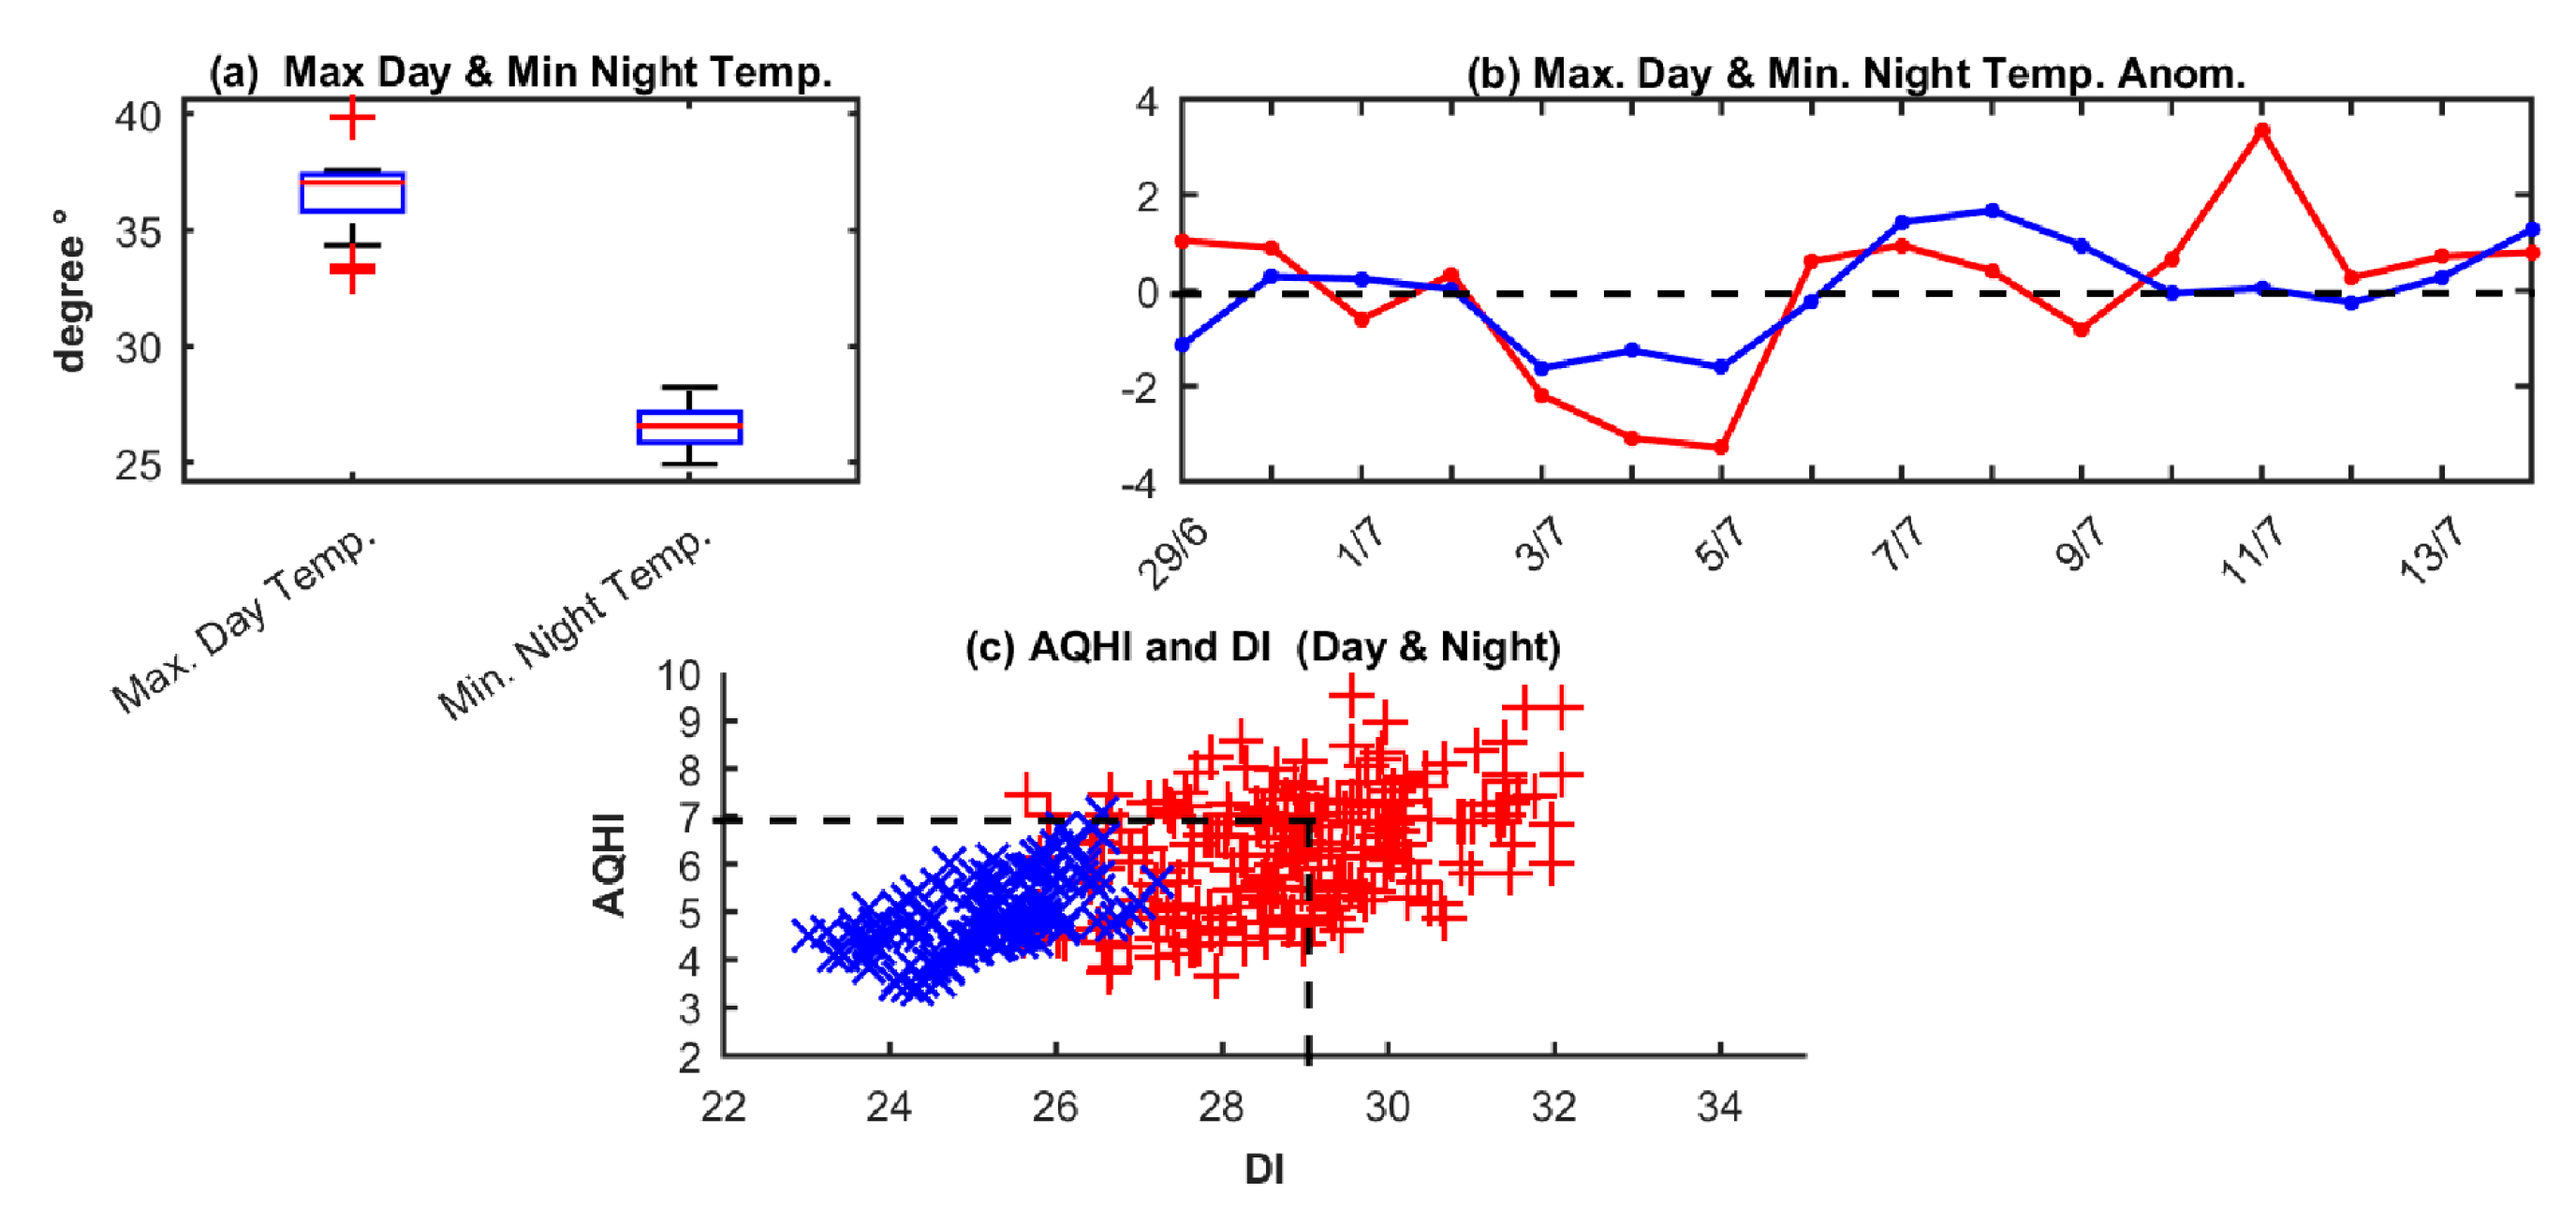
3. Results and Discussion

Figure 2A shows that mean daily recordings of pollutant concentrations present values that are lower than the pollution thresholds according to the EU air quality Directive. Generally, the P M 2.5 P M 10 ratio ranges between 0.4 and 0.7. The concentration of P M 10 increases on 5 July compared to the other days. In addition, a secondary increase is shown on 9 July (Figure 2A(b)). The concentration of S O 2 measured in the area under investigation, during the study period, does not cause any danger to the average population according to the limits set by the EU Directive on air quality. The low mean daily concentrations of S O 2 show that the AQHI can be considered as an indicative index regarding the impact of air pollution on human health during the period that this analysis is focused on. The mean temperature from 7 to 14 July 2024 shows increased values compared to the period from 29 June to 6 July 2024 (Figure 2A(f)). These meteorological conditions affect the feeling of human senses, increasing discomfort conditions for the general population (the DI increases; Figure 2A(g)). Additionally, the AQHI during the second half of the study period is elevated compared to the period from 29 June to 6 July (Figure 2A(h)). Note that there is not one pollutant (among   P M 2.5 , N O 2 , and O 3 ) that more significantly affects the estimations of the AQHI. These conditions negatively affect the high health risk that is related to the concentration of pollution, and the AQHI values indicate that most of the population suffers discomfort. The synergy of these elements degrades the conditions for humans in the city.
The mean diurnal variability shows insignificant changes for P M 2.5 P M 10 and P M 10 during the mean diurnal cycle but shows higher standard deviations during the morning (after the sun rise, about 5:00 to 8:00) and after the midday hours (about 15:00 to 18:00), possibly due to the maximized human activities (such as vehicle traffic and population density in the area) during these day hours (Figure 2B(a,b)). The concentration of S O 2 shows an increase after 15:00 until the midnight hours (Figure 2B(c)). The most degraded conditions in terms of the DI and AQHI are presented during the midday hours (from 13:00 to 18:00; Figure 2B(g,h)). In particular, the DI is maximized from 11:00–17:00 (DI ≥ 29) and the AQHI from 14:00–16:00 (AQHI ≥ 7). The indices show that during the warmest hours of the day, the health risk and discomfort sense for the general population increase and degrade, respectively. Previous studies have already shown that the diurnal variability in the concentration of pollutants is affected by meteorological factors such as wind speed, precipitation, the height of the boundary layer, etc. [13,17,34,35,36,37,38,39]. Lou et al. [34] have already shown that there is an inverted U-shape and V-shape relationship between relative humidity (peaking at 45–70%) and P M 2.5 concentrations, along with P M 10 , S O 2 , and N O 2 , respectively. Zender-Świercz [35] have shown that relative humidity (when it is lower than 70%) is positively related to P M 2.5 . Additionally, P M 2.5 is positively (weakly) correlated with temperature. In combination with the meteorological factors, topography and traffic are also factors that significantly affect the air quality [35]. The boundary layer height and wind speed are reduced during the night hours. The reduction in the boundary layer height and wind speed during the night hours seem to be factors that would tend to increase pollutant concentrations (instead, there is a low at night). Thus, emissions during the day are probably the most important factor for local air quality. Additionally, the pollutant emissions mainly are increased during the day hours. These elements may explain the worst health conditions (in terms of the AQHI) during the day compared to at night (Figure 2B(g,h)).
Figure 3A shows the hourly DI and AQHI anomalies (with reference to the whole period mean diurnal cycle of the DI and AQHI). The findings indicate that during the warm period (days from 7 to 14 July), the discomfort conditions are increased and the concentrations of pollutants lead to degraded conditions (increased DI and AQHI values) compared to the period from 29 June to 6 July (where the temperature was decreased compared to the days after 7 July) (Figure 3A(a,b)). The hours that the DI is increased (about 1 to 1.5) are the midday hours (Figure 3A(a)), and the AQHI is degraded (about 0.75 to 1.25) during the evening hours (Figure 3A(b)), possibly due to the impact of wind speed and traffic hourly variability. Generally, the wind speed is maximized during the day and reduced during the night hours during the summer period [36]. The positive moderate correlation (about 0.5) between the DI and AQHI shows that these conditions could have a combined negative effect on the population (Figure 3B). The positive correlation between the AQHI and temperature could be possibly explained by the fact that both the AQHI and temperature diurnal cycle follow the anthropogenic activities (maximized during the daytime hours, i.e., vehicle traffic). The relative humidity is reduced and the temperature is increased during the daytime hours, affecting the values of the DI. The boundary layer height, wind speed, and traffic profile are important factors that affect the concentration of pollutants (here, the AQHI values) [13,17,32]. The AQHI and DI show high values at about 15:00, showing that during these hours, the traffic and meteorological conditions possibly have a negative synergy on human health.
Please note that this work is a case study that investigates the relation between the concentration of pollutants, meteorological factors, the AQHI, and the DI during a short period that covers the days from 29 June to 14 July 2024. The findings of the correlation analysis show the results during this short summer period, and they cannot be considered as representative for other periods of the year.
The day hours mean maximum and night hours minimum temperatures during the studied period are about 36.5 °C and 26.5 °C, respectively (Figure 4a). The hours of the mean day maximum and night minimum temperature anomalies (with reference to the hours of the mean day maximum and night hours minimum temperatures of the whole period) over the warmest period (from 7 to 14 July) show positive anomalies from 0.3 °C to 3.4 °C (except 9 July) during the day hours and from 0.0 °C to 1.5 °C during the night hours (Figure 4b). Finally, both the values that are classified in the higher AQHI classes (AQHI > 7) and the DI class that everyone feels severe stress (29 < DI < 32) are present during the day hours, when the majority of human activities are conducted in the city. This point indicates that the health risk is increased (in terms of the concentration of pollutants and meteorological factors) during the day hours (Figure 4c).

4. Conclusions

This study aims to investigate the impact of air quality parameters and climate conditions on human health over an urban environment of Rhodes city. The analysis is focused on the period from 29 June to 14 July 2024, when a heatwave episode occurred. The calculations of the AQHI and DI values during the heatwave episode show that their synergy possibly affects human health negatively (from 7 July to 14 July). Additionally, the findings show that the AQHI and DI during the night hours show improved conditions for human health compared to the daytime hours. The synergy between the increased concentration of pollutants and the extreme meteorological conditions, mainly during the daytime hours, ratchet humans’ health risk up in the urban environment of Rhodes city. The findings indicate that during the hours in which human activities are maximized (during the midday and afternoon hours), the concentration of pollutants and climate conditions increase the danger for people’s health. Finally, the results suggest that the local authorities adopt measures (i.e., alarms or messages to inform the population of the real-time conditions and related health dangers) in order to protect the people and sensitive groups within the population.

Author Contributions

Conceptualization, I.L., A.M. and P.G.; methodology, I.L.; software, I.L.; validation, I.L., A.M. and P.G.; formal analysis, I.L.; investigation, I.L.; resources, I.L.; data curation, I.L.; writing—original draft preparation, I.L.; writing—review and editing, I.L., A.M. and P.G.; visualization, I.L.; supervision, P.G.; project administration, A.M.; funding acquisition, P.G. All authors have read and agreed to the published version of the manuscript.

Funding

This research was funded by the Operational Programme “Competitiveness, Entrepreneurship and Innovation” (NSRF 2014–2020) and co-financed by Greece and the European Union (European Regional Development Fund)—ELECTRON Laboratory of Excellence for the monitoring of environmental impact from transport and promotion of electro-mobility in islandic regions (MIS 5047136).

Institutional Review Board Statement

Not applicable.

Informed Consent Statement

Not applicable.

Data Availability Statement

The original contributions presented in this study are included in the article. Further inquiries can be directed to the corresponding author.

Acknowledgments

We acknowledge the support of this work by the project “ELEKTRON” (MIS: 5047136), which is implemented under the Action “Reinforcement of the Research and Innovation Infrastructure”, funded by the Operational Programme “Competitiveness, Entrepreneurship and Innovation” (NSRF 2014–2020) and co-financed by Greece and the European Union (European Regional Development Fund). The authors would like to acknowledge the Rhodes local authorities for their support. Finally, the authors would like to thank the anonymous reviewers for their valuable comments and suggestions.

Conflicts of Interest

The authors declare no conflicts of interest.

References

  1. Chen, H.; Oliver, B.G.; Pant, A.; Olivera, A.; Poronnik, P.; Pollock, C.A.; Saad, S. Effects of air pollution on human health—Mechanistic evidence suggested by in vitro and in vivo modelling. Environ. Res. 2022, 212, 113378. [Google Scholar] [CrossRef]
  2. Manisalidis, I.; Stavropoulou, E.; Stavropoulos, A.; Bezirtzoglou, E. Environmental and Health Impacts of Air Pollution: A Review. Front. Public Health 2020, 8, 505570. [Google Scholar] [CrossRef]
  3. Mahesti, O.; Tackle Climate Change and Air Pollution Together. United Nations University, UNU Centre, UNU-IAS, 3 January 2024. Available online: https://unu.edu/article/tackle-climate-change-and-air-pollution-together (accessed on 8 August 2024).
  4. Di Napoli, C.; McGushin, A.; Romanello, M.; Ayeb-Karlsson, S.; Cai, W.; Chambers, J.; Dasgupta, S.; Escobar, L.E.; Kelman, I.; Kjellstrom, T.; et al. Tracking the impacts of climate change on human health via indicators: Lessons from the Lancet Countdown. BMC Public Health 2022, 22, 663. [Google Scholar] [CrossRef] [PubMed]
  5. Seneviratne, S.I.; Zhang, X.; Adnan, M.; Badi, W.; Dereczynski, C.; Di Luca, A.; Ghosh, S.; Iskander, I.; Kossin, J.; Lewis, S.; et al. Weather and Climate Extreme Events in a Changing Climate (Chapter 11). In Climate Change 2021: The Physical Science Basis. Contribution of Working Group I to the Sixth Assessment Report of the Intergovernmental Panel on Climate Change; Masson-Delmotte, V., Zhai, P., Pirani, A., Connors, S.L., Péan, C., Berger, S., Caud, N., Chen, Y., Glodfarb, L., Gomis, M.I., et al., Eds.; Cambridge University Press: Cambridge, UK; New York, NY, USA, 2021; pp. 1513–1766. [Google Scholar] [CrossRef]
  6. Logothetis, I.; Tourpali, K.; Melas, D. Projected Changes in Etesians Regime over Eastern Mediterranean in CMIP6 Simulations According to SSP2-4.5 and SSP5-8.5 Scenarios. Environ. Sci. Proc. 2023, 27, 4. [Google Scholar] [CrossRef]
  7. Logothetis, I.; Tourpali, K.; Melas, D. Future Projections of Cloud Cover and Surface Relative Humidity Over Greece during the 21st Century Based on EURO-CORDEX Simulations. Environ. Sci. Proc. 2022, 19, 46. [Google Scholar] [CrossRef]
  8. Seker, M.; Gumus, V. Projection of temperature and precipitation in the Mediterranean region through multi-model ensemble from CMIP6. Atmos. Res. 2022, 280, 106440. [Google Scholar] [CrossRef]
  9. Wedler, M.; Pinto, J.G.; Hochman, A. More frequent, persistent, and deadly heat waves in the 21st century over the Eastern Mediterranean. Sci. Total. Environ. 2023, 870, 161883. [Google Scholar] [CrossRef]
  10. Pascal, M.; Wagner, V.; Alari, A.; Corso, M.; Le Tertre, A. Extreme heat and acute air pollution episodes: A need for joint public health warnings? Atmos. Environ. 2021, 249, 118249. [Google Scholar] [CrossRef]
  11. IPCC. Climate Change 2022: Impacts, Adaptation, and Vulnerability. Contribution of Working Group II to the Sixth Assessment Report of the Intergovernmental Panel on Climate Change; Pörtner, H.-O., Roberts, D.C., Tignor, M., Poloczanska, E.S., Mintenbeck, K., Alegría, A., Craig, M., Langsdorf, S., Löschke, S., Möller, V., et al., Eds.; Cambridge University Press: Cambridge, UK; New York, NY, USA, 2022; 3056p. [Google Scholar]
  12. Logothetis, I.; Antonopoulou, C.; Zisopoulos, G.; Mitsotakis, A.; Grammelis, P. A Case Study of Air Quality and a Health Index over a Port, an Urban and a High-Traffic Location in Rhodes City. Air 2023, 1, 139–158. [Google Scholar] [CrossRef]
  13. Logothetis, I.; Antonopoulou, C.; Zisopoulos, G.; Mitsotakis, A.; Grammelis, P. The Impact of Climate Conditions and Traffic Emissions on the Pms Variations in Rhodes City during the Summer of 2021. In Proceedings of the 7th World Congress on Civil, Structural, and Environmental Engineering (CSEE’22), Virtual Conference, 10–12 April 2022. Paper No. ICEPTP 181. [Google Scholar]
  14. Logothetis, I.; Antonopoulou, C.; Zisopoulos, G.; Mitsotakis, A.; Grammelis, P. Changes in Air Quality Health Index in a Coastal City of the Southeastern Aegean Sea between a Summer and Winter Period of 2022. Environ. Sci. Proc. 2023, 27, 13. [Google Scholar] [CrossRef]
  15. Logothetis, I.; Antonopoulou, C.; Zisopoulos, G.; Mitsotakis, A.; Grammelis, P. Air Quality and Climate Comfort INDICES over the Eastern Mediterranean: The Case of Rhodes City during the Summer of 2021. Environ. Sci. Proc. 2022, 19, 1. [Google Scholar] [CrossRef]
  16. Yao, J.; Stieb, D.M.; Taylor, E.; Henderson, S.B. Assessment of the Air Quality Health Index (AQHI) and four alternate AQHI-Plus amendments for wildfire seasons in British Columbia. Can. J. Public Health 2020, 111, 96–106. [Google Scholar] [CrossRef]
  17. Liu, Y.; Zhou, Y.; Lu, J. Exploring the relationship between air pollution and meteorological conditions in China under environmental governance. Sci. Rep. 2020, 10, 14518. [Google Scholar] [CrossRef]
  18. Poupkou, A.; Nastos, P.; Melas, D.; Zerefos, C. Climatology of Discomfort Index and Air Quality Index in a Large Urban Mediterranean Agglomeration. Water Air Soil Pollut. 2011, 222, 163–183. [Google Scholar] [CrossRef]
  19. Available online: https://elektron-project.gr/index.php (accessed on 17 August 2024).
  20. Available online: https://sdgs.un.org/partnerships/gr-eco-islands-initiative-promoting-sustainable-development-green-economy-energy (accessed on 10 August 2024).
  21. Available online: https://clean-energy-islands.ec.europa.eu/ (accessed on 12 August 2024).
  22. Available online: https://gsri.gov.gr/wp-content/uploads/2022/11/Synopsis_National-Smart-Specialisation-Strategy-2021-2027.pdf (accessed on 10 September 2024).
  23. Chrysomallidis, C.; Tsakanikas, A. The implementation of smart specialization strategy in Greece: Re-balancing governance between the central state and the regions. Reg. Sci. Policy Pract. 2017, 9, 183–200. [Google Scholar] [CrossRef]
  24. Hellenic National Meteorological Service. Available online: https://www.emy.gr/climatic-data?tab=statistics-tab (accessed on 18 January 2025).
  25. National Collaborating Centre for Environmental Health|NCCEH—CCSNE—Uses and Limitations of Low-Cost Sensors in a Changing Climate. Available online: https://ncceh.ca/resources/blog/uses-and-limitations-low-cost-sensors-changing-climate#h2-4 (accessed on 16 January 2025).
  26. Bai, L.; Huang, L.; Wang, Z.; Ying, Q.; Zheng, J.; Shi, X.; Hu, J. Long-term Field Evaluation of Low-cost Particulate Matter Sensors in Nanjing. Aerosol Air Q. Res. 2020, 20, 242–253. [Google Scholar] [CrossRef]
  27. Samad, A.; Obando Nuñez, D.R.; Solis Castillo, G.C.; Laquai, B.; Vogt, U. Effect of Relative Humidity and Air Temperature on the Results Obtained from Low-Cost Gas Sensors for Ambient Air Quality Measurements. Sensors 2020, 20, 5175. [Google Scholar] [CrossRef]
  28. Giordano, M.R.; Malings, C.; Pandis, S.N.; Presto, A.A.; McNeill, V.F.; Westervelt, D.M.; Beekmann, M.; Subramanian, R. From low-cost sensors to high-quality data: A summary of challenges and best practices for effectively calibrating low-cost particulate matter mass sensors. J. Aerosol Sci. 2021, 158, 105833. [Google Scholar] [CrossRef]
  29. Liang, L. Calibrating low-cost sensors for ambient air monitoring: Techniques, trends, and challenges. Environ. Res. 2021, 197, 111163. [Google Scholar] [CrossRef]
  30. De Souza, P.; Kahn, R.; Stockman, T.; Obermann, W.; Crawford, B.; Wang, A.; Crooks, J.; Li, J.; Kinney, P. Calibrating networks of low-cost air quality sensors. Atmos. Meas. Tech. 2022, 15, 6309–6328. [Google Scholar] [CrossRef]
  31. Nalakurthi, N.V.S.R.; Abimbola, I.; Ahmed, T.; Anton, I.; Riaz, K.; Ibrahim, Q.; Banerjee, A.; Tiwari, A.; Gharbia, S. Challenges and Opportunities in Calibrating Low-Cost Environmental Sensors. Sensors 2024, 24, 3650. [Google Scholar] [CrossRef] [PubMed]
  32. Cao, R.; Wang, Y.; Huang, J.; Zeng, Q.; Pan, X.; Li, G.; He, T. The construction of the air quality health index (AQHI) and a validity comparison based on three different methods. Environ. Res. 2021, 197, 110987. [Google Scholar] [CrossRef]
  33. Xu, H.; Hu, X.; Guan, H.; He, G. Development of a fine-scale discomfort index map and its application in measuring living environments using remotely-sensed thermal infrared imagery. Energy Build. 2017, 150, 598–607. [Google Scholar] [CrossRef]
  34. Lou, C.; Liu, H.; Li, Y.; Peng, Y.; Wang, J.; Dai, L. Relationships of relative humidity with PM2.5 and PM10 in the Yangtze River Delta, China. Environ. Monit. Assess. 2017, 189, 582. [Google Scholar] [CrossRef] [PubMed]
  35. Zender-Świercz, E.; Galiszewska, B.; Telejko, M.; Starzomska, M. The effect of temperature and humidity of air on the concentration of particulate matter—PM2.5 and PM10. Atmos. Res. 2024, 312, 107733. [Google Scholar] [CrossRef]
  36. Logothetis, I.; Antonopoulou, C.; Sfetsioris, K.; Mitsotakis, A.; Grammelis, P. Comparison analysis of the effect of high and low port-activity season on air quality in the port of Heraklion. In Proceedings of the 4th International Electronic Conference on Atmospheric Sciences, Online, 16–31 July 2021; MDPI: Basel, Switzerland, 2021. [Google Scholar]
  37. Su, T.; Li, Z.; Kahn, R. Relationships between the planetary boundary layer height and surface pollutants derived from lidar observations over China: Regional pattern and influencing factors. Atmos. Chem. Phys. 2018, 18, 15921–15935. [Google Scholar] [CrossRef]
  38. Tyrlis, E.; Lelieveld, J. Climatology and Dynamics of the Summer Etesian Winds over the Eastern Mediterranean. J. Atmos. Sci. 2013, 70, 3374–3396. [Google Scholar] [CrossRef]
  39. Logothetis, I.; Tourpali, K.; Misios, S.; Zanis, P. Etesians and the summer circulation over East Mediterranean in Coupled Model Intercomparison Project Phase 5 simulations: Connections to the Indian summer monsoon. Int. J. Climatol. 2020, 40, 1118–1131. [Google Scholar] [CrossRef]
Figure 1. The location of the mobile air quality monitoring system (AQMS). It is placed in an urban environment of Rhodes city (“Canada” Street).
Engproc 87 00059 g001
Figure 2. (A) Mean daily (ac) P M 2.5 P M 10   ratio and concentration of pollutants, (df) meteorological factors, (g) discomfort index, and (h) air quality health index. The shaded light blue area indicates the mean value plus/minus one standard deviation. The cold/warm color shaded areas in subplots (g,h) denote improved/degraded conditions for the population. (B) As in Figure 2A but for mean diurnal values.
Engproc 87 00059 g002
Figure 3. (A) (a) The hourly DI anomalies with reference to the whole period mean diurnal DI cycle and (b) the hourly AQHI anomalies with reference to the whole period mean diurnal AQHI cycle. (B) Pearson correlation (r) among the P M 2.5 P M 10 ratio, concentration of pollutants, and meteorological factors. Only the significant lattices at 95% are denoted with the correlation coefficient value.
Engproc 87 00059 g003
Figure 4. (a) Box-plot of day maximum and night minimum hourly temperatures, (b) red/blue line indicates the day maximum/night minimum temperature mean anomalies with reference to period day maximum and night minimum temperatures, respectively, (c) scatter plot of hourly DI and AQHI. The red/blue crosses indicate the day and night hours DI and AQHI.
Engproc 87 00059 g004
Table 1. The classes of the discomfort index (DI) [18].
Class NumberDI (°C)Discomfort Conditions
1DI < 21 No discomfort.
221 ≤ DI < 24Less than half of the population feels discomfort.
324 ≤ DI < 27More than half of the population feels discomfort.
427 ≤ DI < 29Most of the population suffers discomfort.
529 ≤ DI < 32Everyone feels severe stress.
6DI ≥ 32State of medical emergency.
Table 2. The classes of the air quality health index (AQHI) and their associated health suggestions [16].
Health RiskAir Quality Health Index (AQHI)Health Suggestions
Sensitive PopulationGeneral Population
Low1–3Enjoy your usual outdoor activities.Ideal air quality for outdoor activities.
Moderate4–6Consider reducing or rescheduling strenuous activities outdoors if you are experiencing symptoms.No need to modify your usual outdoor activities unless you experience symptoms such as coughing and throat irritation.
High7–10Reduce or reschedule strenuous activities outdoors. Children and the elderly should also take it easy.Consider reducing or rescheduling strenuous activities outdoors if you experience symptoms such as coughing and throat irritation.
Very High>10Avoid strenuous activities outdoors. Children and the elderly should also avoid outdoor physical exertion.Reduce or reschedule strenuous activities outdoors, especially if you experience symptoms such as coughing and throat irritation.
Disclaimer/Publisher’s Note: The statements, opinions and data contained in all publications are solely those of the individual author(s) and contributor(s) and not of MDPI and/or the editor(s). MDPI and/or the editor(s) disclaim responsibility for any injury to people or property resulting from any ideas, methods, instructions or products referred to in the content.

