Proceeding Paper

Influence of Optical Feedback Strength on Intensity Noise and Photon Number Probability Distribution of InGaAsP/InP Laser †

by
Salah Abdulrhmann
1,*,
Abu Mohamed Alhasan
2 and
Jabir Hakami
1
1
Department of Physical Sciences, Physics Division, College of Science, Jazan University, P.O. Box 114, Jazan 45142, Saudi Arabia
2
Physics Department, Faculty of Science, Assiut University, Assiut 71516, Egypt
*
Author to whom correspondence should be addressed.
Presented at the 5th International Electronic Conference on Applied Sciences, 4–6 December 2024; https://sciforum.net/event/ASEC2024.
Eng. Proc. 2025, 87(1), 5; https://doi.org/10.3390/engproc2025087005
Published: 18 February 2025
(This article belongs to the Proceedings of The 5th International Electronic Conference on Applied Sciences)

Abstract

:
We have systematically investigated how the strength of optical feedback (OFB) affects the dynamics, noise levels, and photon number probability density distribution (PNPDD) in time-delayed semiconductor lasers (SLs). We find that intensity noise decreases in both weak and strong OFB regimes. The shape of the PNPDDs changes based on OFB strength: it shifts from symmetric to asymmetric based on the OFB strength. In the chaotic region, the PNPDDs display a peak at low intensity and taper off at multiples of the average photon number. The results of this work suggest that operating SLs under weak or strong OFB conditions may help to minimize instability.

1. Introduction

Minimizing the dispersion and losses in optical fiber is indispensable for optimizing laser devices. In particular, InGaAsP/InP lasers emitting at 1.3 and 1.55 μm are widely used as light sources in optical communication systems because they meet such crucial requirements [1]. The dynamical behavior of SLs is significantly influenced by OFB from an external reflector [2,3,4,5,6,7,8,9]. The effect of OFB depends on various factors, including the OFB strength, external cavity length and injection current [2,3,4,5,6,7,8,9]. Recently, Abdulrhmann et al. investigated the influence of OFB on the dynamics and the operational state of SLs [10,11,12].
It is crucial to thoroughly investigate the effects of the strength of OFB on the stability of SLs in order to achieve the highest static and dynamic performance. Detailed knowledge is fundamental for creating innovative designs that meet advanced performance standards. In this work, the instability of SLs with external cavities in terms of relative intensity noise (RIN) level and PNPDDs is investigated for the first time, particularly across a diverse range of OFB using a unified model. We aim to thoroughly examine the impacts of OFB on RIN, and the corresponding PNPDD, which are expected to have potential applications in SLs equipped with short external cavities. We employ an enhanced model that captures a wide spectrum of OFB [11,12]. This exploration is pivotal for advancing the design of such lasers. Our innovative model lays a solid foundation that intricately incorporates varying levels of OFB, multiple round trips within the external cavity, and the full spectrum of phase variations induced by OFB. As a result, our findings offer experimentally reliable insights surpassing those derived from the previously referenced model in [13]. This study unveils fresh perspectives on the effects of OFB in SLs with short external cavities and their vital role in optical communication systems, including fiber-optic networks. The improved time-delay rate equations have been numerically calculated across various OFB strengths [11,12]. Our analysis will classify the laser’s dynamics based on detailed bifurcation diagrams of the photon number, providing valuable insights into its behavior.
The study analyzes the temporal trajectory of photon numbers, corresponding RIN, and statistically examines variations in output photon number fluctuations in terms of PNPDDs at different OFB strengths. The simulations indicate that OFB strength significantly affects the RIN and PNPDDs. Intensity noise is reduced in relatively weak and strong OFB regimes. The shape of the PNPDDs is strongly influenced by OFB strength, transitioning from symmetric to asymmetric at weak to moderate OFB, respectively. In the moderate OFB range (chaotic region), the PNPDDs exhibit a peak at low intensity and tail off at several times the average photon number. The results suggest that operating SLs under weak or strong OFB regimes may reduce their instability.

2. Simulation Model

Key rate equations govern the behavior of SLs for the photon number S(t), the carrier number N(t), and the phase θ(t). These equations were refined to incorporate the effects of OFB, as detailed in references [11,12].
d S d t = a ξ V ( N N g ) B S G t h 0 + c n r 1 L ln T S + a ξ V N + F S ( t ) ,
d θ d t = α a ξ 2 V ( N N ¯ ) c 2 n r L ( φ φ ¯ ) + F θ ( t ) ,
d N d t = a ξ V ( N N g ) S N τ s + I e + F N ( t ) ,
The term aξ(N − Ng)/V represents the linear gain coefficient, where a and Ng are constants specific to the material, and ξ is the confinement factor of the optical field within the active region of volume V. The parameter α refers to the linewidth enhancement factor, while I denotes the injection current. The coefficient B characterizes the nonlinear suppression of gain, as detailed in references [11,12]. The lifetime is denoted by τs.
Additionally, the complex coefficient T describes the effect of OFB on the threshold condition, as discussed in references [11,12].
T = 1 m = 1 K e x m R f 1 R f m 1 exp j m ψ S ( t m τ ) S ( t ) = T exp j ϕ ,
In this context, m represents an index for the round-trip. The variable ψ is a phase term that incorporates the phase changes resulting from reflection by an external reflector. Rex, nex, and Lex denote the power reflectivity, refractive index, and length of the external cavity of the reflector, respectively. The combined phase ψ is defined as the sum of the phase shift due to reflection by the external reflector ϕex, the phase shift at the front facet, and ϕf, the phase shift resulting from a round-trip in the fiber cavity ωτ: as ψ = ϕex + ϕf + ωτ. Here, ω represents the emission circular frequency, while τ = 2 n e x L e x / c indicates the round-trip time. The strength of the OFB is quantified by the coefficient Kex, which is determined by the ratio of the external reflectivity Rex to the front facet reflectivity Rf.
K e x = ( 1 R f ) η R e x R f ,
where η is the coupling ratio of the injected light into the cavity of the SL. The argument ϕ of the complex output OFB function T is represented by an integer. Determining the value of ϕ in the two-dimensional space defined by ϕ = tan 1 Im T / Re T + l π relies on both the signs and magnitudes of Re[T] and Im[T]. The terms FS(t), Fθ(t), and FN(t) represent Langevin noise sources and are included in the rate equations to account for the intrinsic fluctuations in S, θ, and N. The methods for generating these noise sources are described in detail in reference [10].

3. Simulation Results and Discussions

Equations (1)–(3) are expertly solved using the fourth-order Runge–Kutta method, ensuring precision and reliability. This advanced simulation model focuses on InGaAsP/InP lasers that emit at a wavelength of 1550 nm. The essential numerical values related to these lasers can be found in Table 1 of references [11,12].

3.1. Bifurcation Diagrams

The investigation into how OFB affects laser dynamics and operational states is conducted by simulating the bifurcation diagram of photon numbers S(t) in relation to the OFB strength Kex. The bifurcation diagrams are plotted for an injection current ratio of I/Ith0 = 2, as shown in Figure 1.
In a very weak OFB regime, the solution to the rate equations remains stationary, resulting in continuous wave (CW) operation of the laser, as illustrated in Figure 1. This indicates that the operation is stable in CW mode. As the strength of the OFB, denoted as Kex, increases, the stationary solution undergoes a bifurcation, transitioning first into a stable limit cycle that characterizes periodic oscillation (PO) known as undamped relaxation oscillation. The point at which this bifurcation occurs is referred to as the Hopf bifurcation (HB) point.
In Figure 1, we illustrate that as the strength of the OFB increases, the solution to the rate equations undergoes bifurcation into multiple tours, followed by a chaotic state. These tours represent a lower order of complexity, which can be identified as period doubling (PD). In this case, the PO initially bifurcates into two branches, resulting in the trajectory of S(t) exhibiting two peaks of varying heights within every two successive periods. As the coupling strength Kex increases, the PO is multiplied beyond two branches, leading the laser to transition into chaos.
By enhancing the OFB beyond the chaotic region, we observe a transition in laser operations from CW and chaotic modes to a combination of CW, a narrow range of chaos, and PO operations. This indicates that with strong OFB, the stability of the laser is improved, leading to more stable operational modes.
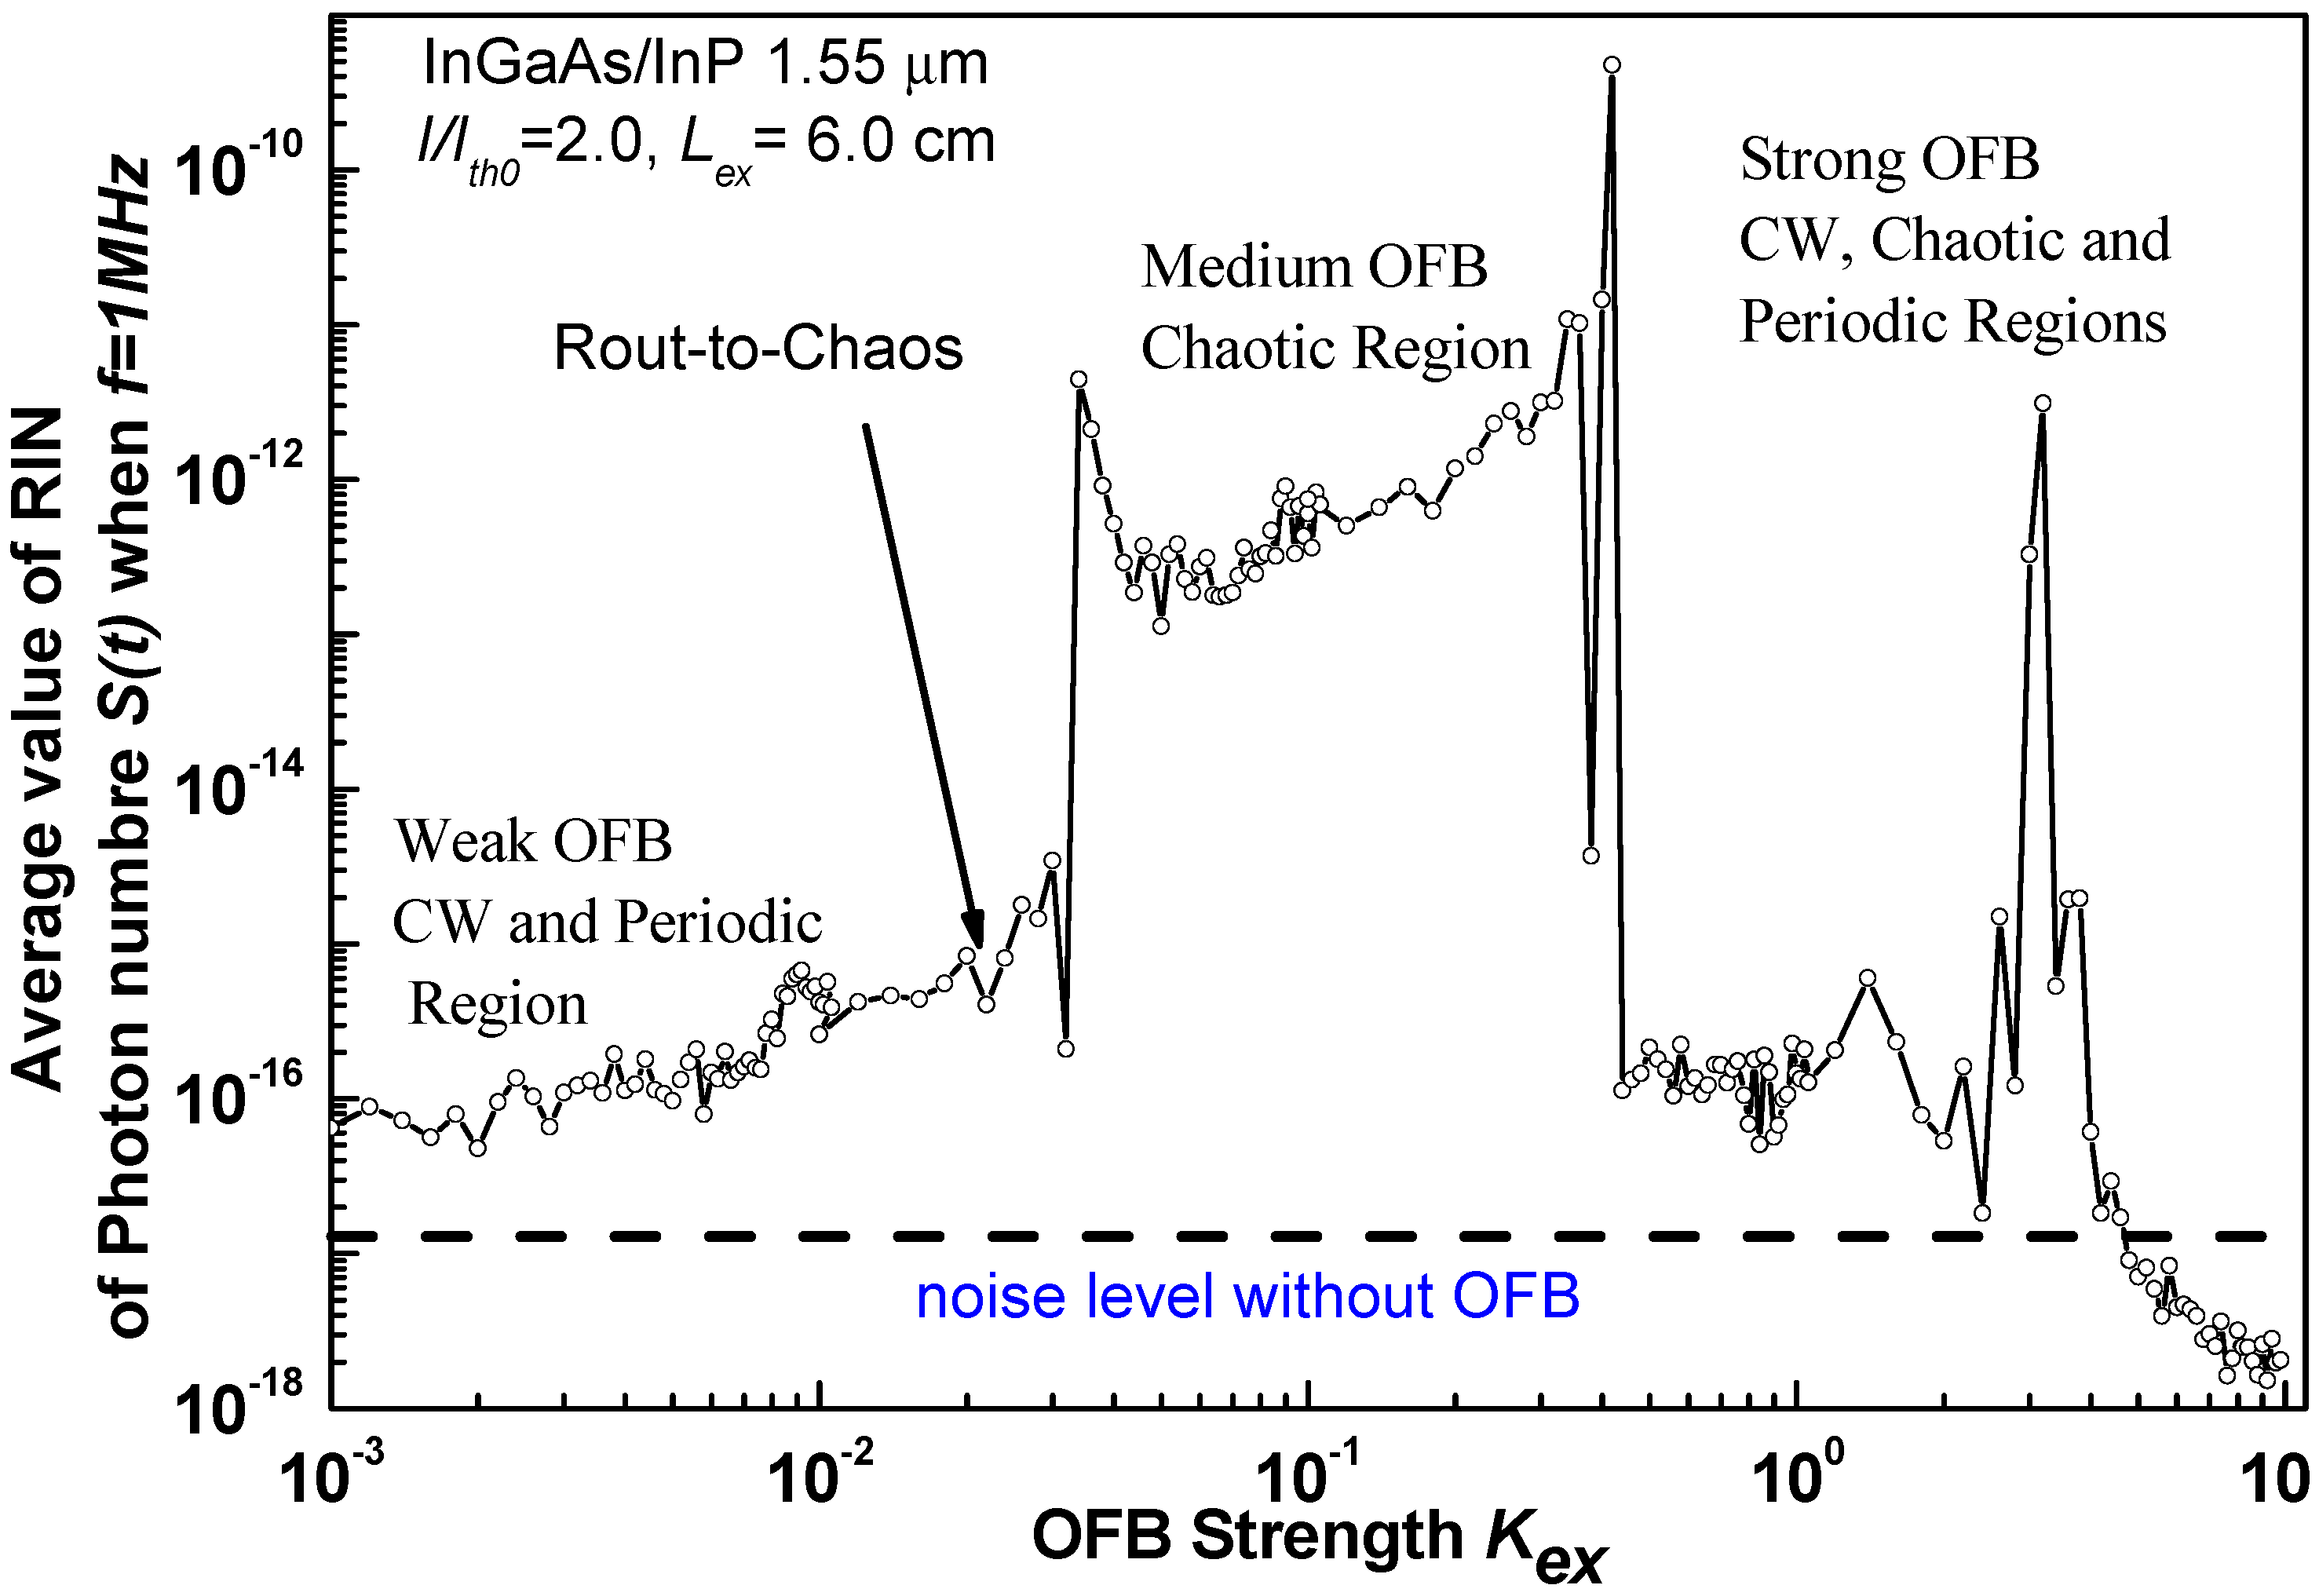
The variation of the RIN averaged over frequencies below 1 MHz is plotted against the strength of the OFB in Figure 2. The data show that under weak feedback conditions, the average RIN is suppressed to the solitary laser noise level (without OFB). In contrast, when a chaotic operation occurs under moderate feedback, instabilities cause the RIN to rise significantly above the solitary laser noise level, exceeding it by more than six orders of magnitude. As depicted in Figure 2, under strong OFB conditions, the average RIN is also suppressed to approximately the solitary laser noise level. However, the instabilities associated with chaotic operation under strong OFB result in an increase in the RIN to levels that are still over six orders of magnitude above the solitary laser noise level.
In the next section, we will characterize the laser’s operational states and noise shown in Figure 1 and Figure 2, in terms of the time variation, RIN, and PNPDD of the photon number S(t).

3.2. Time Variation, RIN, and PNPDD of S(t) for Different Operations of the SL

In this section, we investigate the time variation, RIN, and PNPDD of photon number S(t)/<S(t)> without (Kex = 0) and with OFB for the different operational states. This analysis covers a wide range of OFB strengths, including weak OFB at Kex = 0.008 (CW region), 0.02 (route to chaos region), and moderate OFB at Kex = 0.1 (chaotic state), with an injection current of I/Ith0 = 2.0.
The simulated time variations, RIN, and PNPDD of S(t)/<S(t)> without optical feedback at Kex = 0.0 are presented in Figure 3a–c, respectively. The laser demonstrates oscillations at a single frequency, known as the relaxation frequency fr, which is confirmed by the RIN spectra shown in Figure 3b. Figure 3c displays the corresponding PNPDDs, which resemble a Gaussian distribution with a peak at the average photon number, S(t) = <S(t)>. The broadening of this distribution is attributed to fluctuations in the photon numbers, as illustrated in Figure 3a, where the standard deviation is equal to 0.038440466277806.
Under weak OFB and with OFB strength Kex = 0.008, the time variation of the photon number S(t)/<S(t)>, RIN, and PNPDDs are illustrated in Figure 4. The fluctuations in S(t)/<S(t)> are significantly enhanced when OFB is included, as demonstrated in Figure 4a. This enhancement of S(t)/<S(t)> fluctuations is further reflected in Figure 4b, where an increase in RIN around the low-frequency region and relaxation frequency region is observed. Figure 4c presents the corresponding PNPDDs, which become wider. Furthermore, the shape of the distribution changes as the strength of OFB increases. The broadening of the distribution results from the enhancement of the fluctuations, as shown in Figure 4a. Moreover, the standard deviation of the fluctuations is increased by including OFB from 0.038440466277806 to 0.092457643029461.
By increasing the OFB strength to Kex = 0.02, which corresponds to the region’s leading to chaos, the operation of the laser becomes more complex and can be characterized by periodic variations, such as periodic doubling (PD) oscillations. The PD route to chaos is represented by two distinct peaks, as shown in Figure 5a. These features signify the PD route to chaos, as discussed in Figure 1. In the case represented in Figure 5a (where Kex = 0.02), the system’s nonlinearity increases the irregularities in S(t)/<S(t)>, leading the laser oscillation into the PD region with two peaks due to the increased OFB. The increase in the fluctuations in S(t)/<S(t)> is confirmed in Figure 5b through an increase in the RIN around the low-frequency region and relaxation frequency region and its harmonics; additionally, an external cavity frequency peak appears in the RIN spectrum. Figure 5c displays the corresponding PNPDDs of S(t)/<S(t)>. As the OFB strength increases, the PNPDD becomes wider. However, the shape of the distribution changes with increasing OFB strength, resulting in an asymmetric distribution with two dominant maxima. This indicates that the mode-hopping process develops due to the increased OFB strength. Moreover, the standard deviation of the fluctuations is increased by including OFB from 0.038440466277806 to 0.35544395028614.
Higher OFB, specifically with a Kex = 0.1, which indicates a moderate level of OFB, results in chaotic operation. The time variations, RIN, and PNPDDs of the photon number S(t)/<S(t)> are plotted in Figure 6. As shown in Figure 6a, chaos is indicated by the random variations observed in the photon number S(t)/<S(t)>. Figure 6b presents the RIN spectra that characterize the chaotic dynamics. Spectral peaks are visible at frequencies approximately equal to the relaxation frequency fr, with a notable peak at external cavity frequency fex in the power spectrum around this frequency. The RIN is enhanced here due to the increased strength of the OFB, surpassing the solitary laser noise level by six orders of magnitude. The shape of the PNPDD changes significantly with the increase in the OFB strength, as illustrated in Figure 6c. The PNPDD exhibits a peak at low intensity and gradually declines at several times the average. This type of probability density is expected in a pulsating laser that produces irregular, fully modulated pulses, with peak power several times higher than the average intensity [14,15].

4. Conclusions

We theoretically analyzed the influence of the OFB on the dynamics, noise, and PNPDDs of InGaAsP/InP SL emitting at a wavelength of 1550 nm. The simulation results show that the variation in the OFB strength causes significant changes in the dynamics, RIN, and PNPDDs of the laser. Simulations demonstrate a notable decrease in intensity noise across CW or PO states of OFB regimes. As the strength of the OFB increases, the shape of the PNPDDs evolves: it starts symmetric at weak OFB levels and shifts to asymmetric at moderate levels. In the chaotic region, PNPDDs exhibit a peak at low intensity and gradually decline at multiples of the average photon number. This dynamic state can be explained as the system becomes a stable, low noise level, and uniform PNPDD compared with the solitary laser. The authors compellingly argue that operating SLs under a CW or PO operation state can be an effective strategy to minimize instability, enhancing the reliability of laser performance.

Author Contributions

Conceptualization, S.A.; methodology, S.A.; software, S.A.; validation, S.A., A.M.A. and J.H.; formal analysis, S.A.; investigation, S.A., A.M.A. and J.H.; resources, S.A., A.M.A. and J.H.; data curation, S.A., A.M.A. and J.H.; writing—original draft preparation, S.A.; writing—review and editing, S.A., A.M.A. and J.H.; visualization, S.A., A.M.A. and J.H.; supervision, S.A.; project administration, S.A. All authors have read and agreed to the published version of the manuscript.

Funding

This research received no external funding.

Institutional Review Board Statement

Not applicable.

Informed Consent Statement

Not applicable.

Data Availability Statement

The original contributions presented in this study are included in the article. Further inquiries can be directed to the corresponding author.

Conflicts of Interest

The authors declare no conflicts of interest.

References

  1. Agrawal, G.P.; Dutta, N.K. Semiconductor Lasers, 2nd ed.; Van Nostrand: New York, NY, USA, 1993. [Google Scholar]
  2. Mork, J.; Tromborg, B.; Mark, J. Chaos in semiconductor lasers with optical feedback: Theory and experiment. IEEE J. Quantum Electron. 1992, 28, 93–108. [Google Scholar] [CrossRef]
  3. Hohl, A.; Gavrielides, A. Bifurcation cascade in a semiconductor laser subject to optical feedback. Phys. Rev. Lett. 1999, 82, 1148–1151. [Google Scholar] [CrossRef]
  4. Kitaoka, Y.; Sato, H.; Mizuuchi, K.; Yamamoto, K.; Kato, M. Intensity noise of laser diodes with optical feedback. IEEE J. Quantum Electron. 1996, 32, 822–828. [Google Scholar] [CrossRef]
  5. Kallimani, K.; O’Mahony, M. Relative intensity noise for laser diodes with arbitrary amounts of optical feedback. IEEE J. Quantum Electron. 1998, 34, 1438–1446. [Google Scholar] [CrossRef]
  6. Mahmoud, S.W.Z.; Ahmed, M.; Hassan, A.M.A. Comprehensive large-signal analyses of RF modulation of vertical cavity surface emitting lasers. Opt. Laser Technol. 2013, 45, 406–413. [Google Scholar] [CrossRef]
  7. Meneghini, B.M.; Tazzoli, A.; Mura, G.; Meneghesso, G.; Zanoni, E. A review on the physical mechanisms that limit the reliability of GaN-based LEDs. IEEE Trans. Electron Devices 2009, 57, 108–118. [Google Scholar] [CrossRef]
  8. Olshansky, R.; Su, C.; Manning, J.; Powazinik, W. Measurement of radiative and nonradiative recombination rates in InGaAsP and AlGaAs light sources. IEEE J. Quantum Electron. 1984, 20, 838–854. [Google Scholar] [CrossRef]
  9. Hisham, H.K.; Mahdiraji, G.A.; Abas, A.F.; Mahdi, M.A.; Adikan, F.R.M. Characterization of turn-on time delay in a fiber grating Fabry–Perot lasers. IEEE Photonics J. 2012, 4, 1662–1678. [Google Scholar] [CrossRef]
  10. Abdulrhmann, S.; Ahmed, M.; Yamada, M. Influence of Nonlinear Gain and Nonradiative Recombination on the Quantum Noise in InGaAsP Semiconductor Lasers. Opt. Rev. 2002, 9, 260–268. [Google Scholar] [CrossRef]
  11. Abdulrhmann, S.; Ahmed, M.; Okamoto, T.; Ishimori, W.; Yamada, M. An improved analysis of semiconductor laser dynamics under strong optical feedback. IEEE J. Sel. Top. Quantum Electron. 2003, 9, 1265–1274. [Google Scholar] [CrossRef]
  12. Abdulrhmann, S.; Msmali, A.H. Numerical Analysis on the Impact of Optical Feedback and Nonlinear Gain on the Dynamics and Intensity Noise of Semiconductor Laser. Appl. Phys. B Lasers Opt. 2022, 128, 113. [Google Scholar] [CrossRef]
  13. Lang, R.; Kobayashi, K. External optical feedback effects on semiconductor injection laser properties. IEEE J. Quantum Electron. 1980, 16, 347. [Google Scholar] [CrossRef]
  14. Hanzard, P.-H.; Talbi, M.; Mallek, D.; Kellou, A.; Leblond, H.; Sanchez, F.; Godin, T.; Hideur, A. Brillouin scattering-induced rogue waves in self-pulsing fiber lasers. Sci. Rep. 2017, 7, 45868. [Google Scholar] [CrossRef] [PubMed]
  15. Xu, Y.; Lu, P.; Bao, X. Compact single-end pumped Brillouin random fiber laser with enhanced distributed feedback. Opt. Lett. 2020, 45, 4236–4239. [Google Scholar] [CrossRef]
Figure 1. The bifurcation diagrams for an SL with OFB strength Kex when I/Ith0 = 2.0, without the influence of noise sources.
Engproc 87 00005 g001
Figure 2. The RIN levels averaged over f < 1 MHz when I/Ith0 = 2.0.
Engproc 87 00005 g002
Figure 3. (a) Time, (b) RIN, and (c) PNPDD variations of photon number S(t)/<S(t)> when I/Ith0 = 2.0, without OFB (Kex = 0.0).
Engproc 87 00005 g003
Figure 4. (a) Time, (b) RIN, and (c) PNPDDs variations of photon number S(t)/<S(t)> when I/Ith0 = 2.0, OFB strength Kex = 0.008 (at HB point).
Engproc 87 00005 g004
Figure 5. (a) Time, (b) RIN, and (c) PNPDDs variations of photon number S(t)/<S(t)> when I/Ith0 = 2.0, OFB strength Kex = 0.02 (route-to-chaos).
Engproc 87 00005 g005
Figure 6. (a) Time, (b) RIN, and (c) PNPDDs variations of photon number S(t)/<S(t)> when I/Ith0 = 2.0, OFB strength Kex = 0.1 (chaotic operation).
Engproc 87 00005 g006
Disclaimer/Publisher’s Note: The statements, opinions and data contained in all publications are solely those of the individual author(s) and contributor(s) and not of MDPI and/or the editor(s). MDPI and/or the editor(s) disclaim responsibility for any injury to people or property resulting from any ideas, methods, instructions or products referred to in the content.