1. Introduction
Augmented reality (AR) is increasingly being utilized in various maritime applications. This paper considers the AR model to improve port traffic monitoring. AR is useful for port authorities. The proposed methodology demonstrates significant utility for port authorities and holds considerable promise for the nautical tourist sector, particularly in marina operations. Furthermore, if successfully commercialized, the outcomes of this research could potentially yield a product with board applicability for the stakeholders, thereby enhancing maritime management and recreational boating experiences.
Maritime digitalization and new technology initiatives have been researched in many studies. An investigation of AR’s influence on human performance in maritime navigation was presented in [
1]. AR was proposed to improve situational awareness, because it was observed that there is a lack of such applications. The research presented in [
2] aimed to propose an AR solution to assist sailors in navigation in inland shallow waters. Bathymetric data were presented with AR technology in [
2]. Extended reality was proposed for remote pilotage in [
3]. However, the expectations for AR could be shown to be unrealistic. For instance, in [
4], it was reported that AR did not significantly improve situational awareness and, consequently, help the navigator reduce maritime accidents, at least in six tested scenarios. More practically, AR application was discussed in [
5] based on human-centered solutions and lessons learned in full-mission simulated environments. AR is primarily used in training and teaching [
6]. It is ideal for use because of its low risks and costs compared to real situations, such as fire drills, which can also be implemented in virtual reality [
7].
This paper is organized as follows: The
Section 2 describes the methodology and experimental settings. The
Section 3 presents the preliminary results. The
Section 5 provides some points for discussion and conclusions.
2. Methodology
This section explains the experimental settings and artificial neural network (ANN) implementation of the proposed methodology.
2.1. YOLO-Based Detection
The model’s input is a camera installed in the port. It provides a video stream over an IP connection to the facility where the processing computer is placed. The YOLO (You Only Look Once) artificial neural network performs the ship detection. The developed YOLO detector detects small and large vessels [
8]. Hence, ships with automatic identification systems (AISs) and non-AIS maritime traffic are detected. This creates a realistic real-world scenario for the Mediterranean port traffic portfolio, including passenger ships, fishing ships, tourist ships, yachts, and other small sailing objects. From the Split Port Ship Classification Dataset, we used more than 11,925 images for training and 1688 for testing with a 1920 × 1080-pixel resolution. The model was trained in the YOLOv9 environment for 90 epochs to obtain satisfying results. After evaluation, the model had a validation precision score of 0.98, a recall score of 0.99, and mAP score of 0.99 for 0.5 IOU.
By using a known frame rate and bounding box center coordinates, a velocity is estimated from consecutive frames. The trajectory is projected based on the estimated velocities of the current detected sailing objects. The trajectory prediction is updated with new frames.
The model’s output is the collision risk. In order to be useful for port authorities, the goal is to visualize collision risks in the AR environment. AR is installed on smartphones, and employees of port authorities can easily check for possible problems without the need for powerful computers and desks.
2.2. Trajectory Estimation and Collision Risk Assessment
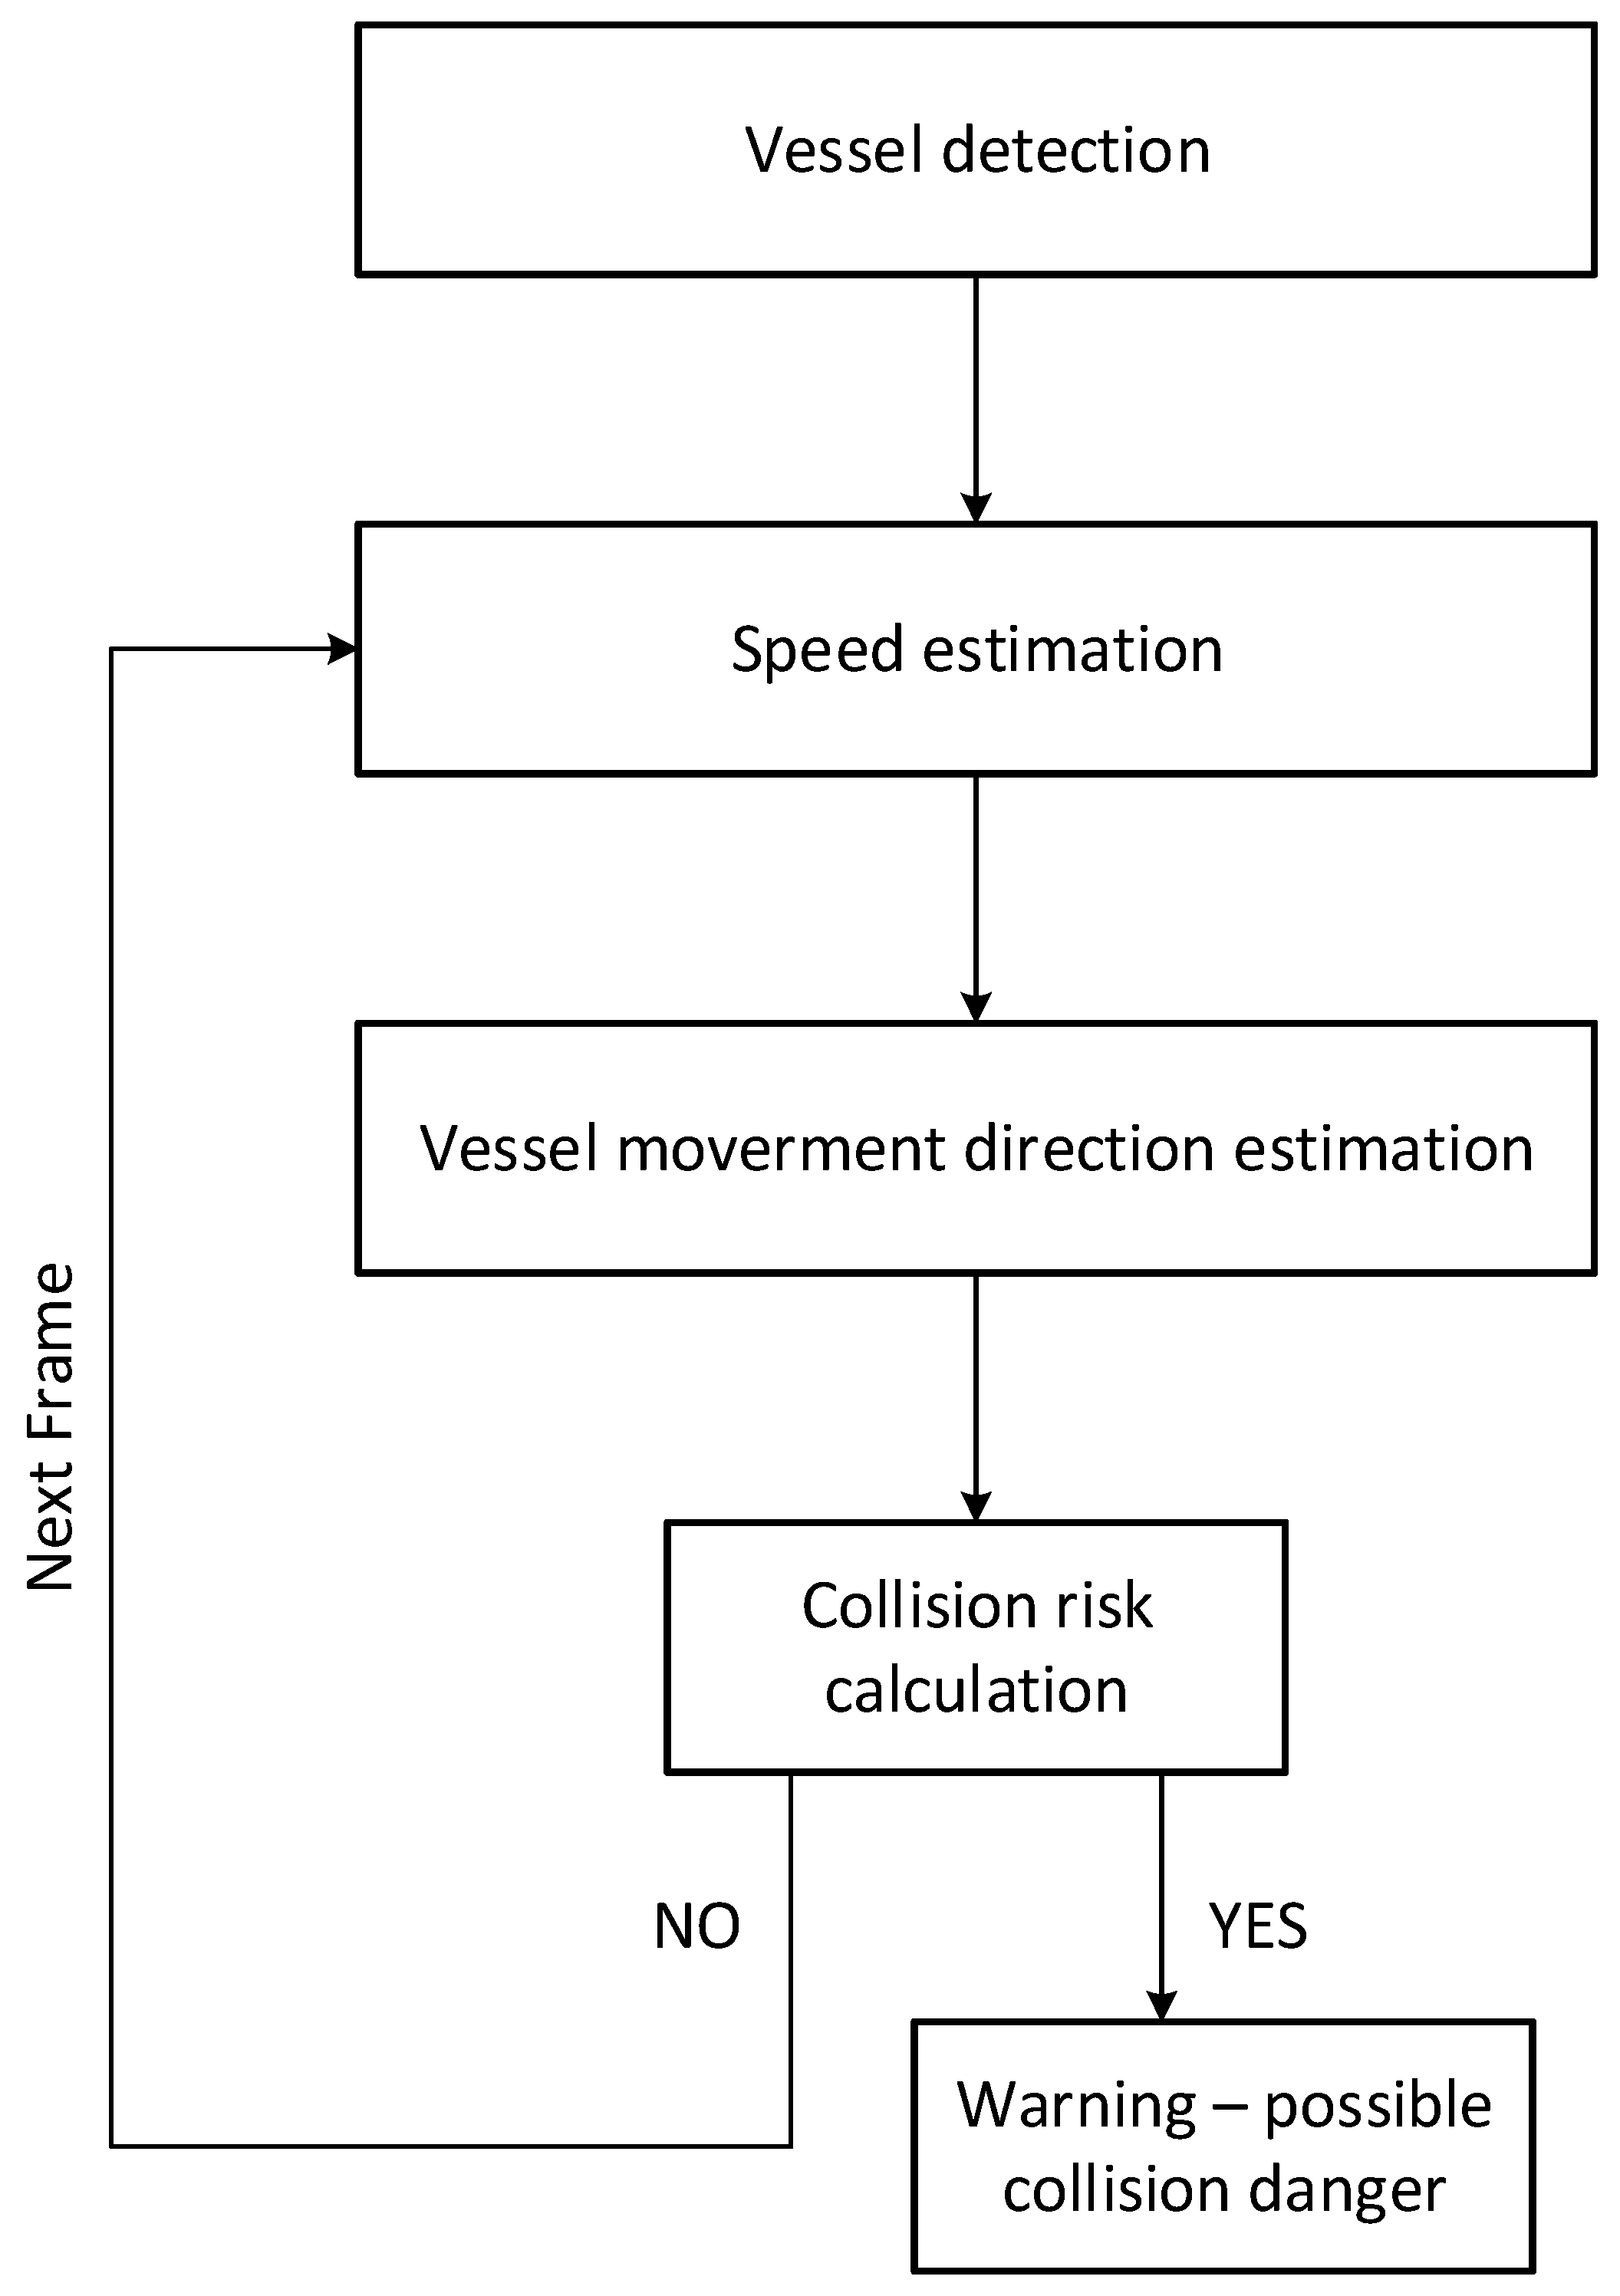
Figure 1 shows a flow diagram of the proposed process for collision danger detection. The first step in the flow diagram is vessel detection. Based on the trained YOLO neural network, the proposed system detects the incoming and outbound vessels from the port. The proposed system classifies the twelve ship types. The second step in the flow diagram is the speed estimation.
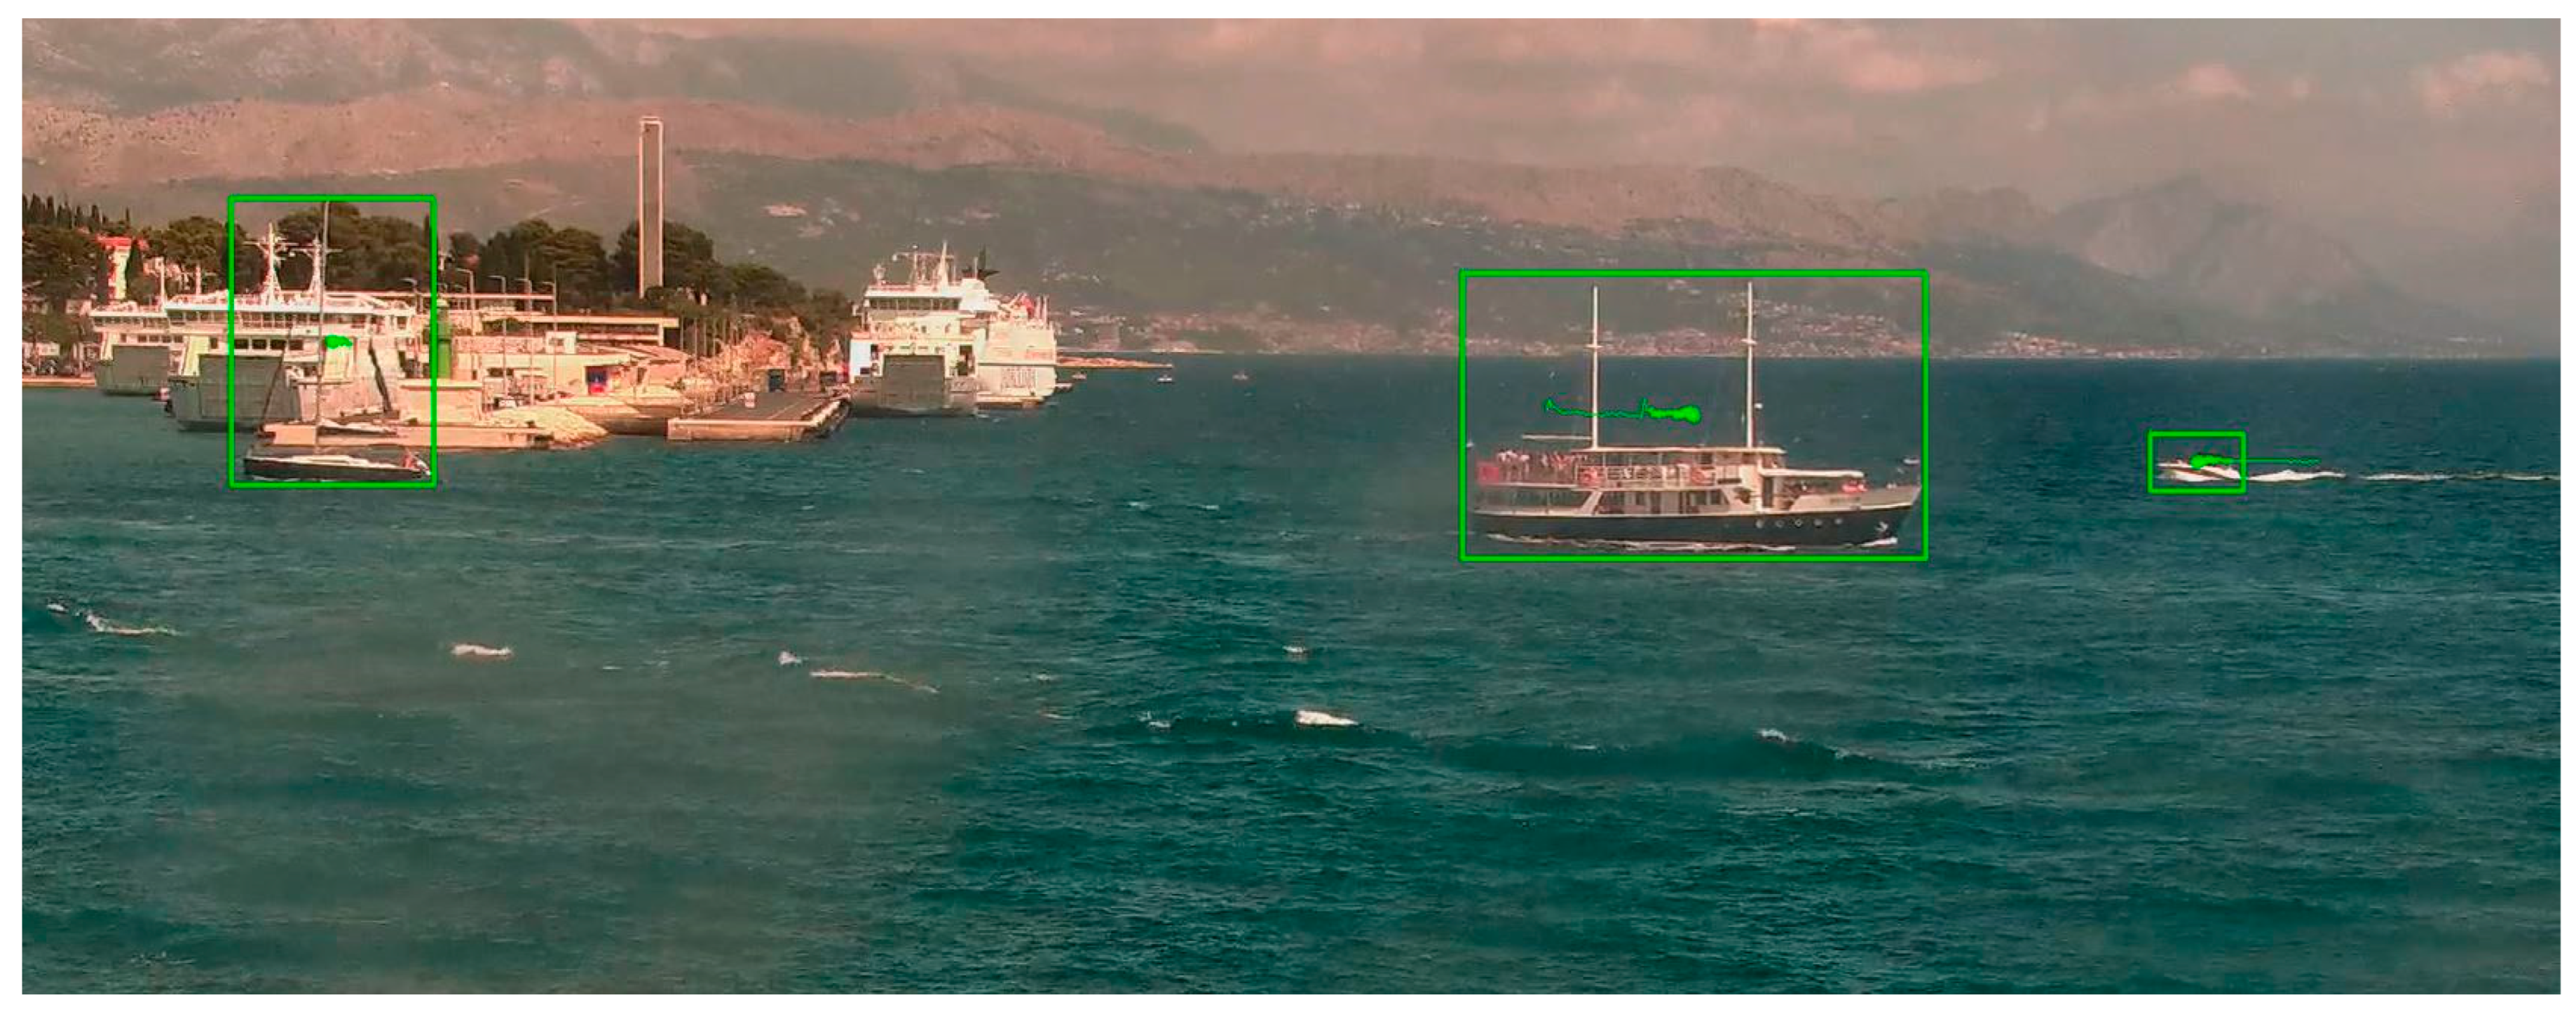
The speed is estimated using distance estimation and the time difference between frames. Hence, the next step is vessel movement direction estimation, which is based on the trajectory estimation. The trajectories are estimated based on the central point of the detected vessel on the video stream from the surveillance camera (
Figure 2). The intersection of the bounding box’s (green boxes in
Figure 2 and
Figure 3) diagonals gives the vessel’s central point, and the position of the central point is remembered for each frame for the last 5 s. The position also depends on external influences. Hence, a linear regression is performed to determine the direction of the vessel’s movement between the memorized positions.
The collision risk assessment is the fourth step in the flow diagram, and it is based on the distance between the vessels and the direction and speed of the vessel’s movement. If the continued movement of the vessel according to the estimated trajectories and speeds results in the intersection of the motion vector, it is suggested that the course or speed of the vessel be changed to eliminate the potential danger of collision. The proposed system uses the ARFoundation framework combined with the Unity engine to develop an augmented reality Android application to display the detection results. Finally, the output of the proposed system is the warning that should be executed in AR.
3. Results
Figure 2 and
Figure 3 show examples of the entrance of standard Mediterranean port traffic. The green boundary boxes show detected vessels, captured by a static surveillance camera mounted in the port. Inside, boundary box trails are drawn from points that represent the movement of the center of the boundary box through the last 3 s of video, with a frame rate of 25 frames per second.
The length of the observed trails depends on the vessel’s speed and its direction of movement relative to the position of the surveillance camera. The direction of the vessel’s movement can be effectively determined by applying linear regression to the data points represented in the x-y coordinate system.
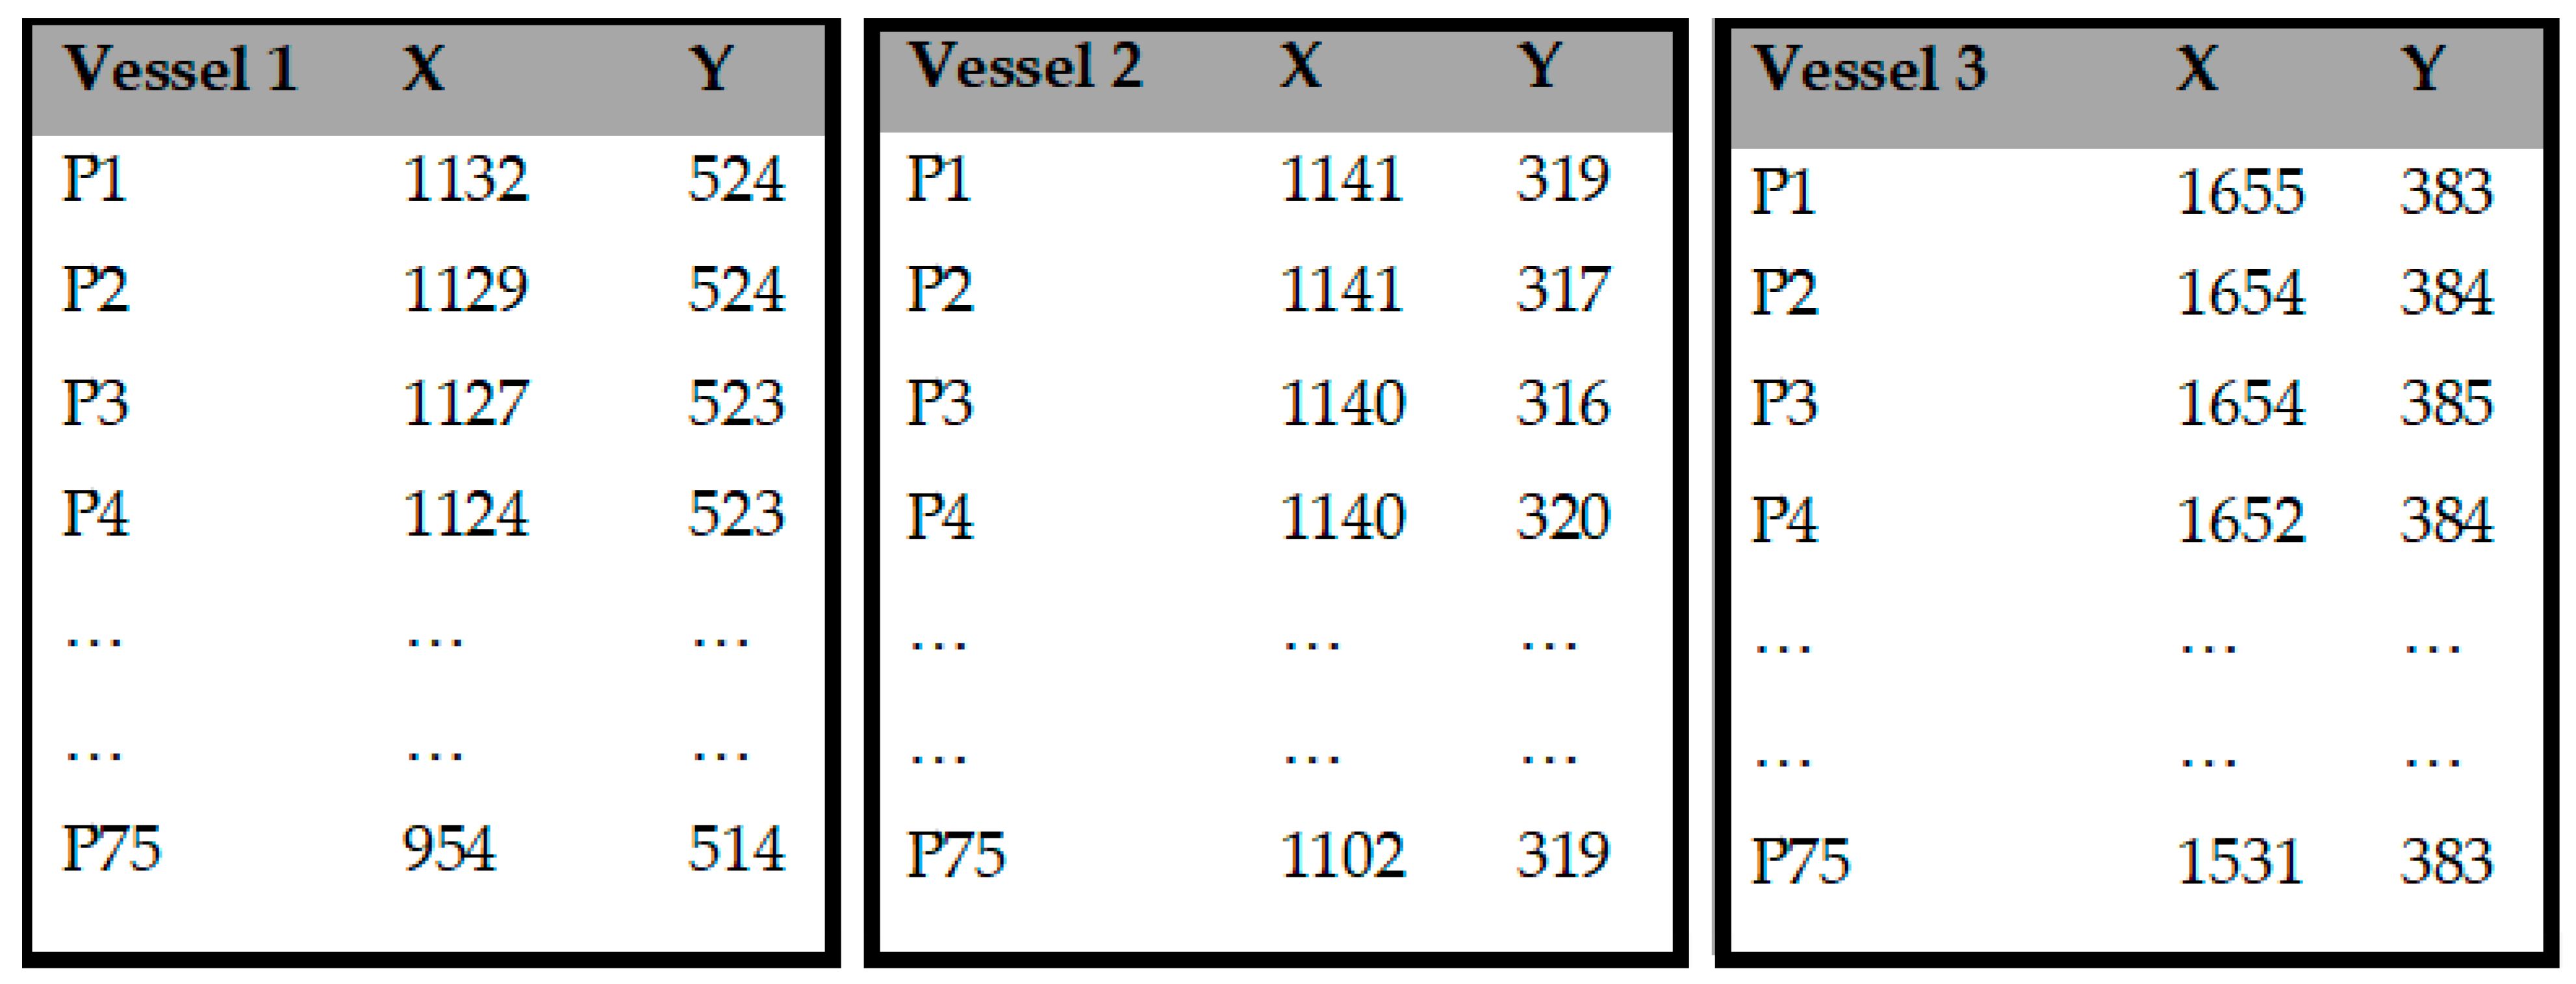
Figure 4 shows the coordinates of data points for the detected vessels in
Figure 3. For each trail, 75 points are recorded in the last 3 s of the video. We use these data to evaluate the route of movement for the vessels.
To perform the linear regression analysis, we start with Vessel 1 and calculate the mean of the variable
x:
The same calculation is repeated for variable
y:
We subtract the mean of the
x and
y variables from each independent variable:
For the next step, we calculate the sum of products (SP) of deviations of the
x and
y variables:
Next, we divide the sum of products (SP) of deviations of the
x and
y variable
by the sum of squares of the
x variable to obtain the slope of the regression line (
):
and finally, we multiply the mean of the
variable and the slope of the regression line (
. We subtract the result from the mean of the variable
to obtain the intercept of the regression line:
In the end, we obtain the regression equation:
Using the same relations, we obtain a regression equation for Vessel 3:
In this particular case, we have three regression lines for each vessel that was detected on the image. A possible intersection of those lines indicates a danger of collision. To investigate the possibility of collision, we calculate the point of collision if the vessels keep moving in the current route and at the current speed.
To find the intersection point for Vessels 1 and 3, we need to solve the following system of equations:
We solve for the
x by equalizing the right side of the equation:
We solve for y by substituting X = −1826.7 into the first equation:
Finally, we have the intersection point:
Because of the negative value of X, we can conclude that the intersection of routes from Vessel 1 and Vessel 3 would possibly be far beyond the observed area. We can calculate from the points trail on the image how many pixels Vessel 1 passed in the last 3 s to obtain the average pixel speed and estimate the time needed to reach the intersection point.
To calculate the speed of vessels in pixels per second, we use the following equations:
Now, we can calculate the time that is needed for vessels to reach the intersection point:
In this specific example, it is determined that Vessel 1 and Vessel 2 will reach the interception point at different times. Hence, it can be concluded that there is no danger of collision in this particular situation. The same calculations are carried out for all detected vessels in order to exclude the possibility of a collision between vessels entering and leaving the port.
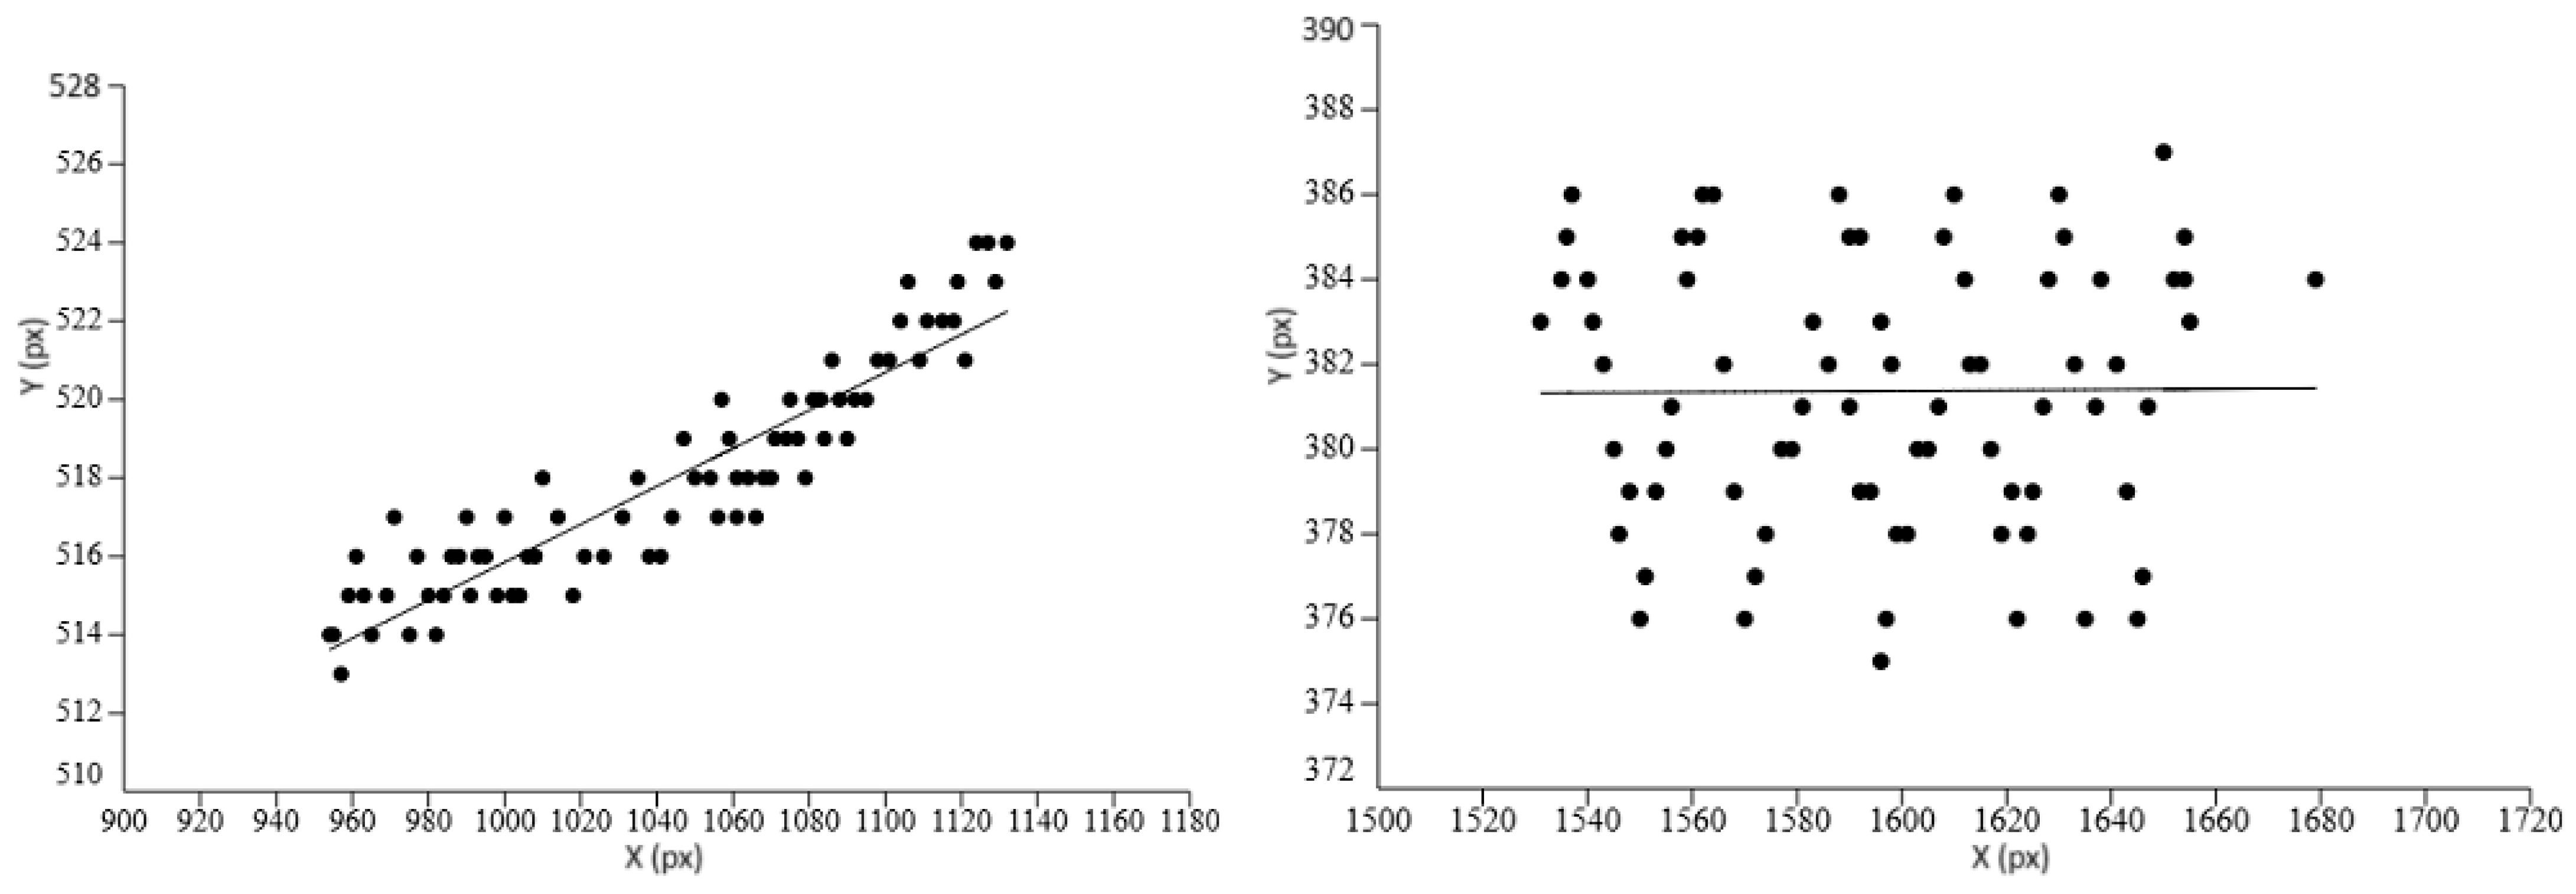
Figure 5 shows how the linear regression works on data collected from trails.
4. Discussion
In demanding conditions like low-light scenarios, using a surveillance camera as the one and only input data is not recommended. Much better results will be obtained by using a thermal camera. When creating the model in our dataset, images of rainy and windy weather were also taken, and the model provided satisfactory detection results in such demanding weather conditions.
In order to further increase the accuracy in future work, we are considering using a second camera, located opposite to the existing one, and we expect even better detection in their parallel operation. A larger dataset was used to reduce the number of negative detections, and the detection threshold was raised, largely eliminating negative detections. To deal with the occlusion problem, a time interval of 3 s was used when calculating trajectories, which in the observed area proved to be sufficient time for two or more vessels to exit the occlusion.
Although the system was tested in the port of Split, it is applicable in almost all Mediterranean-like passenger ports, since it was developed on a large sample of ships that are typical for these ports. A larger number of vessels affects the complexity of calculating the direction and speed of vessels. In the case of a larger number of vessels in congested ports, choosing a computer with greater computing power eliminates any potential problems that they would have.
The decision-support algorithms being observed include methods of collision avoidance by defining the procedures that two or more vessels should perform to avoid a collision when they receive a warning from the proposed system. Which of the detected vessels should change course and/or speed and by how much, when this should happen, and how much distance between them is sufficient when passing each other are all important questions. This is described in COLREG. Hence, the proposed system should be implemented in collaboration with existing navigation systems as an additional option that would positively affect the safety of navigation in seaports.
5. Conclusions
Our results demonstrate the effectiveness of our approach in detecting vessels entering or leaving the port of Split. By applying this method to all identified vessels, we can determine their movement directions and calculate the intersection points of their trajectories within the coordinate system. If an intersection point is in close proximity to a vessel’s current position, it could signify a potential collision risk.
Future work will address conducting usability tests to assess the practical implementation and user-friendliness of the proposed system. The ultimate goal is to develop a server application that is capable of processing all data and communicating in real-time with onboard hardware. This system will provide maneuvering recommendations to a vessel in case a potential collision is detected.


