Proceeding Paper

Projected Changes in Wind Power Potential over a Vulnerable Eastern Mediterranean Area Using EURO-CORDEX RCMs According to rcp4.5 and rcp8.5 Scenarios †

by
Ioannis Logothetis
1,2,*,
Kleareti Tourpali
2 and
Dimitrios Melas
1
1
Laboratory of Atmospheric Physics, Department of Physics, Aristotle University of Thessaloniki, 54124 Thessaloniki, Greece
2
Centre for Research and Technology Hellas, Chemical Process and Energy Resources Institute, Thermi, 57001 Thessaloniki, Greece
*
Author to whom correspondence should be addressed.
Presented at the 5th International Electronic Conference on Applied Sciences, 4–6 December 2024; Available online: https://sciforum.net/event/ASEC2024.
Eng. Proc. 2025, 87(1), 18; https://doi.org/10.3390/engproc2025087018
Published: 12 March 2025
(This article belongs to the Proceedings of The 5th International Electronic Conference on Applied Sciences)

Abstract

Under the threat of the climate crisis, renewables are an alternative that are aligned to European principles for clean energy and green transition strategies. Past studies have shown that the Eastern Mediterranean will present notable short- and long-term wind speed variability due to climate change. In this context, this study investigates the mean changes in wind energy potential (WEP) of a typical height of offshore turbines (80 m) over the climate sensitive area of the Aegean Sea during early, middle and late periods of the 21st century with reference to a base period (the historical period from 1970 to 2005). Data, available from EURO-CORDEX project under the moderate and extreme future scenarios (rcp4.5 and rcp8.5) as well as the recent past (historical) period (from 1970 to 2005), are analyzed here. In both future scenarios, the majority of model simulations indicates an increase in the WEP over the Aegean area as compared to the base period. In particular, the maximum increase in WEP is higher in the rcp8.5 scenario as compared to the rcp4.5 scenario. The most significant changes are shown over the southeastern (the straights between Crete and Rhodes Island) and the central-eastern Aegean area.

1. Introduction

Renewables (RESs; renewable energy sources) are considered to be viable solutions to restrain the effects of climate change. It is recognized that RESs are an important and innovative solution that contribute by reducing an ecosystem’s sensitivity and by building climate resilience in an economic autonomous environment [1]. The increased penetration of RESs in the energy system is associated with the European Union’s (EU) green and clean energy strategies that promote healthier conditions and increased sustainability for ecosystems [2,3]. EU strategies promote actions that emphasize a green transition towards green and clean energy ecosystems. These priorities aim to minimize climate risks and protect the environment as well as the biodiversity of vulnerable environments that are affected by future economic and climate challenges [2,3,4]. The objectives of EU climate policies follow the priorities and targets that the European Green Deal and Paris Agreement involve, reflecting actions that are under the umbrella of climate neutrality, net-zero greenhouse gases (GHGs) emissions and decarbonization [4,5]. The EU’s Smart Specialisation Strategies (S3) encourage all EU regions to innovate and develop their competitive advantages, with a goal of the EU maturing and cooperating together and mobilizing stakeholders [6]. Regarding the penetration of RESs in the energy system, EU policies aim to achieve a goal of 32% renewable energy by 2030. One of the keys to transitioning to green energy is using the energy from the wind, which is considered to be a mature, competitive and cost-effective energy source. In addition, renewable wind energy shows a higher TRL (technological readiness level) as compared to the other RESs. These elements provide significant advantages regarding the adoption of wind energy as an alternative for the penetration of RESs in the energy sector. In this context, the EU aims to increase the offshore energy capacity to 60 GW by 2023 and, consequently, to 300 GW by the middle of the 21st century [3,4].
The Mediterranean region is highly affected by the effects of the climate crisis. Previous studies have shown that the Mediterranean is prone to climatic changes and extremes, characterizing this vulnerable ecosystem as a climate “hot spot” [7,8,9]. Results of global and regional climate model simulations (RCMs and GCMs) and reanalysis data, observations and satellite data have already shown that the Aegean Sea, which is located in the southeastern Mediterranean region, is one of the most energetic areas regarding wind potential [10,11,12]. The strong winds over the eastern Mediterranean in combination with increased economic efficiency to produce energy from winds suggest that offshore wind energy parks could be a viable solution for a green transition (as well as being in line with national and EU clean energy and climate neutrality strategies) [9,13]. RCMs are a robust tool for investigating atmospheric circulation features and climate changes in high spatial resolution using various future development scenarios by 2100 that span from 2.6 W/m2 to 8.5 W/m2 radiative forcing [14,15]. Katopodis et al. [16] have shown, using results from WRF (5 × 5 km2; which was forecasted using the EC-EARTH global climate simulation), that wind energy density between the middle of 21st century (according to both rcp4.5 and rcp8.5 scenarios) and the historical period from 1980 to 2005 (as a base period) varies locally by about −15% to 60% over the Aegean area. Climate projections of the ensemble mean model simulations from the EURO-CORDEX project have shown a significant increase in wind power generation over the Aegean area. In particular, the last period of the 21st century (according to the extreme rcp8.5 scenario) compared to the recent past period (from 1971 to 2000) has shown an increase of up to 15% of energy potential in some regions of the Aegean area [17]. Additionally, other studies have shown that the projected wind energy will be beneficial for the Aegean area, providing the opportunity for energy investments that would be related to offshore wind energy parks [14,15,18,19]. Kozyrakis et al. [20], using downscaling model (WRF) techniques, ERA5 reanalysis and observations data for a 40-year period (of a recent historical period), have shown that Greek seas provide the wind energy capacity required in order to contribute on the electrification net of Greek islands. Furthermore, the combination between high wind energy potential and low variability in wind speed indicates positive conditions for techno-economic investments in the offshore wind energy sector throughout the Greek domain [21].
Generally, wind electricity generation is dependent on the strength and variation in wind speed, indicating the importance of investigating the changes of wind speed in a future period [22]. In this context, this study aims to provide more information regarding the changes in the wind energy potential throughout the Greek domain. The analysis uses the results from regional climate models (RCMs) that are driven by GCMs and are available in the frame of the EURO-CORDEX project. The analysis of future changes is mainly focused on the period that shows the maximum changes, the last period of the 21st century, which is from 2070 to 2099. The base period is considered to be the years of the recent historical period that spans from 1970 to 2005. For the future projections, the moderate (rcp4.5) and extreme (rcp8.5) future scenarios are implemented.
The work is organized as follows: In Section 2 (“Materials and Methods”), the methods and data that were used in this study are shown. In Section 3 (“Results”) and Section 4 (“Discussion”), the findings and also a short discussion of the main results are presented. Finally, in Section 5 (“Conclusion”), the main results of this study are summed up.

2. Materials and Methods

Monthly mean zonal and meridional wind speed components at 10 m were retrieved from the World Climate Research Program Coordinated Regional Downscaling Experiment (CORDEX) project [23], focusing over the eastern domain of the Mediterranean region in order to calculate the wind speed and wind energy potential (WEP). The EURO-CORDEX project is the European branch of the international CORDEX initiative that provides high-resolution climate information at regional scales, promoting investigations of climate projections [23]. In addition, the EURO-CORDEX project brings the global climate model (GCM) community in contact with the regional climate model (RCM) community, promoting regional investigations regrading climate projections. The EURO-CORDEX model simulations are driven by Coupled Model Intercomparison Project Phase 5 (CMIP5) model simulations. In this study, data from EURO-CORDEX (driven by CMIP5) model simulations are analyzed at the finest resolution of 0.11° (about 12.5 km; EUR-11). In particular, six RCM model simulations that are driven by four GCMs (CMIP5) are analyzed in this study (Table 1). The projections of WEP are studied under two representative concentration pathways (rcp). In particular, the moderate and extreme rcp scenarios (rcp4.5, and rcp8.5) are studied. Generally, rcp scenarios are different assumptions regarding the socioeconomic and physical change of the Earth’s climate system. The rcp4.5 and rcp8.5 scenarios depict 4.5 W/m2 and 8.5 W/m2 radiative forcing at the end of the 21st century, respectively, expressing different future emission scenarios regarding the preindustrial period. In particular, the rcp4.5 scenario predicts approximately 650 ppm CO2-equivalent at the end of the 21st century without exceeding this value. Regarding the rcp8.5 scenario, the CO2-equivalent predicts approximately 900 ppm at the end of the 21st century.
In this study, the WEP differences between three different future periods—the current, middle and last periods of the 21st century (F1, 2010–2039; F2, 2040–2069; F3, 2070–2099) as well as the base historical period that is considered to be the reference period (Ref., 1970–2005) are calculated. The statistical significance of the composite differences is calculated at the 95% confidence level using the two-tailed t-test [13].
In this study, the height of 80 m is considered to be a typical offshore turbine height. The logarithmic law was used in order to extrapolate the calculated wind speed (from meridional and zonal wind speed components that are available for each one of the RCM simulations) from 10 m to 80 m [10,24] (Equation (1)).
V H = V 10 l n H z 0 l n 10 z 0
where V H indicates the hub height of the offshore wind turbine at height H, V 10 is wind speed at 10 m and z 0   is the roughness length expressed in meters ( z 0 = 0.001 m was used for open, calm seas; see [10]). The WEP is calculated using the following equation [10,19,24] (Equation (2)):
W E P = 1 2 ρ V H 3
where ρ is air density.

3. Results

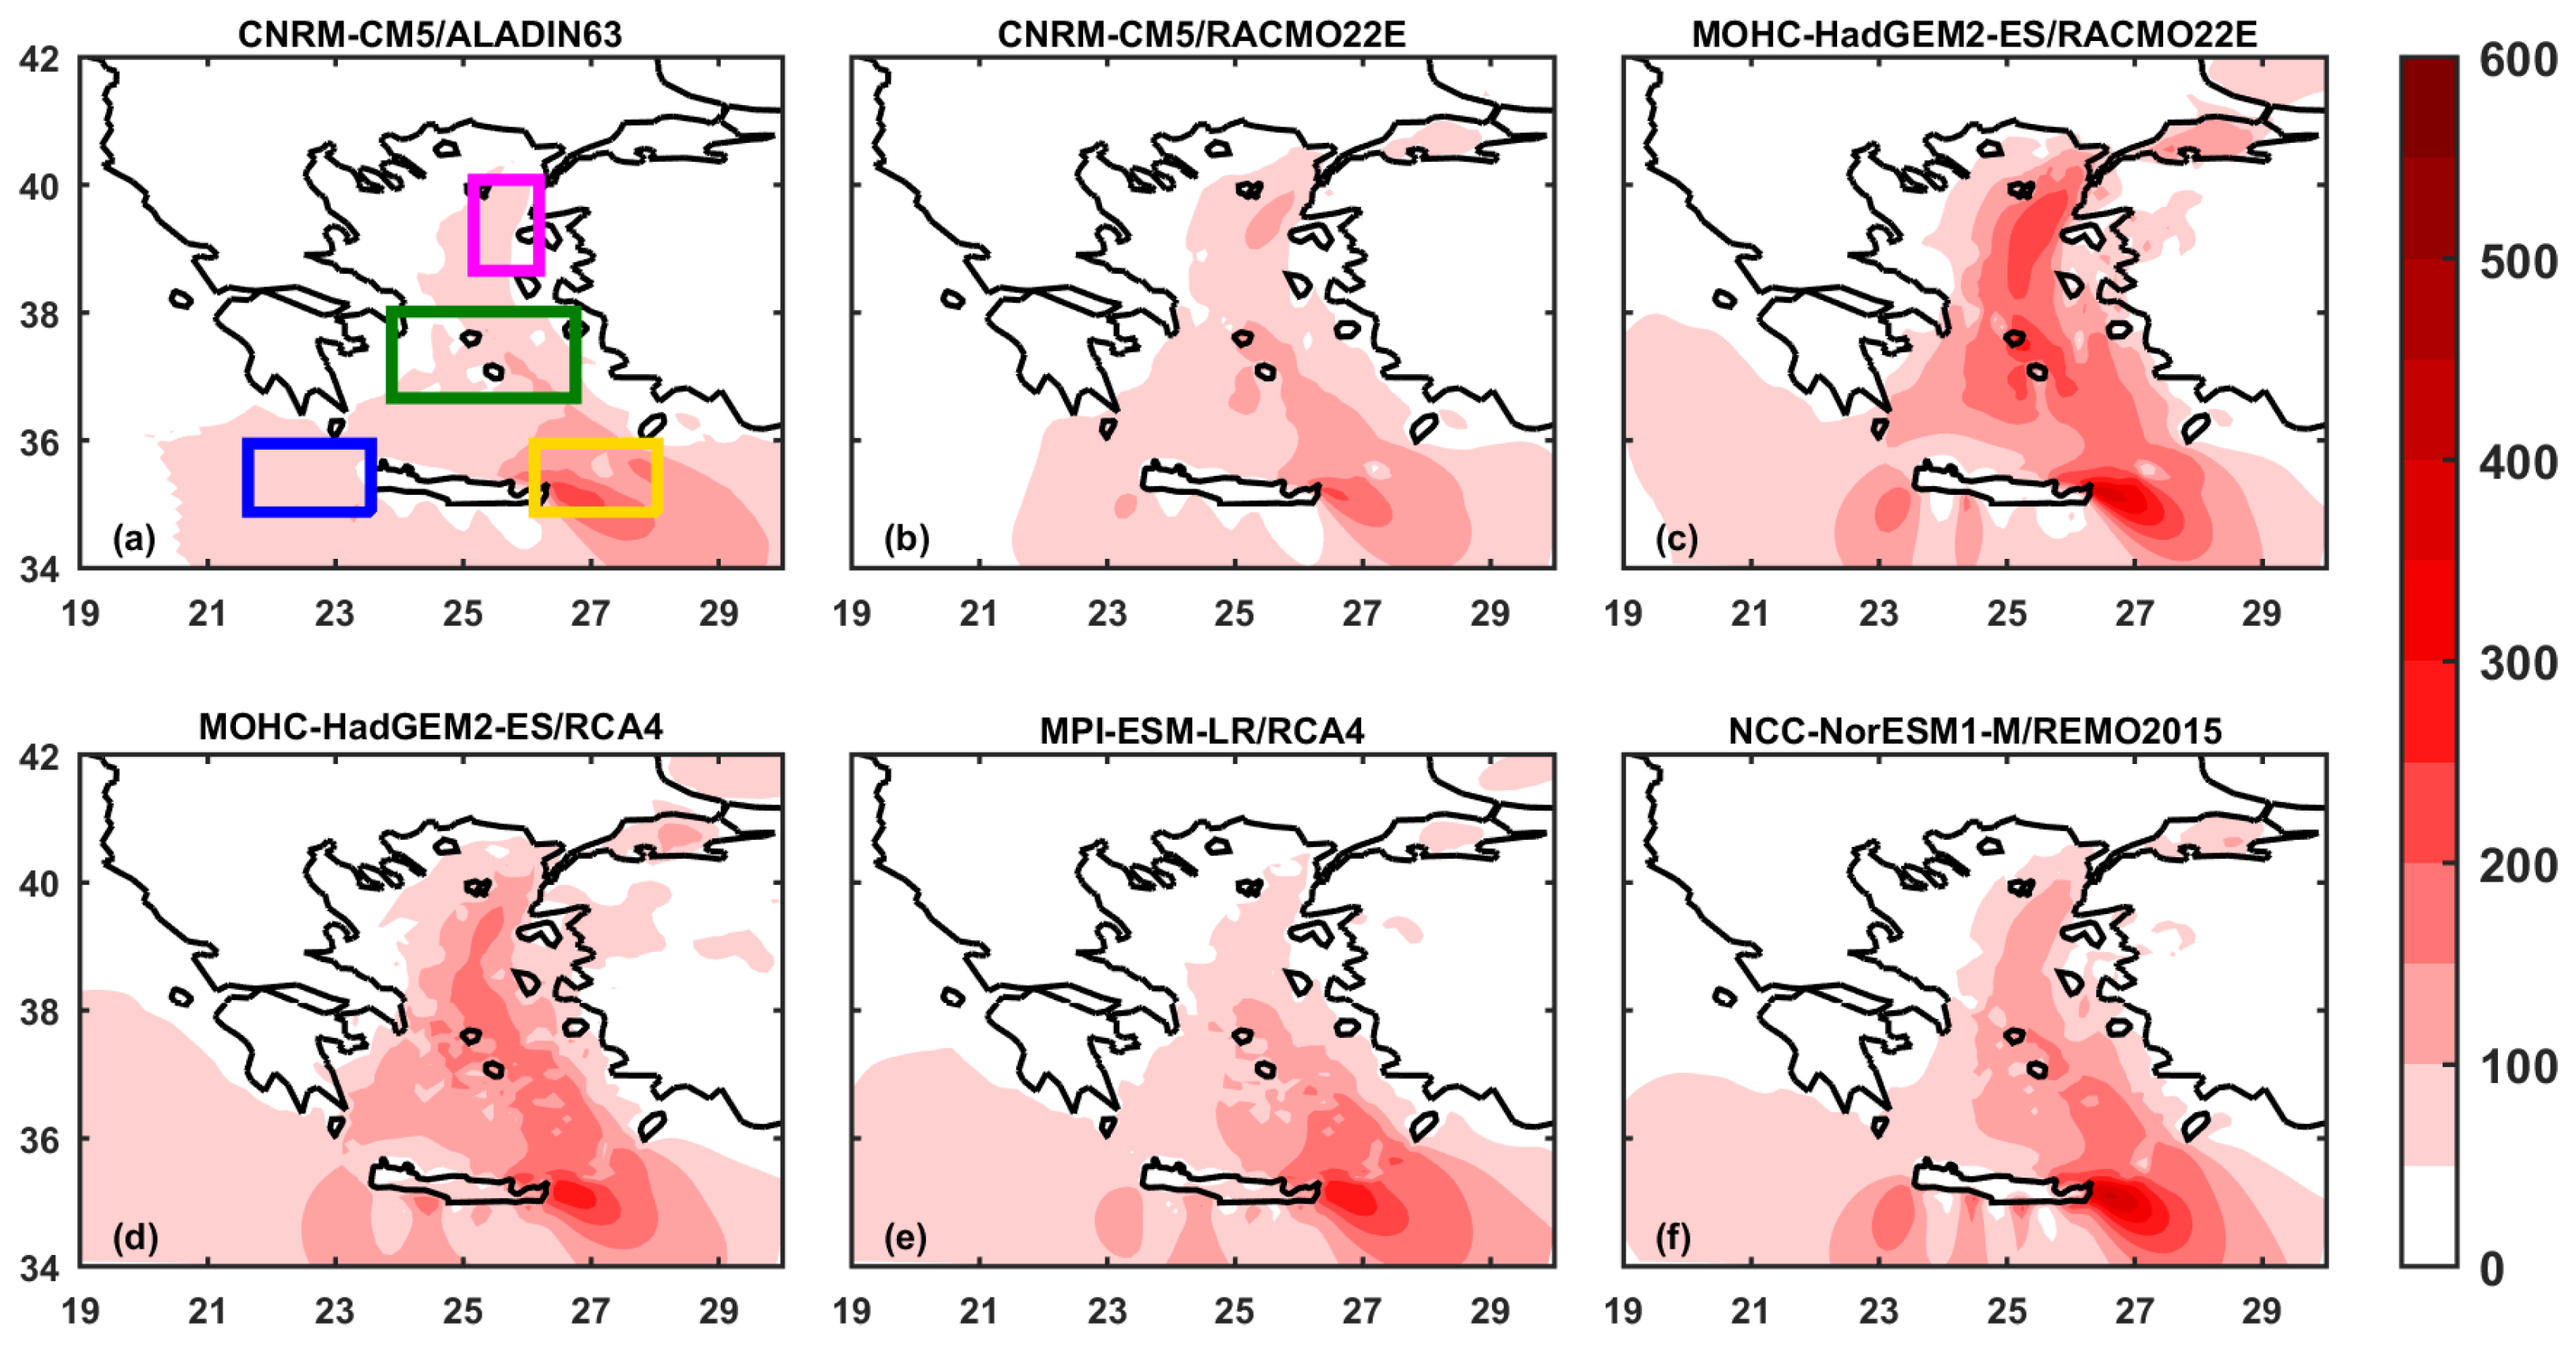
3.1. Mean WEP During the Period from 1970 to 2005

Figure 1 shows the composite mean of wind energy potential (WEP; W/m2) over the Aegean basin during the period from 1970 to 2005 (Ref.). The analysis shows that the region of the southeastern Aegean (in particular, the region between Crete and Rhodes Island), the central Aegean and the northeastern Aegean present increased WEP as compared to the other areas in the Greek domain. All model simulations show that the maximum WEP over the Aegean area is located over the southeastern Aegean in the area southeast of Agios Nikolaos in Crete (Figure 1). For the majority of model simulations (Figure 1), the WEP indicates good and excellent quality regarding wind energy generation (in the northeast, central and mainly southeastern Aegean regions) according to international standards of wind power generation classification [25,26].

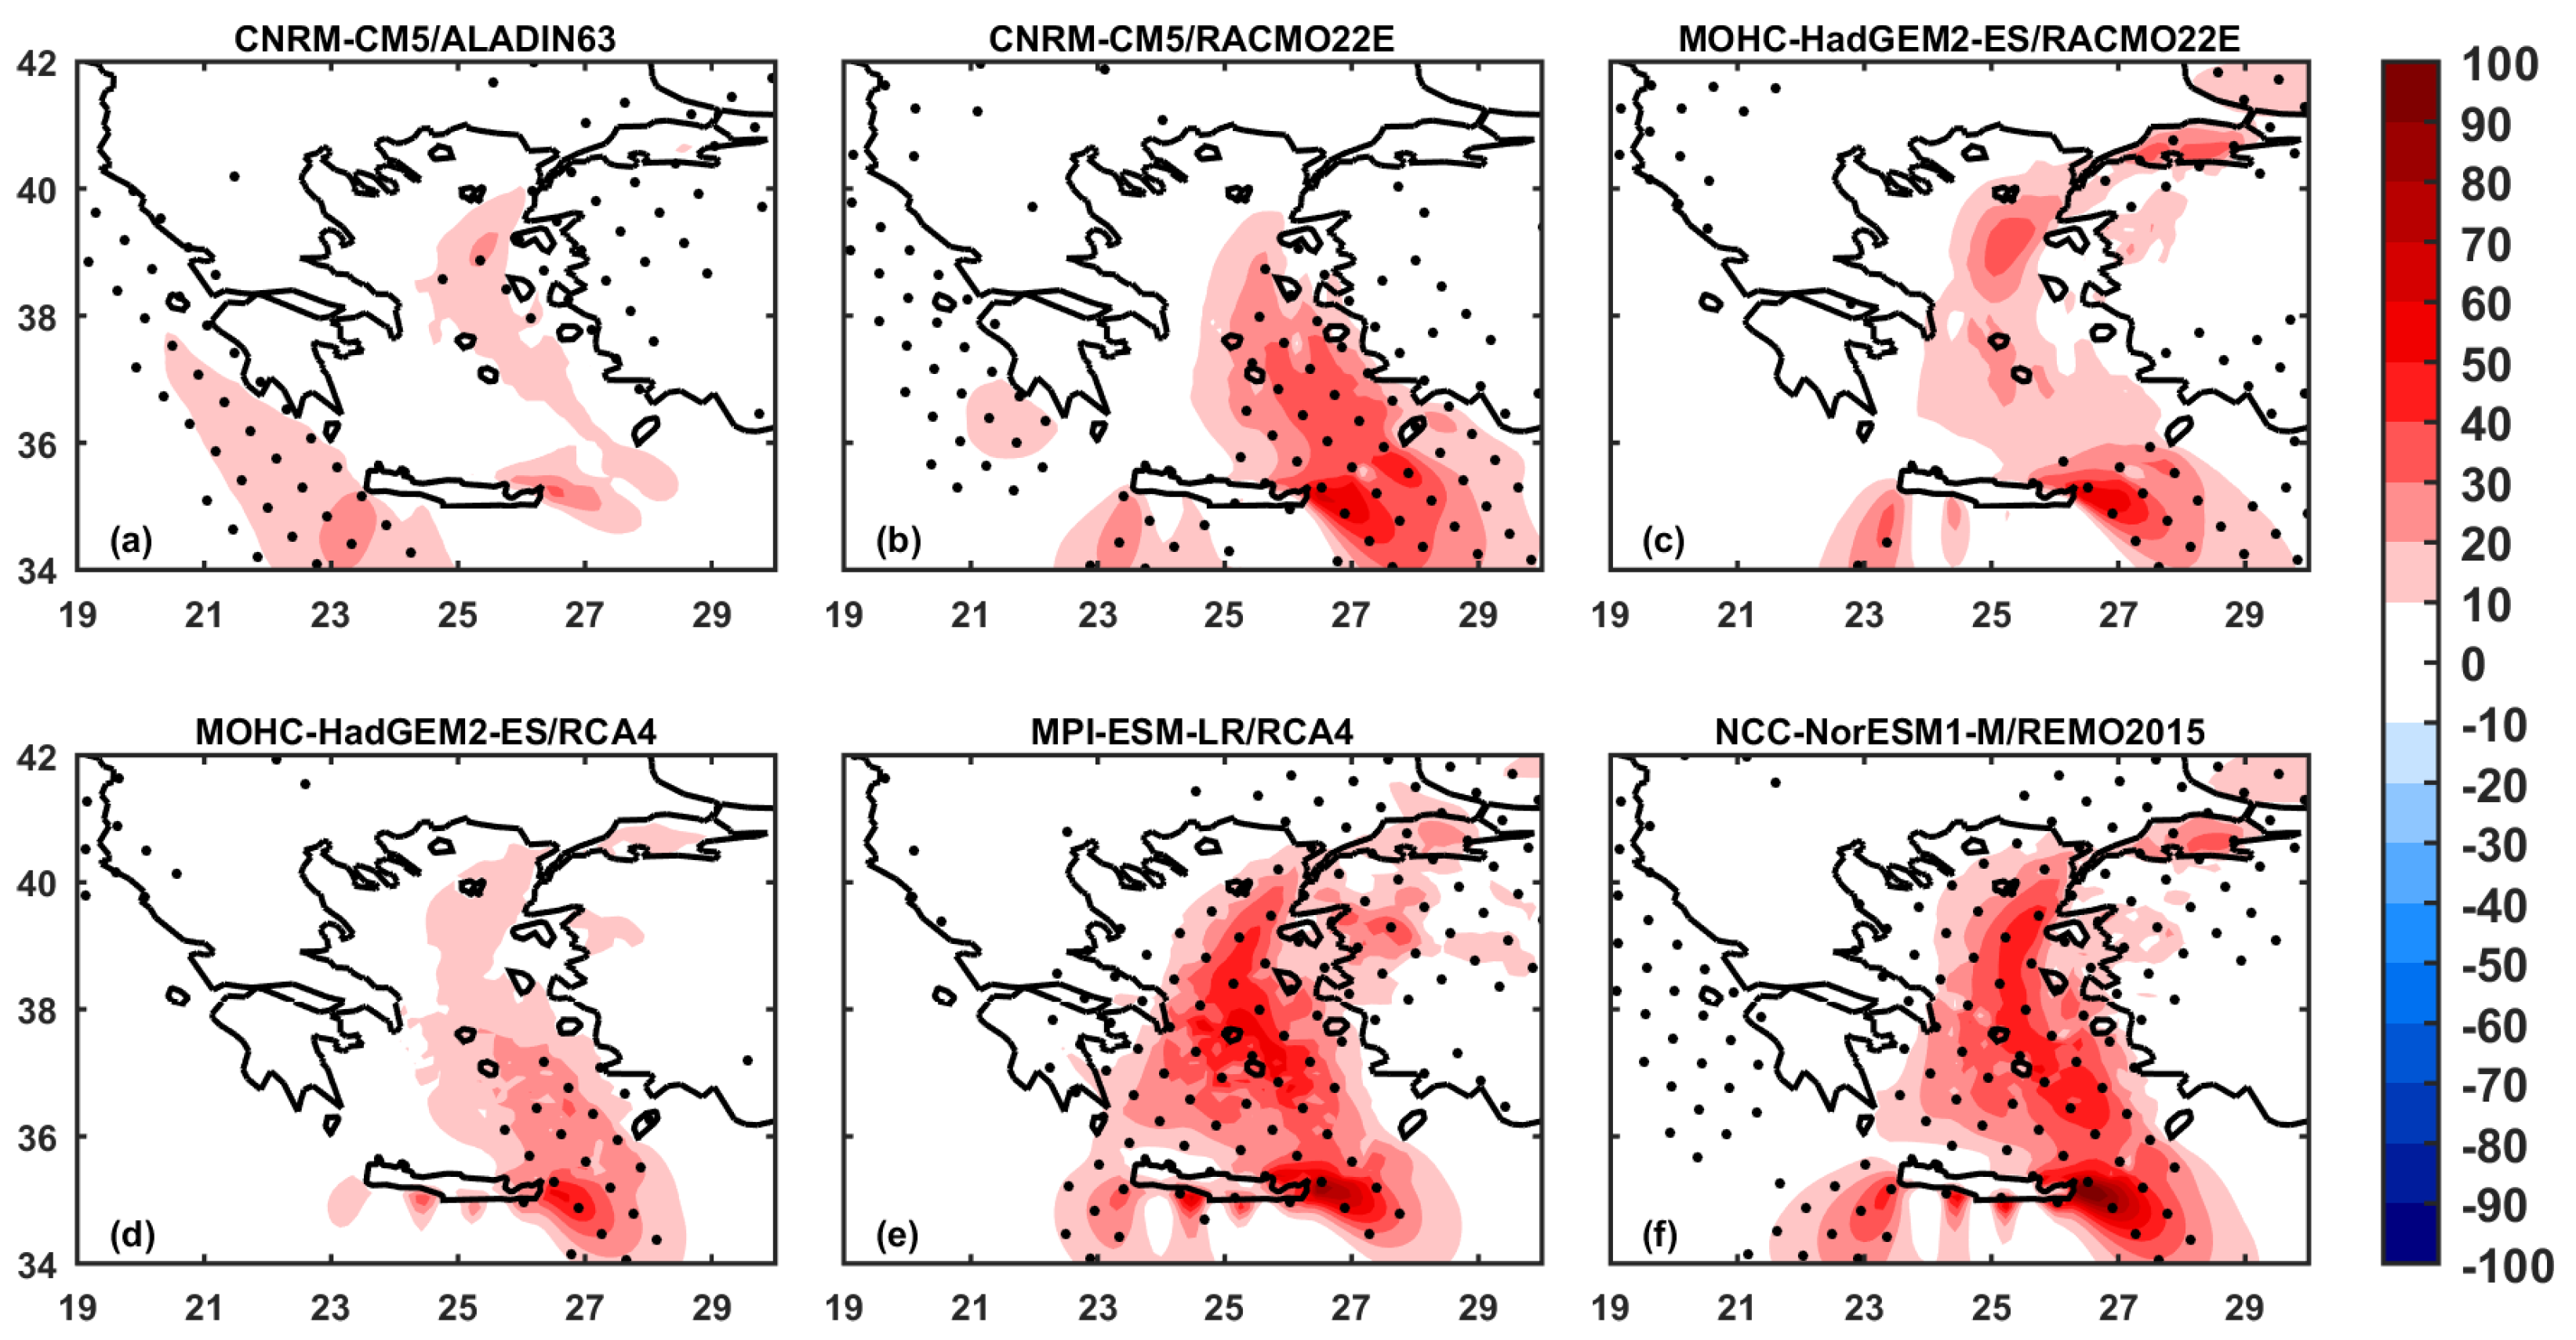
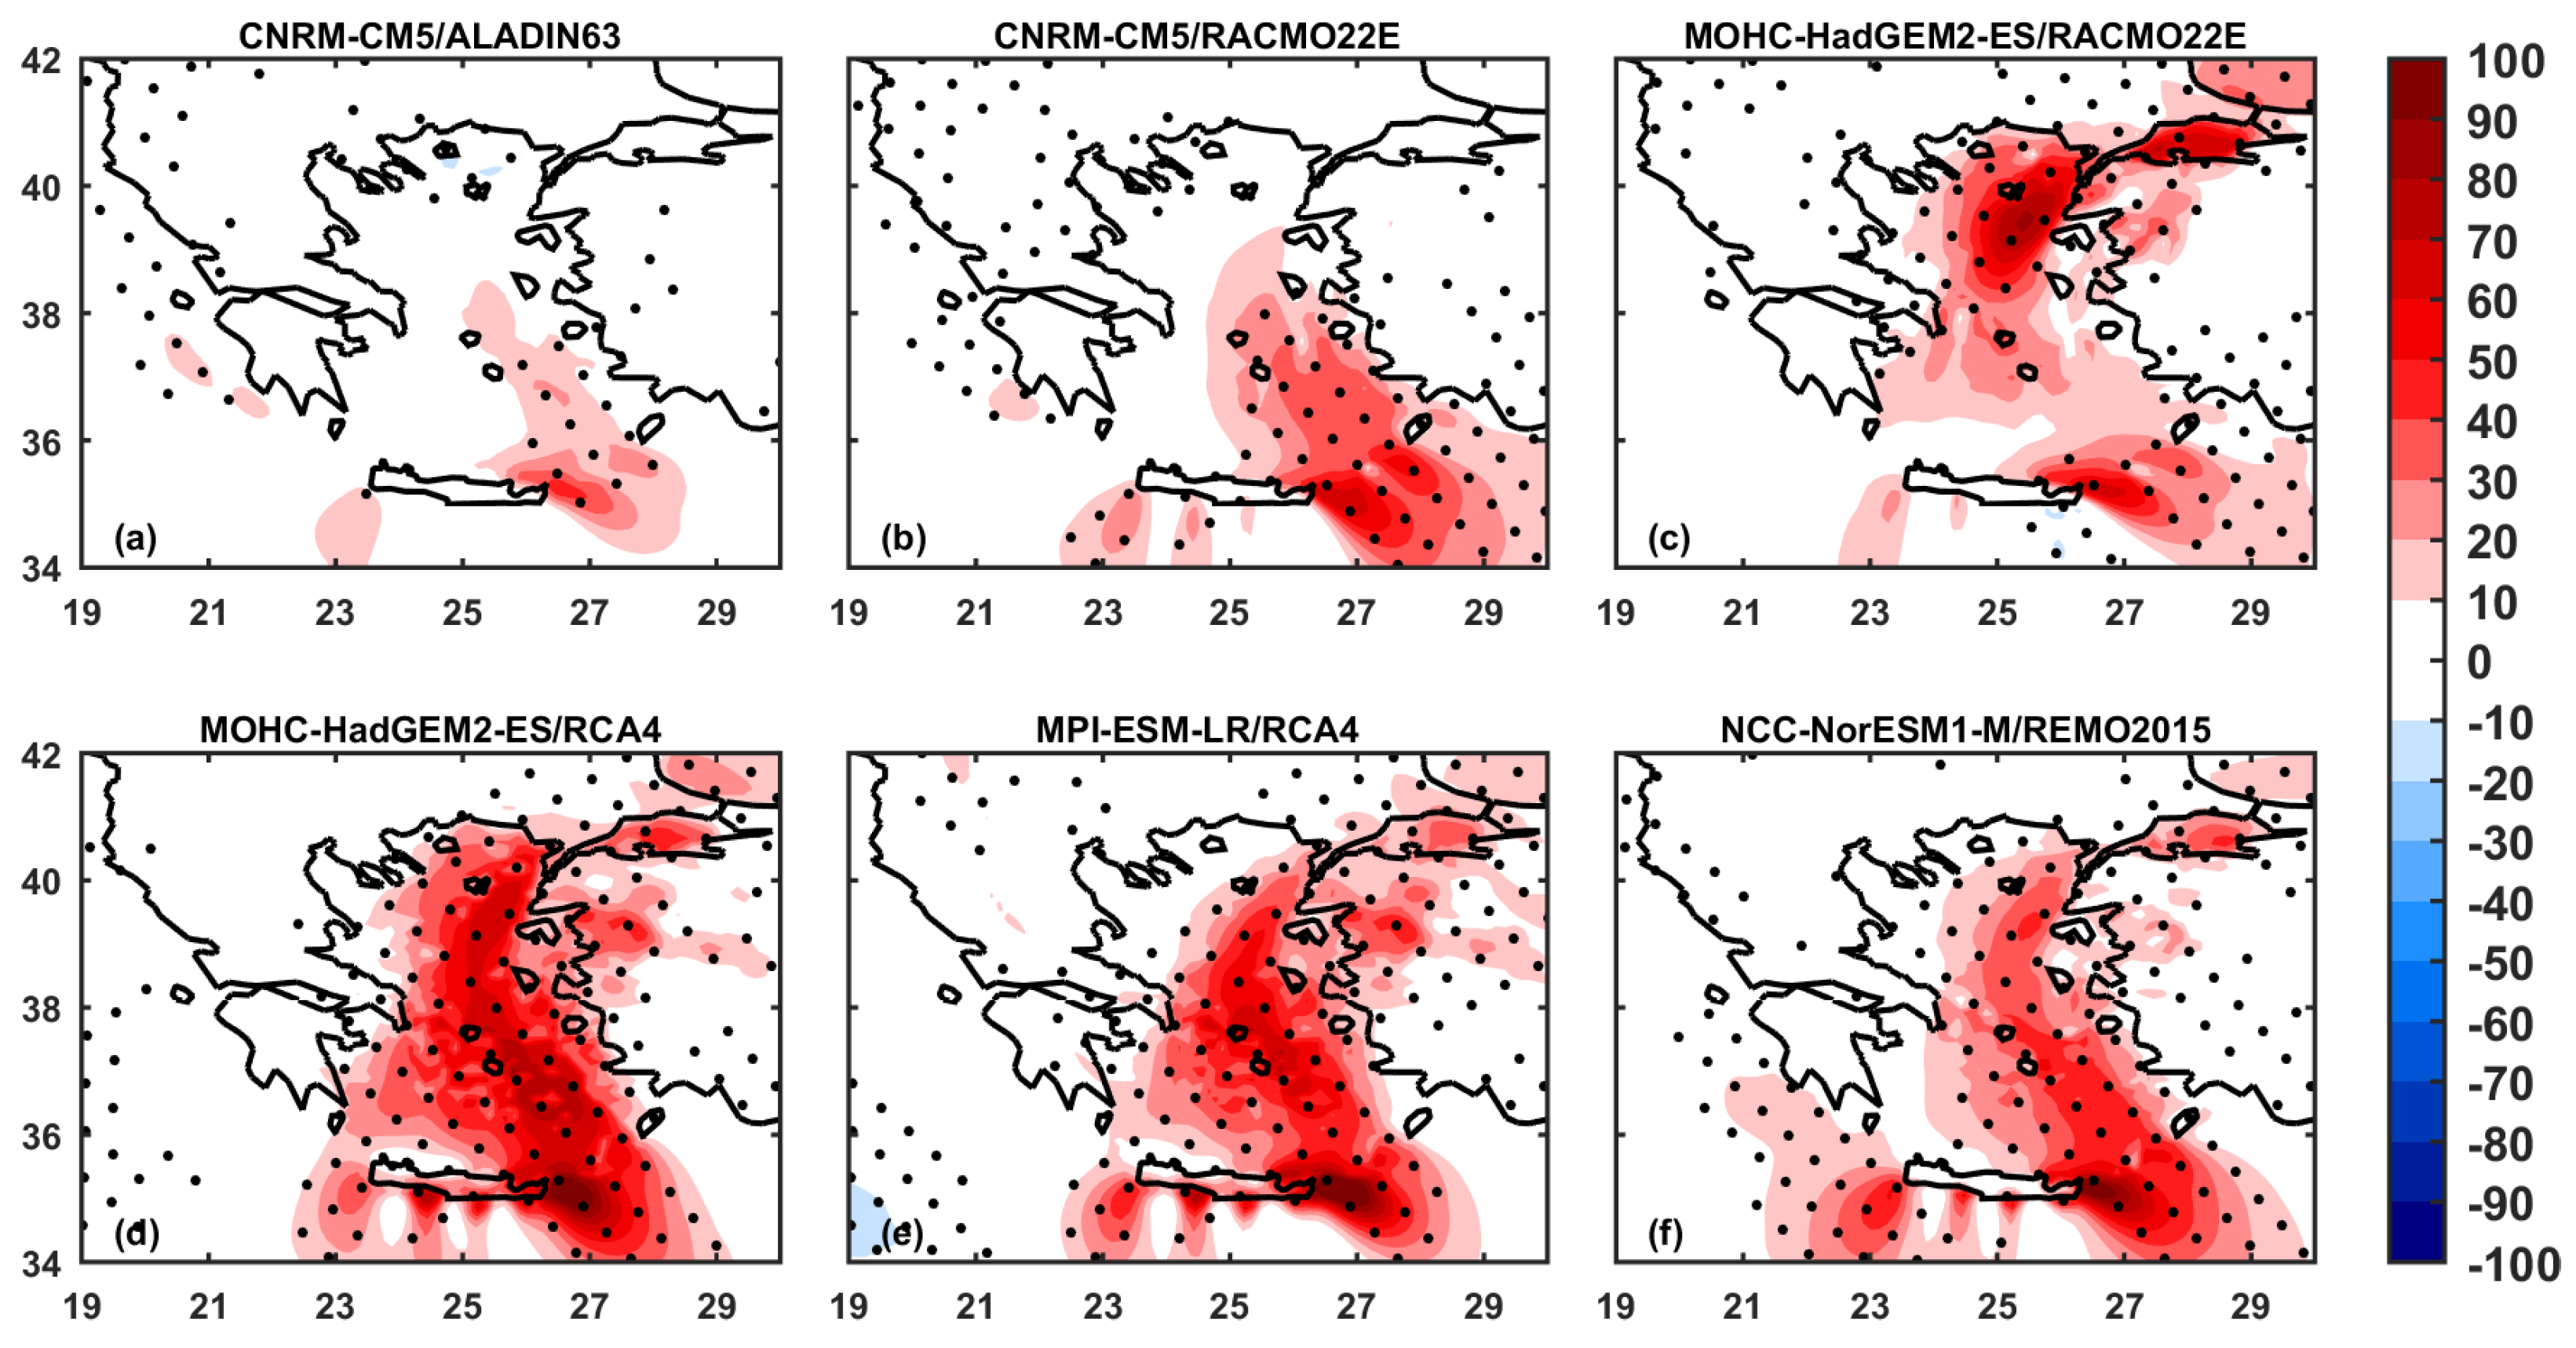
3.2. WEP Projected Changes

The calculations of the mean WEP differences between the future periods and the Ref. period show that the WEP is maximized mainly during the last period of the 21st century (F3, 2070–2099). This study focuses on the investigation of WEP changes between the F3 period and the reference historical period (Ref., 1970–2005). The averaged WEP over the four selected regions shows that WEP increases over the Aegean Sea. Figure 2 shows the composite mean differences between the future (F3 according to rcp4.5) and Ref. periods. All model simulations show an increase in WEP over the southeastern Aegean area from 10 to 80 W/m2 (locally) (Figure 2). The maximum increases are shown over the region of the southeastern Aegean (east of Crete Island). Additionally, four out of six model simulations show a statistically significant increase in WEP over the eastern region of the central Aegean (ranging between 10 to 50 W/m2). For the region of northeast Aegean, two out of six model simulations show an increase in WEP that ranges between 20 to 50 W/m2. Figure 3 shows the same analysis as Figure 2 but for the extreme scenario (rcp8.5). The findings show the same pattern but with increased WEP over the study areas of the Aegean basin as compared to the results that were previously presented (scenario rcp8.5 in Figure 2. In other words, the maximum changes in WEP are presented according to the rcp8.5 scenario. The WEP increases seem to be identified over an axis from north Greece (in Chalkidiki) to the southeastern Aegean (eastern of Crete Island) where the maximum WEP is over three centers for both the moderate and extreme scenarios (Figure 2 and Figure 3). In particular, for the rcp8.5 scenario, the average WEP differences (between the future period from 2070 to 2099 and the Ref. period) over the study area show that all model simulations present increased WEP (Table 2). Namely, the relative WEP differences between F3 (rcp8.5) and the Ref. period with reference to the Ref. period ( F 3 R e f . R e f . % ) are about 14%, 20%, 20%, 40%, 40% and 27% for CNRM-CM5_ALADIN63, CNRM-CM5_RACMO22E, MOHC-HadGEM2-ES_RACMO22E, MOHC-HadGEM2-ES_RCA4, MPI-ESM-LR_RCA4 and NCC-NorESM1-M_REMO2015, respectively. In examining each of the study areas (cAeg, NAeg, SEAeg and SWAeg), the WEP increases (with statistical significance) during the future period (F3 according rcp8.5 scenario) compared to the Ref. period in four out of six model simulations for the northeast Aegean (from 28 to 67 W/m2), in three out of six simulations for the central Aegean region (from 39 to 71 W/m2) and in one out of six model simulations for the southwest region (about 18 W/m2), respectively. The maximum changes are presented over the southeastern Aegean area where all model simulations show statistically significant increases from 33 to 100 W/m2 (Table 2).

4. Discussion

The analysis of EURO-CORDEX data shows that the WEP ranges from ~50 W/m2 to ~600 W/m2 over the Aegean area. The maximum WEP is shown over the southeastern Aegean. These findings are in line with the analysis of Katopodis et al. [16], where they have shown that the mean WEP is about 500 W/m2 and locally exceeds the 700 W/m2 for the Aegean area. Additionally, Kozyrakis et al. [20], using ERA5-WRF averaging 40 years of recent historical period, have shown that the maximum WEP over the Aegean basin is presented over the southeastern Aegean.
Regarding future WEP changes, all model simulations project an increase in WEP over the Aegean basin during the future period for both the moderate and extreme scenarios. The maximum increase is shown in the southeastern and central area of the Aegean Sea according to the extreme scenario. The findings are in agreement with results from previous studies that have analyzed model simulation results (GCMs and RCMs), reanalysis, observation and satellite data [16,17,18,19,20]. In the Aegean, the intense wind speed (mainly during the summer period where the Etesian wind regime is the dominant characteristic of Aegean low-tropospheric circulation [9,27]) and the increased need for energy due to high tourist activity [28] indicate the need for sustainable alternatives in the energy sector. The projected WEP could provide a green and sustainable solution for further penetration of RESs in the electrification system of Islandic Greek regions. Furthermore, the high WEP of the Aegean in combination with the low variability of wind speed act as beneficial conditions for offshore wind energy generation [21]. These elements, in combination with the advantages of offshore wind power technology could provide economically feasible and environmentally sustainable solutions for the energy sector of the eastern Mediterranean [18]. Finally, further investigation into wind energy, particularly involving combining different datasets (such as model simulations, satellite and observation data at high spatiotemporal resolutions), could increase the confidence of results regarding the calculated WEP. Additionally, further improvement of model schemes to reproduce atmospheric circulation features and to capture the variability of wind speed will contribute to an increase in the confidence regarding the investigation of future WEP changes over the Aegean while decreasing the limitations (such as wind speed at different turbine heights, high multi-model variability, etc.) [17]. These elements could contribute to the mobilization of the stakeholders from the 4th Helix to further accelerate green transition actions throughout regional-based ecosystems and other areas. The synchronous promotion of the scientific research, technology and applications in the wind energy sector will illuminate the prospects and challenges for the supply chain, providing a healthy environment for sustainable growth [29].

5. Conclusions

This study investigated the projections of wind energy potential (WEP) over the Aegean basin using state-of-the-art regional climate model (RCM) simulations that are available in the frame of the EURO-CORDEX project. The maximum averaged mean WEP for the historical base period (1970 to 2005) shows that the maximum WEP is over the northeastern, central and southeastern Aegean Sea. Regarding the future period, in all cases, the projections (both for rcp4.5 and rcp8.5) show an increase in WEP with reference to the recent past historical (base) period from 1970 to 2005. Furthermore, the maximum changes are identified as being in the last period of the 21st century as compared to the base historical period. In particular, the RCMs show positive changes from 10% to 26% for the rcp4.6 scenario and from 13% to 40% for the rcp8.5 scenario, respectively. The first area is located in the northeastern Aegean, the second area is located in the central Aegean and the third area is located in the southeastern Aegean. In particular, focusing on the extreme scenario, the maximum increase in WEP is present in the southeastern Aegean (the WEP increases from 33 W/m2 to 100 W/m2). In the central Aegean, the WEP increases from 39 W/m2 to 71 W/m2 and the WEP increases in the north Aegean from 28 W/m2 to 67 W/m2. The southwestern Aegean, in general, shows insignificant positive changes in WEP (only one model simulation shows a statistically significant increase of about 18 W/m2).

Author Contributions

Conceptualization, I.L. and K.T.; methodology, I.L.; software, I.L.; validation, I.L.; formal analysis, I.L.; investigation, I.L.; resources, I.L.; data curation, I.L.; writing—original draft preparation, I.L.; writing—review and editing, I.L., K.T. and D.M.; visualization, I.L.; supervision, K.T. and D.M.; project administration, K.T. and D.M.; funding acquisition, D.M. All authors have read and agreed to the published version of the manuscript.

Funding

This research received no external funding.

Institutional Review Board Statement

Not applicable.

Informed Consent Statement

Not applicable.

Data Availability Statement

Data were obtained from https://esgf-data.dkrz.de/search/cordex-dkrz/ (accessed on 15 February 2022).

Acknowledgments

We would like to acknowledge all institutes and efforts that have contributed to EURO-CORDEX. Additionally, we would like to thank the ESGF nodes for the distribution and storage of EURO-CORDEX data. The authors would like to thank the anonymous reviewer for his/her comments and suggestions that further improved this study. Finally, the authors would like to thank Ourania Hassiltzoglou for the English language editing.

Conflicts of Interest

The authors declare no conflicts of interest.

References

  1. Osman, A.I.; Chen, L.; Yang, M.; Msigwa, G.; Farghali, M.; Fawzy, S.; Rooney, D.W.; Yap, P.-S. Cost, environmental impact, and resilience of renewable energy under a changing climate: A review. Environ. Chem. Lett. 2023, 21, 741–764. [Google Scholar] [CrossRef]
  2. United Nations—Climate Actions. Available online: https://www.un.org/en/climatechange/raising-ambition/renewable-energy (accessed on 17 September 2024).
  3. Mohammadia, K.; Alavib, O.; Mostafaeipourc, A.; Goudarzid, N.; Jalilvand, M. Assessing different parameters estimation methods of Weibull distribution to compute wind power density. Energy Convers. Manag. 2016, 108, 322–335. [Google Scholar] [CrossRef]
  4. European Commission—Energy, Climate Change, Environment. Available online: https://energy.ec.europa.eu/topics/renewable-energy_en (accessed on 19 September 2024).
  5. Wolf, S.; Teitge, J.; Mielke, J.; Schütze, F.; Jaeger, C. The European Green Deal—More Than Climate Neutrality. Intereconomics 2021, 56, 99–107. [Google Scholar] [CrossRef]
  6. European Commission—EU Regional and Urban Development. Available online: https://ec.europa.eu/regional_policy/policy/communities-and-networks/s3-community-of-practice/about_en (accessed on 15 September 2024).
  7. Giorgi, F. Climate change hot-spots. Geophys. Res. Lett. 2006, 33, L08707. [Google Scholar] [CrossRef]
  8. Cos, J.; Doblas-Reyes, F.; Jury, M.; Marcos, R.; Bretonnière, P.-A.; Samsó, M. The Mediterranean climate change hotspot in the CMIP5 and CMIP6 projections. Earth Syst. Dynam. 2022, 13, 321–340. [Google Scholar] [CrossRef]
  9. Logothetis, I.; Tourpali, K.; Melas, D. Projected Changes in Etesians Regime over Eastern Mediterranean in CMIP6 Simulations According to SSP2-4.5 and SSP5-8.5 Scenarios. Environ. Sci. Proc. 2023, 27, 4. [Google Scholar] [CrossRef]
  10. Koletsis, I.; Kotroni, V.; Lagouvardos, K.; Soukissian, T. Assessment of offshore wind speed and power potential over the Mediterranean and the Black Seas under future climate changes. Renew. Sustain. Energy Rev. 2016, 60, 234–245. [Google Scholar] [CrossRef]
  11. Gormüs, T.; Aydogan, B.; Ayat, B. Offshore wind power potential analysis for different wind turbines in the Mediterranean Region, 1959–2020. Energy Convers. Manag. 2022, 274, 116470. [Google Scholar] [CrossRef]
  12. Majidi Nezhad, M.; Groppi, D.; Marzialetti, P.; Fusilli, L.; Laneve, G.; Cumo, F.; Astiaso Garcia, D. Wind energy potential analysis using Sentinel-1 satellite: A review and a case study on Mediterranean islands. Renew. Sustain. Energy Rev. 2019, 109, 499–513. [Google Scholar] [CrossRef]
  13. Martinez, A.; Iglesias, G. Multi-parameter analysis and mapping of the levelised cost of energy from floating offshore wind in the Mediterranean Sea. Energy Convers. Manag. 2021, 243, 114416. [Google Scholar] [CrossRef]
  14. Moemken, J.; Reyers, M.; Feldmann, H.; Pinto, J.G. Future changes of wind speed and wind energy potentials in EURO-CORDEX ensemble simulations. J. Geophys. Res. Atmos. 2018, 123, 6373–6389. [Google Scholar] [CrossRef]
  15. Alvarez, I.; Lorenzo, M.N. Changes in offshore wind power potential over the Mediterranean Sea using CORDEX projections. Reg. Environ. Change 2019, 19, 79–88. [Google Scholar] [CrossRef]
  16. Katopodis, T.; Markantonis, I.; Vlachogiannis, D.; Politi, N.; Sfetsos, A. Assessing climate change impacts on wind characteristics in Greece through high resolution regional climate modelling. Renew. Energy 2021, 179, 427–444. [Google Scholar] [CrossRef]
  17. Tobin, I.; Jerez, S.; Vautard, R.; Thais, F.; Meijgaard, E.; Prein, A.; Déqué, M.; Kotlarski, S.; Maule, C.F.; Nikulin, G.; et al. Climate change impacts on the power generation potential of a European mid-century wind farms scenario. Environ. Res. Lett. 2016, 11, 034013. [Google Scholar] [CrossRef]
  18. Delagrammatikas, G.; Roukanas, S. Offshore Wind Farm in the Southeast Aegean Sea and Energy Security. Energies 2023, 16, 5208. [Google Scholar] [CrossRef]
  19. Ganea, D.; Amortila, V.; Mereuta, E.; Rusu, E. A Joint Evaluation of the Wind and Wave Energy Resources Close to the Greek Islands. Sustainability 2017, 9, 1025. [Google Scholar] [CrossRef]
  20. Kozyrakis, G.V.; Condaxakis, C.; Parasyris, A.; Kampanis, N.A. Wind Resource Assessment over the Hellenic Seas Using Dynamical Downscaling Techniques and Meteorological Station Observations. Energies 2023, 16, 5965. [Google Scholar] [CrossRef]
  21. Soukissian, T.; Papadopoulos, A.; Skrimizeas, P.; Karathanasi, F.; Axaopoulos, P.; Avgoustoglou, E.; Kyriakidou, H.; Tsalis, C.; Voudouri, A.; Gofa, F.; et al. Assessment of offshore wind power potential in the Aegean and Ionian Seas based on high-resolution hindcast model results. AIMS Energy 2017, 5, 268–289. [Google Scholar] [CrossRef]
  22. Garrido-Perez, J.M.; Ordóñez, C.; Barriopedro, D.; García-Herrera, R.; Paredes, D. Impact of weather regimes on wind power variability in western Europe. Appl. Energy 2020, 264, 114731. [Google Scholar] [CrossRef]
  23. Petersen, J.D.; Eggert, J.; Eggert, B.; Alias, A.; Christensen, O.B.; Bouwer, L.M.; Braun, A.; Colette, A.; Déqué, M.; Georgievski, G.; et al. EURO-CORDEX: New high-resolution climate change projections for European impact research. Reg. Environ. Change 2014, 14, 563–578. [Google Scholar] [CrossRef]
  24. Hoogwijk, M.; DeVries, B.; Turkenburg, W. Assessment of the global and regional geographical, technical and economic potential of on shore wind energy. Energy Econ 2004, 26, 889–919. [Google Scholar] [CrossRef]
  25. Hulio, Z.H. Assessment of Wind Characteristics and Wind Power Potential of Gharo, Pakistan. J. Renew. Energy 2021, 2021, 8960190. [Google Scholar] [CrossRef]
  26. Hulio, H.; Jiang, W. An assessment of effects of non-stationary operational conditions on wind turbine under different wind scenario. J. Eng. Des. Technol. 2019, 18, 102–121. [Google Scholar] [CrossRef]
  27. Logothetis, I.; Tourpali, K.; Misios, S.; Zanis, P. Etesians and the summer circulation over East Mediterranean in coupled Model Intercomparison Project phase 5 simulations: Connections to the Indian summer monsoon. Int. J. Climatol. 2020, 40, 1118–1131. [Google Scholar] [CrossRef]
  28. Eurostat. Available online: https://ec.europa.eu/eurostat/statistics-explained/index.php?title=Seasonality_in_the_tourist_accommodation_sector&oldid=633241 (accessed on 18 September 2024).
  29. HWEA—Hellenic Wind Energy Association. Available online: https://eletaen.gr/en/identity/# (accessed on 19 September 2024).
Figure 1. Composite mean of WEP during the historical period from 1970 to 2005 for each one of the RCM simulations (af). The blue, green, magenta and yellow boxes indicate the southwestern, central, northeastern and southeastern Aegean areas.
Engproc 87 00018 g001
Figure 2. Composite differences between the future period (F3: 2070–2099) according to the rcp4.5 scenario and the reference period (historical period: 1970–2005) for each one of the RCM simulations (af). The dots denote the statistically significant differences at the 95% level (Student’s t-test).
Engproc 87 00018 g002
Figure 3. Composite differences between the future period (F3: 2070–2099) according to the rcp8.5 scenario and the reference period (historical period: 1970–2005) for each one of the RCM simulations (af). The dots denote the statistically significant differences at the 95% level (Student’s t-test).
Engproc 87 00018 g003
Table 1. List of model simulations that are used in this study.
RCMDriving GCMExperimentHistorical
(1970–2005)
rcp4.5
(2010–2099)
rcp8.5
(2010–2099)
ALADIN63.v2CNRM.CNRM-CERFACS-CNRM-CM5r1i1p1×××
RACMO22E.v2CNRM.CNRM-CERFACS-CNRM-CM5r1i1p1×××
RACMO22E.v2KNMI.MOHC-HadGEM2-ESr1i1p1×××
RCA4.v1SMHI.MOHC-HadGEM2-ESr1i1p1×××
RCA4.v1SMHI.MPI-M-MPI-ESM-LRr1i1p1×××
REMO2015.v1GERICS. NCC-NorESM1-Mr1i1p1×××
Table 2. Mean differences of WEP averaged over the southwest, central, northeast and southeast Aegean regions between F3 (according rcp8.5 scenario) and the historical reference period. The star shows the statistically significant differences at the 95% level.
RCMcAegNAegSEAegSWAeg
CNRM-CM5_ALADIN638.821.8032.72 *8.63
CNRM-CM5_RACMO22E23.560.7455.07 *2.10
MOHC-HadGEM2-ES_RACMO22E39.1767.03 *30.56 *11.22
MOHC-HadGEM2-ES_RCA471.34 *58.57 *100.44 *17.84 *
MPI-ESM-LR_RCA465.34 *35.89 *73.91 *11.57
NCC-NorESM1-M_REMO201538.75 *28.22 *69.34 *6.25
Disclaimer/Publisher’s Note: The statements, opinions and data contained in all publications are solely those of the individual author(s) and contributor(s) and not of MDPI and/or the editor(s). MDPI and/or the editor(s) disclaim responsibility for any injury to people or property resulting from any ideas, methods, instructions or products referred to in the content.

