Proceeding Paper

Multiple Linear Regression-Based Correlation Analysis of Various Critical Weather Factors and Solar Energy Generation in Smart Homes †

by
Purna Prakash Kasaraneni
1,
Yellapragada Venkata Pavan Kumar
2,* and
Gogulamudi Pradeep Reddy
3
1
Department of Computer Science and Engineering, Siddhartha Academy of Higher Education, Deemed to Be University, Vijayawāda 520007, Andhra Pradesh, India
2
School of Electronics Engineering, VIT-AP University, Amaravati 522241, Andhra Pradesh, India
3
Department of Information and Communication Technology, Manipal Institute of Technology, Manipal Academy of Higher Education, Manipal 576104, Karnataka, India
*
Author to whom correspondence should be addressed.
Presented at the 5th International Electronic Conference on Applied Sciences (ASEC2024), 4–6 December 2024; Available online: https://sciforum.net/paper/view/20924.
Eng. Proc. 2025, 87(1), 106; https://doi.org/10.3390/engproc2025087106
Published: 11 September 2025
(This article belongs to the Proceedings of The 5th International Electronic Conference on Applied Sciences)

Abstract

The smart home concept, transforming traditional homes into smart homes thanks to technological advancements, is widespread around the world. In addition, energy consumers are also becoming energy producers by adding renewable energy sources, namely solar, wind, etc., to their homes along with traditional energy sources. However, intermittent weather conditions impact the power generation of renewable sources. Hence, there is a need to understand the correlation between several weather parameters and power generation. Traditional statistical methods such as Pearson, and Spearman, Kendall’s Tau, and Phi correlation coefficients are available but are limited to only two variables. Instead, multiple linear regression (MLR) offers multivariate analysis. Thus, this paper employs MLR to analyze the correlation between weather conditions such as temperature, apparent temperature, visibility, humidity, pressure, wind speed, dew point, precipitation, and power generation in kW. All the weather conditions are independent variables, and the generated power is a dependent variable. The key objective is to investigate the significant predictors and their impact on power generation. To implement this, a recent smart home dataset titled “Smart Home Dataset with Weather Information” that provides the required information was downloaded from Kaggle. This dataset contains 32 variables and 503,910 observations. The whole dataset with the considered variables (1 dependent variable and 11 independent variables) is utilized to implement the proposed correlation analysis. A regression model is developed to find the correlation between the parameters mentioned above in the dataset, and the multicollinearity among the independent variables is presented using the variance inflation factor (VIF). If the VIF value is more than 10, it represents high multicollinearity. The results showcase that those variables, such as temperature, humidity, apparent_temperature, and dew_point, produce VIF values of 296.67, 37.35, 126.29, and 152.15, respectively, and are thereby considered critical weather parameters that significantly influence solar energy generation. This aids in better generation and load management planning in smart homes.

1. Introduction

The smart home culture is widespread around the world [1]. With technological advances, people are transforming their homes into smart homes. In addition, they are becoming energy producers by adding renewable energy sources, namely solar, wind, etc., as the decrease in the renewable energy device prices [2]. Power generated by renewable energy sources enables them to utilize it and sell excess power to utilities. Though there are several advantages of these renewable energy sources, the intermittency in weather conditions has a great impact on power generation. This intermittency can lead to fluctuations in power generation and further result in grid stability issues when the energy producers unpredictably feed the power to the grid in large numbers.
Hence, understanding the correlation between weather conditions helps with better power generation and management. The significance of the correlation analysis shows its implementation in several fields. Thus, this paper proposes multiple linear regression (MLR)-based correlation analysis of various critical weather factors and solar energy generation in smart homes. The MLR is a statistical technique used to model the relationship between one dependent variable (here, solar energy generation) and multiple independent variables (critical weather factors such as temperature, humidity, solar irradiance, wind speed, etc.). It allows quantifying the effect of each weather factor while controlling for others. Various works in the literature that discuss the importance of correlation analysis are discussed in the following section.
The remaining part of the manuscript is systematized as follows. Section 2 discusses the literature review, Section 3 discusses the materials and proposed method in detail, Section 4 presents the results and discussion, and Section 5 discusses the conclusions drawn from the proposed work.

2. Literature Review

The literature on correlation analysis applied in several fields and in various applications is discussed in Table 1.
From the abovementioned literature, it is understood that the correlation analysis was applied to various applications such as healthcare, agriculture, environment, and energy. Further, the comparison of weather parameters is limited to energy systems, wind farms, and solar farms. To the authors’ best knowledge, no similar work on finding the correlation between weather conditions and solar energy generation in smart homes has been conducted. On this inspiration, this paper proposes a multiple linear regression-based correlation analysis of critical weather parameters that impact solar energy generation in smart homes. The key contribution of this proposed work is to identify the critical weather parameters by implementing a data-driven approach using multiple linear regression and the variance inflation factor that offers a comprehensive analysis. This work can serve as a basis for utilities, energy planners, and policymakers to effectively plan power generation and load management, viz., real-time energy monitoring, forecast-based scheduling, and time-of-use pricing. This analysis further helps weather-based power forecasting, where renewable energy sources such as solar and wind highly rely on the weather.

3. Materials and Methods

To achieve the desired functionality, this work is implemented using R programming. The functions lm() and vif() are used to implement the multiple linear regression and the variance inflation factor, respectively. The lm() function is a part of the base R, and the vif() is a part of the “car” package. The vif() is a valuable function utilized in detecting multicollinearity. The workflow of the proposed methodology is discussed in Section 3.1, the description of the dataset is presented in Section 3.2, the rationale for implementing the multiple linear regression is presented in Section 3.3, multiple linear regression is discussed in Section 3.4, and the variance inflation factor is discussed in Section 3.5.

3.1. Workflow of the Proposed Methodology

The steps for realizing the proposed method are given in Figure 1, which are explained as follows.
The process starts with the reading of the dataset. Once the dataset is read, the data preparation and identification of the dependent and independent variables are to be performed. After variable selection, the implementation of an MLR model and the saving of output are to be performed. Now, the VIF method is to be applied to the output of the MLR model. After this, the VIF value of all the independent variables is to be checked. If the VIF value is <5, it specifies the acceptable level of multicollinearity. If the VIF value is >10, it indicates high multicollinearity, suggesting a potential issue. The variables with a VIF value of >10 are the critical weather parameters significantly impacting solar energy generation. The process will be stopped with the identification of critical weather parameters.

3.2. Dataset Description

The data used for the proposed work is the smart home dataset with weather information, obtained from Kaggle [29]. It comprises 32 variables and 503,910 observations. These 32 variables represent the timestamp, energy consumption of various appliances, and weather parameters. The primary focus of the proposed work is the correlation analysis of the weather parameters in the dataset. Hence, instead of using the whole dataset, the required variables, such as solar generation and weather parameters, are considered for implementation. The variables given in Table 2 represent the solar generation (1 dependent variable) and weather parameters (11 independent variables).

3.3. Rationale for Implementing Multiple Linear Regression

Multiple linear regression (MLR) assumes a linear relationship among the variables. However, this linear relationship may not hold between the weather parameters and power generation in the considered dataset. Hence, to check the applicability of MLR on this dataset, we implemented MLR and polynomial regression (PLR) and observed the R2 (R-squared) values to understand the performance. Usually, a higher R2 value represents the better performance of the method. By implementing the MLR method, the R2 value of 0.01498974 is achieved. Similarly, by implementing PLR, the R2 value of 0.01878164 is achieved. From these values, it is observed that PLR achieves a higher value than MLR, but the difference (0.0037919) between these two values is very small. In this case, it is suggested to proceed with the implementation of MLR due to its characteristics of simplicity and better interpretability than PLR. Further, it avoids overfitting. Hence, this proposed correlation analysis is implemented using MLR.

3.4. Multiple Linear Regression

MLR is a statistical technique and an extension of linear regression. It deals with many independent variables to estimate the output of a dependent variable. MLR is focused on understanding the correlation between the variables, which means how the various independent variables impact a dependent variable. MLR is implemented by using the lm() function, and the equation of the MLR is given in Equation (1).
y = β 0 + β 1 x 1 + β 2 x 2 + β 3 x 3 + + β n x n
where y represents the dependent variable that is to be estimated. x1, x2, x3, and xn represent the independent variables, which are predictors that represent the y value when all the independent variables are equal to zero. The working of MLR is given below.
The lm() function is primarily used for regression analysis to fit the linear models to the data. A model is built using the lm() function, which takes a dependent variable and multiple independent variables as input. This model will estimate the association between the independent and dependent variables.
The syntax of the regression model is as follows:
model ← lm(dependent variable ~ independent variable_1 + independent variable_2 + …+ independent variable_n)
The following is the model for the considered variables for the proposed work:
mlr_model ← lm(solar_gen ~ temperature + visibility + humidity + apparent_temperature + pressure + cloud_cover + wind_speed + wind_bearing + dew_point + precip_intensity + precip_probability, data = prepared_dataset)
The output of the lm() function will be an object that contains the coefficients for each independent variable, including statistics like the p-value, R-squared, and other metrics to assess the model’s performance.

3.5. Variance Inflation Factor

The existence of multicollinearity between the variables can impact the regression results, necessitating an understanding of the multicollinearity. Hence, a variance inflation factor (VIF) is measured that helps to observe the amount of multicollinearity in the regression analysis. This is realized using the vif() function and the VIF equation given in Equation (2).
V I F x i = 1 1 R i 2
where xi represents independent variables and Ri2 represents the R-squared value.
The working of VIF is discussed as follows. The vif() function takes the linear model’s output as the input (vif_valuesvif(mlr_model)). For each independent variable, it regresses on all the other independent variables. Further, it calculates the R2 value for these auxiliary regressions using Equation (2). The VIF values for each independent variable are calculated. The amount of multicollinearity is observed based on the VIF value.

4. Results and Discussion

The values of the regression coefficients are given in Table 3. These regression coefficients are rounded to four decimals for better understandability.
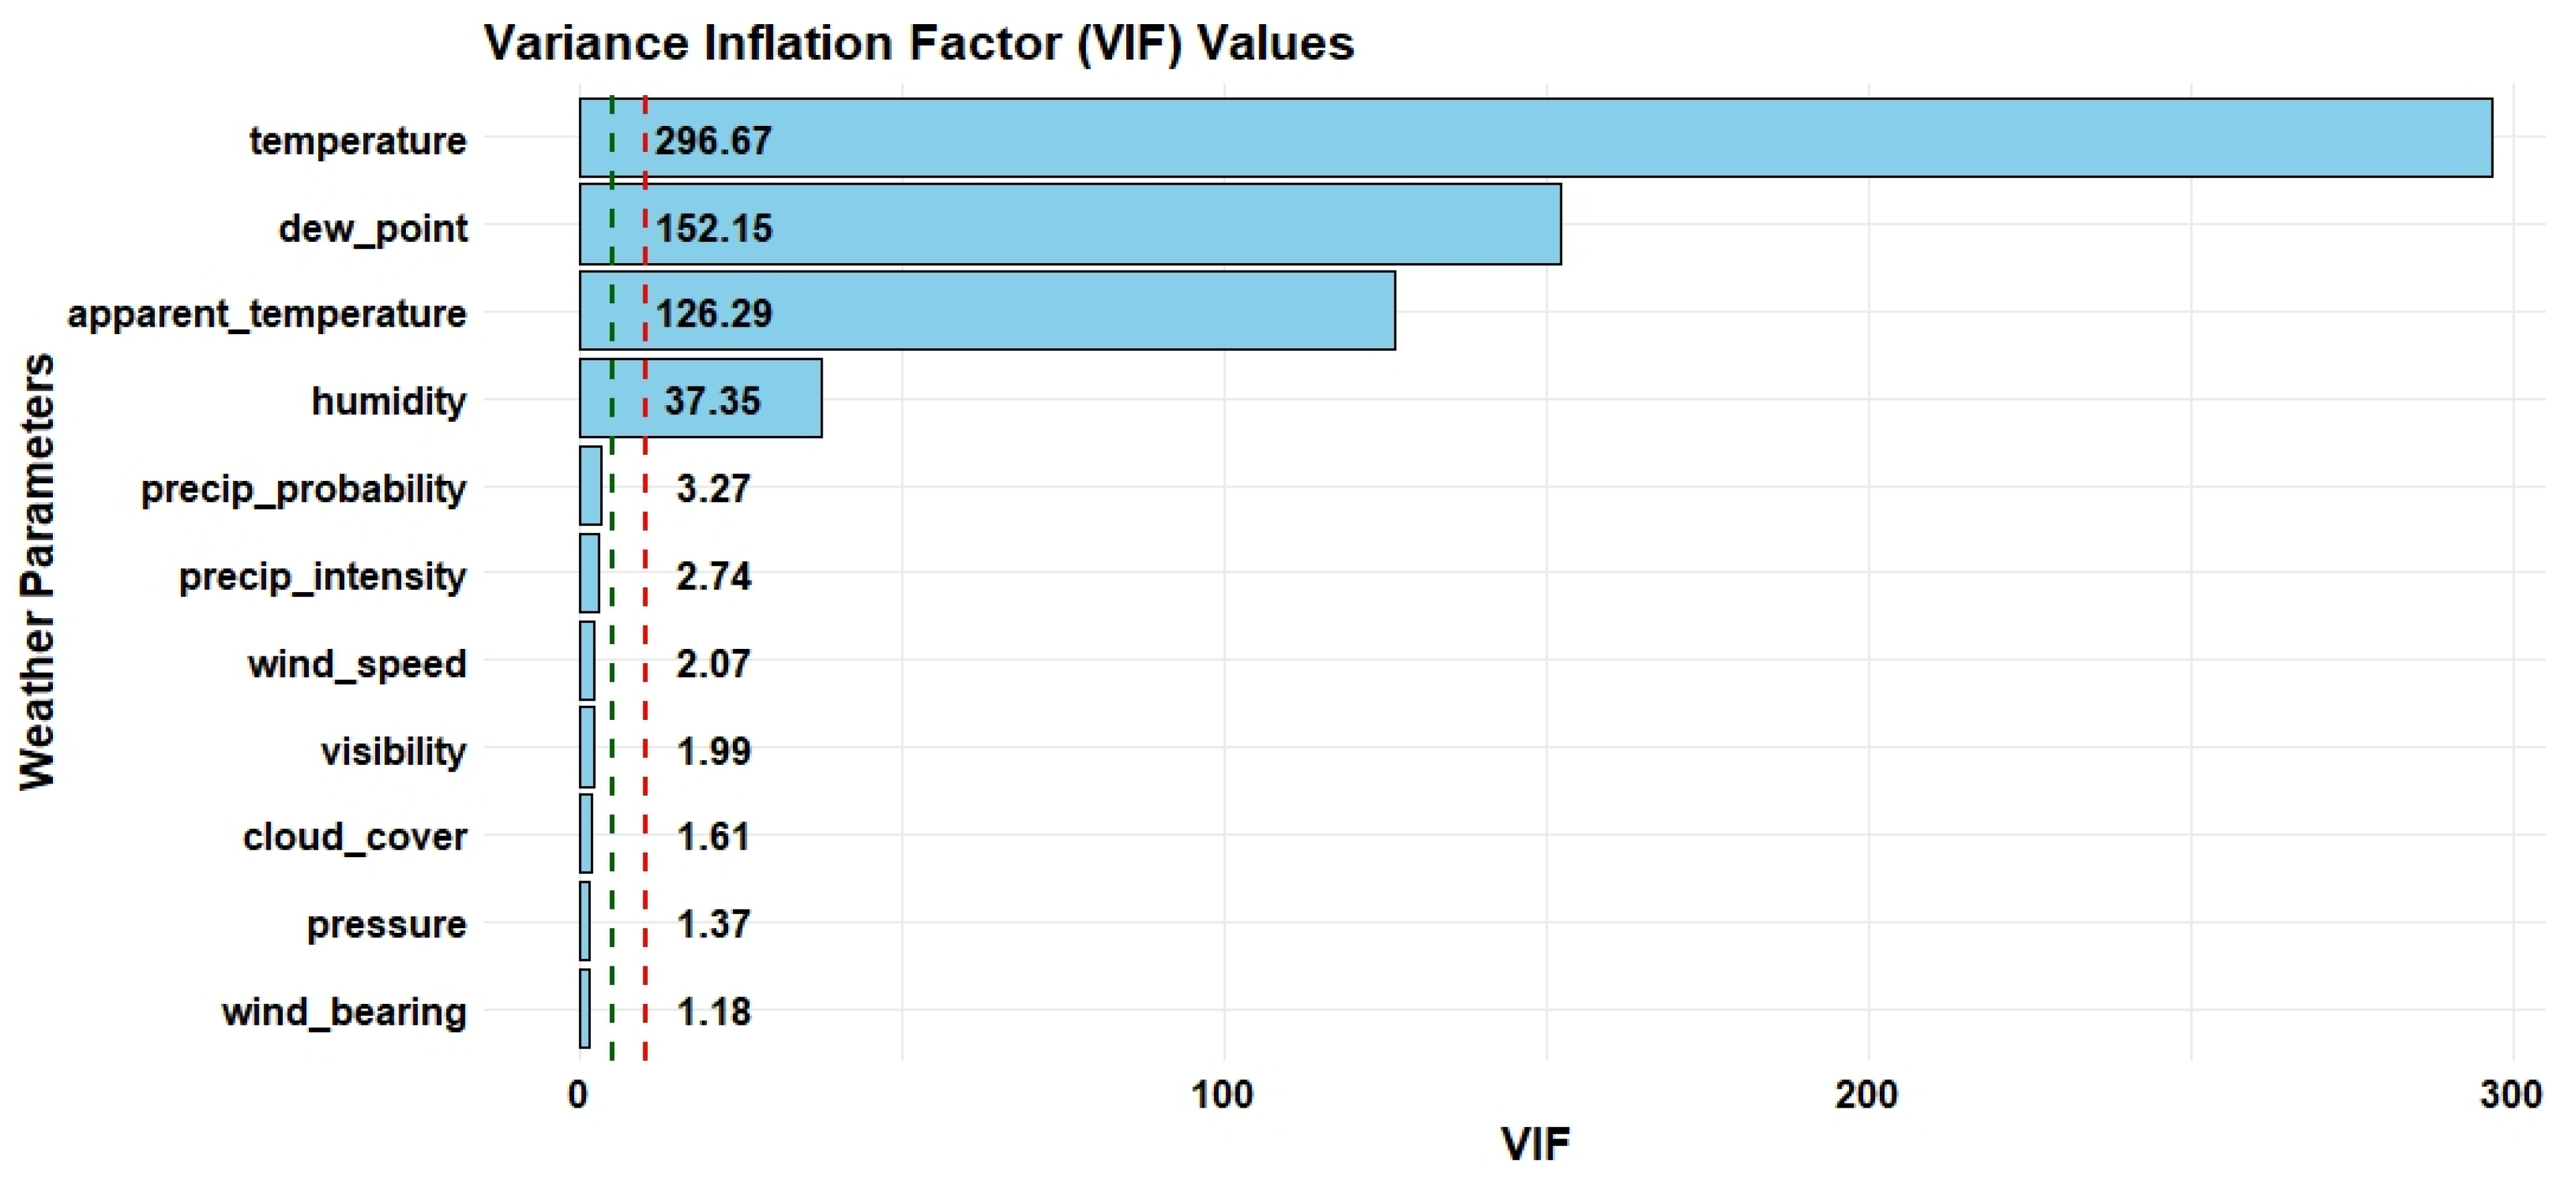
The VIF values of the weather parameters are shown in Figure 2. In this figure, each bar represents the VIF value of a weather parameter, and all VIF values are arranged in descending order for better readability. The threshold values of 5 and 10 for VIF values are represented with the green-colored and red-colored vertical dashed lines, respectively. A VIF value of <5 is an acceptable level of multicollinearity, and a VIF value of >10 indicates high multicollinearity. Further, the summary of VIF values of various weather parameters and their multicollinearity status is given in Table 4.
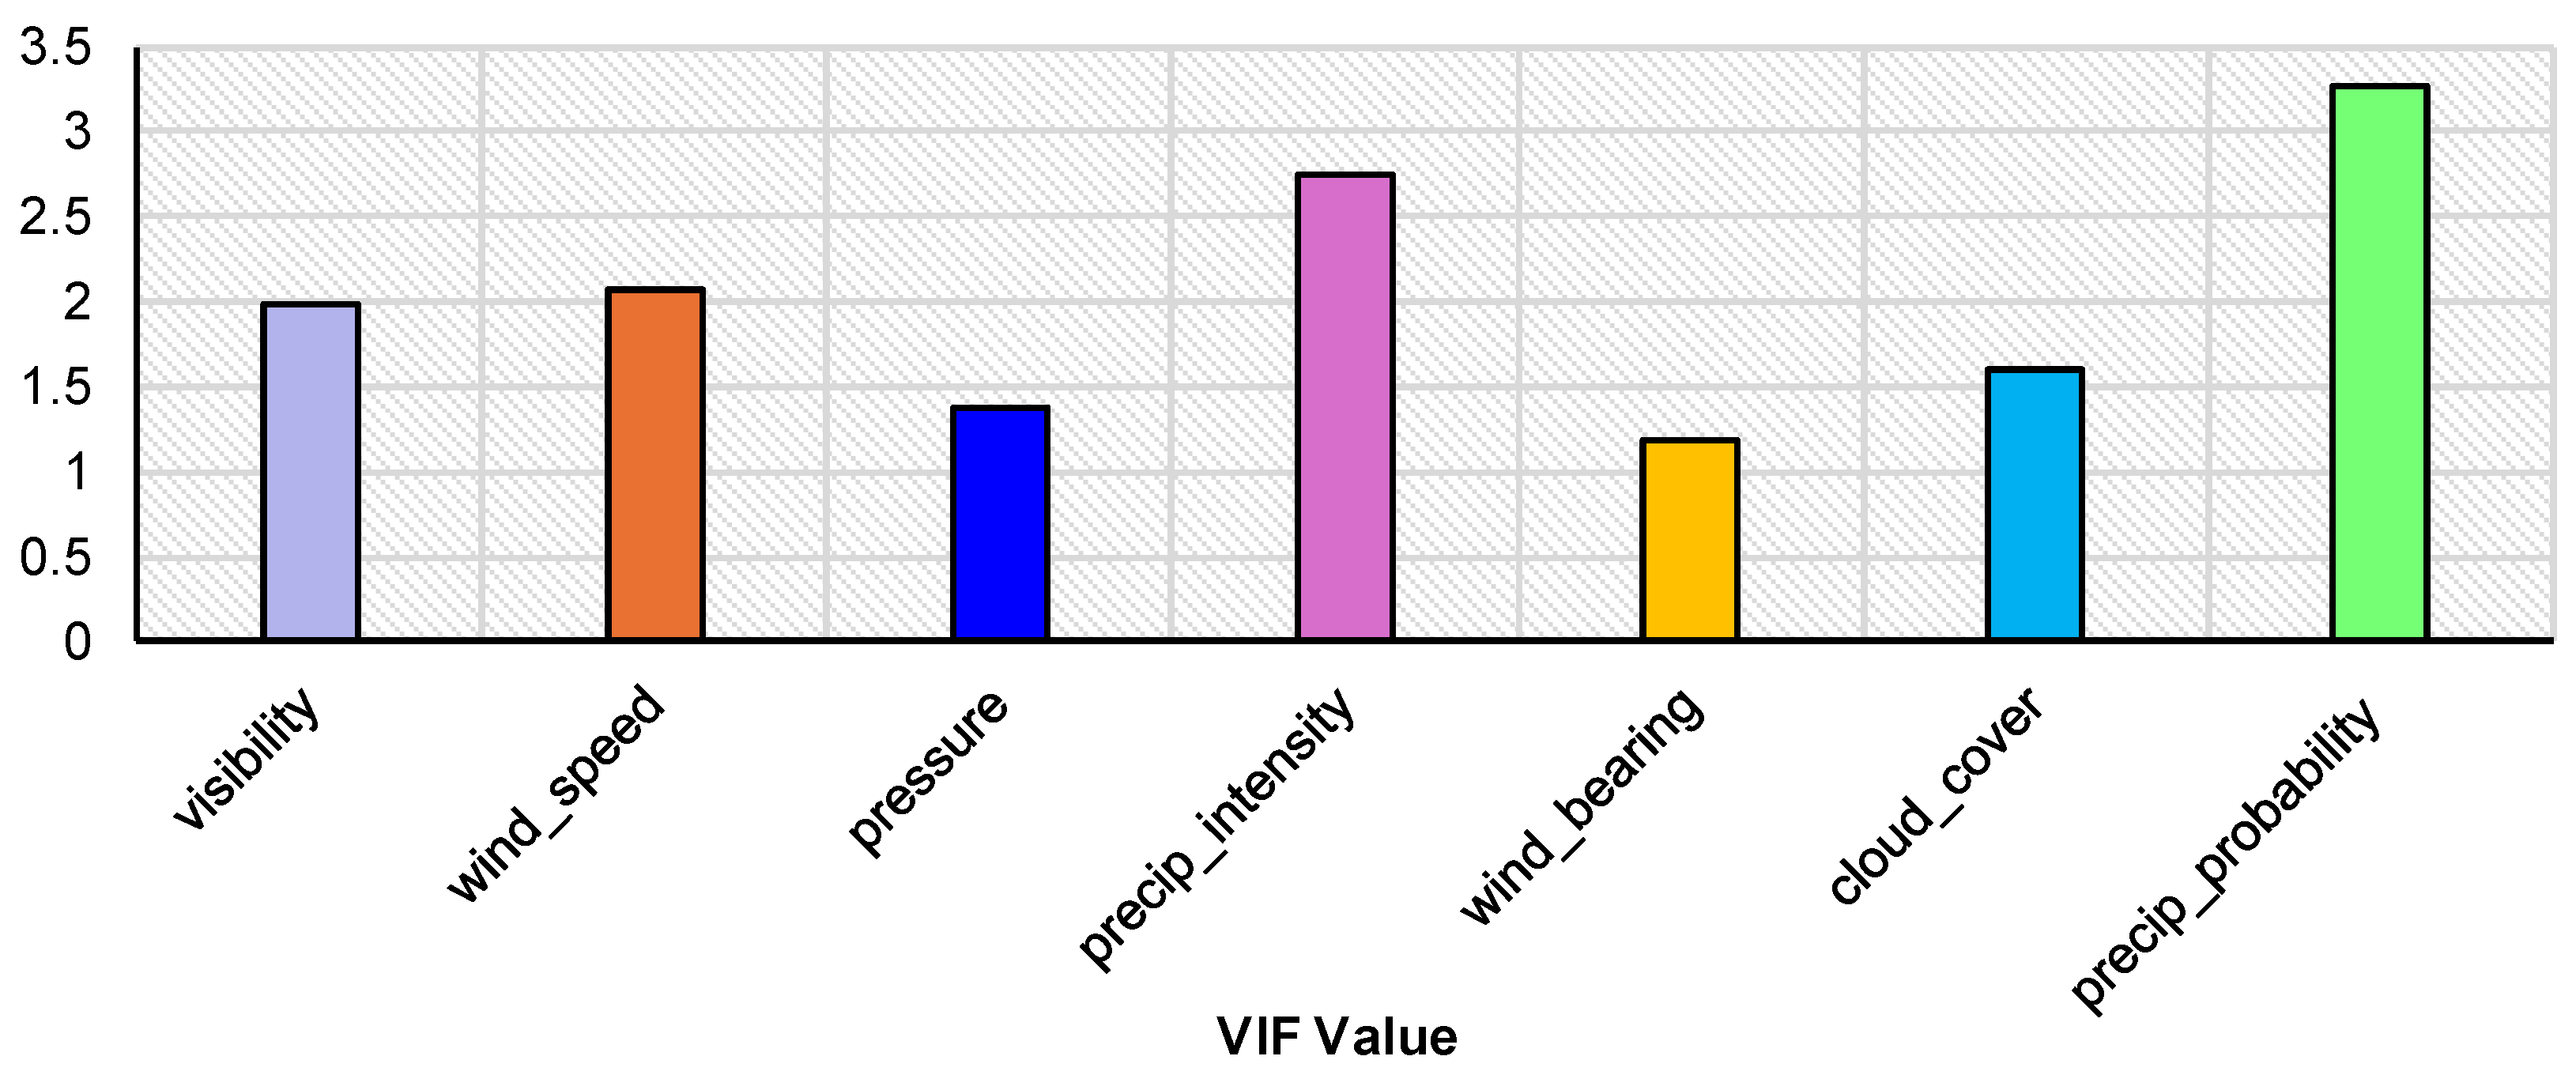
The critical and non-critical weather parameters are discussed below. The critical weather parameters are shown in Figure 3, and the non-critical weather parameters are shown in Figure 4. The plots in Figure 3 and Figure 4 showcase the VIF values of each weather parameter. The variables with a VIF value > 10 have high multicollinearity.
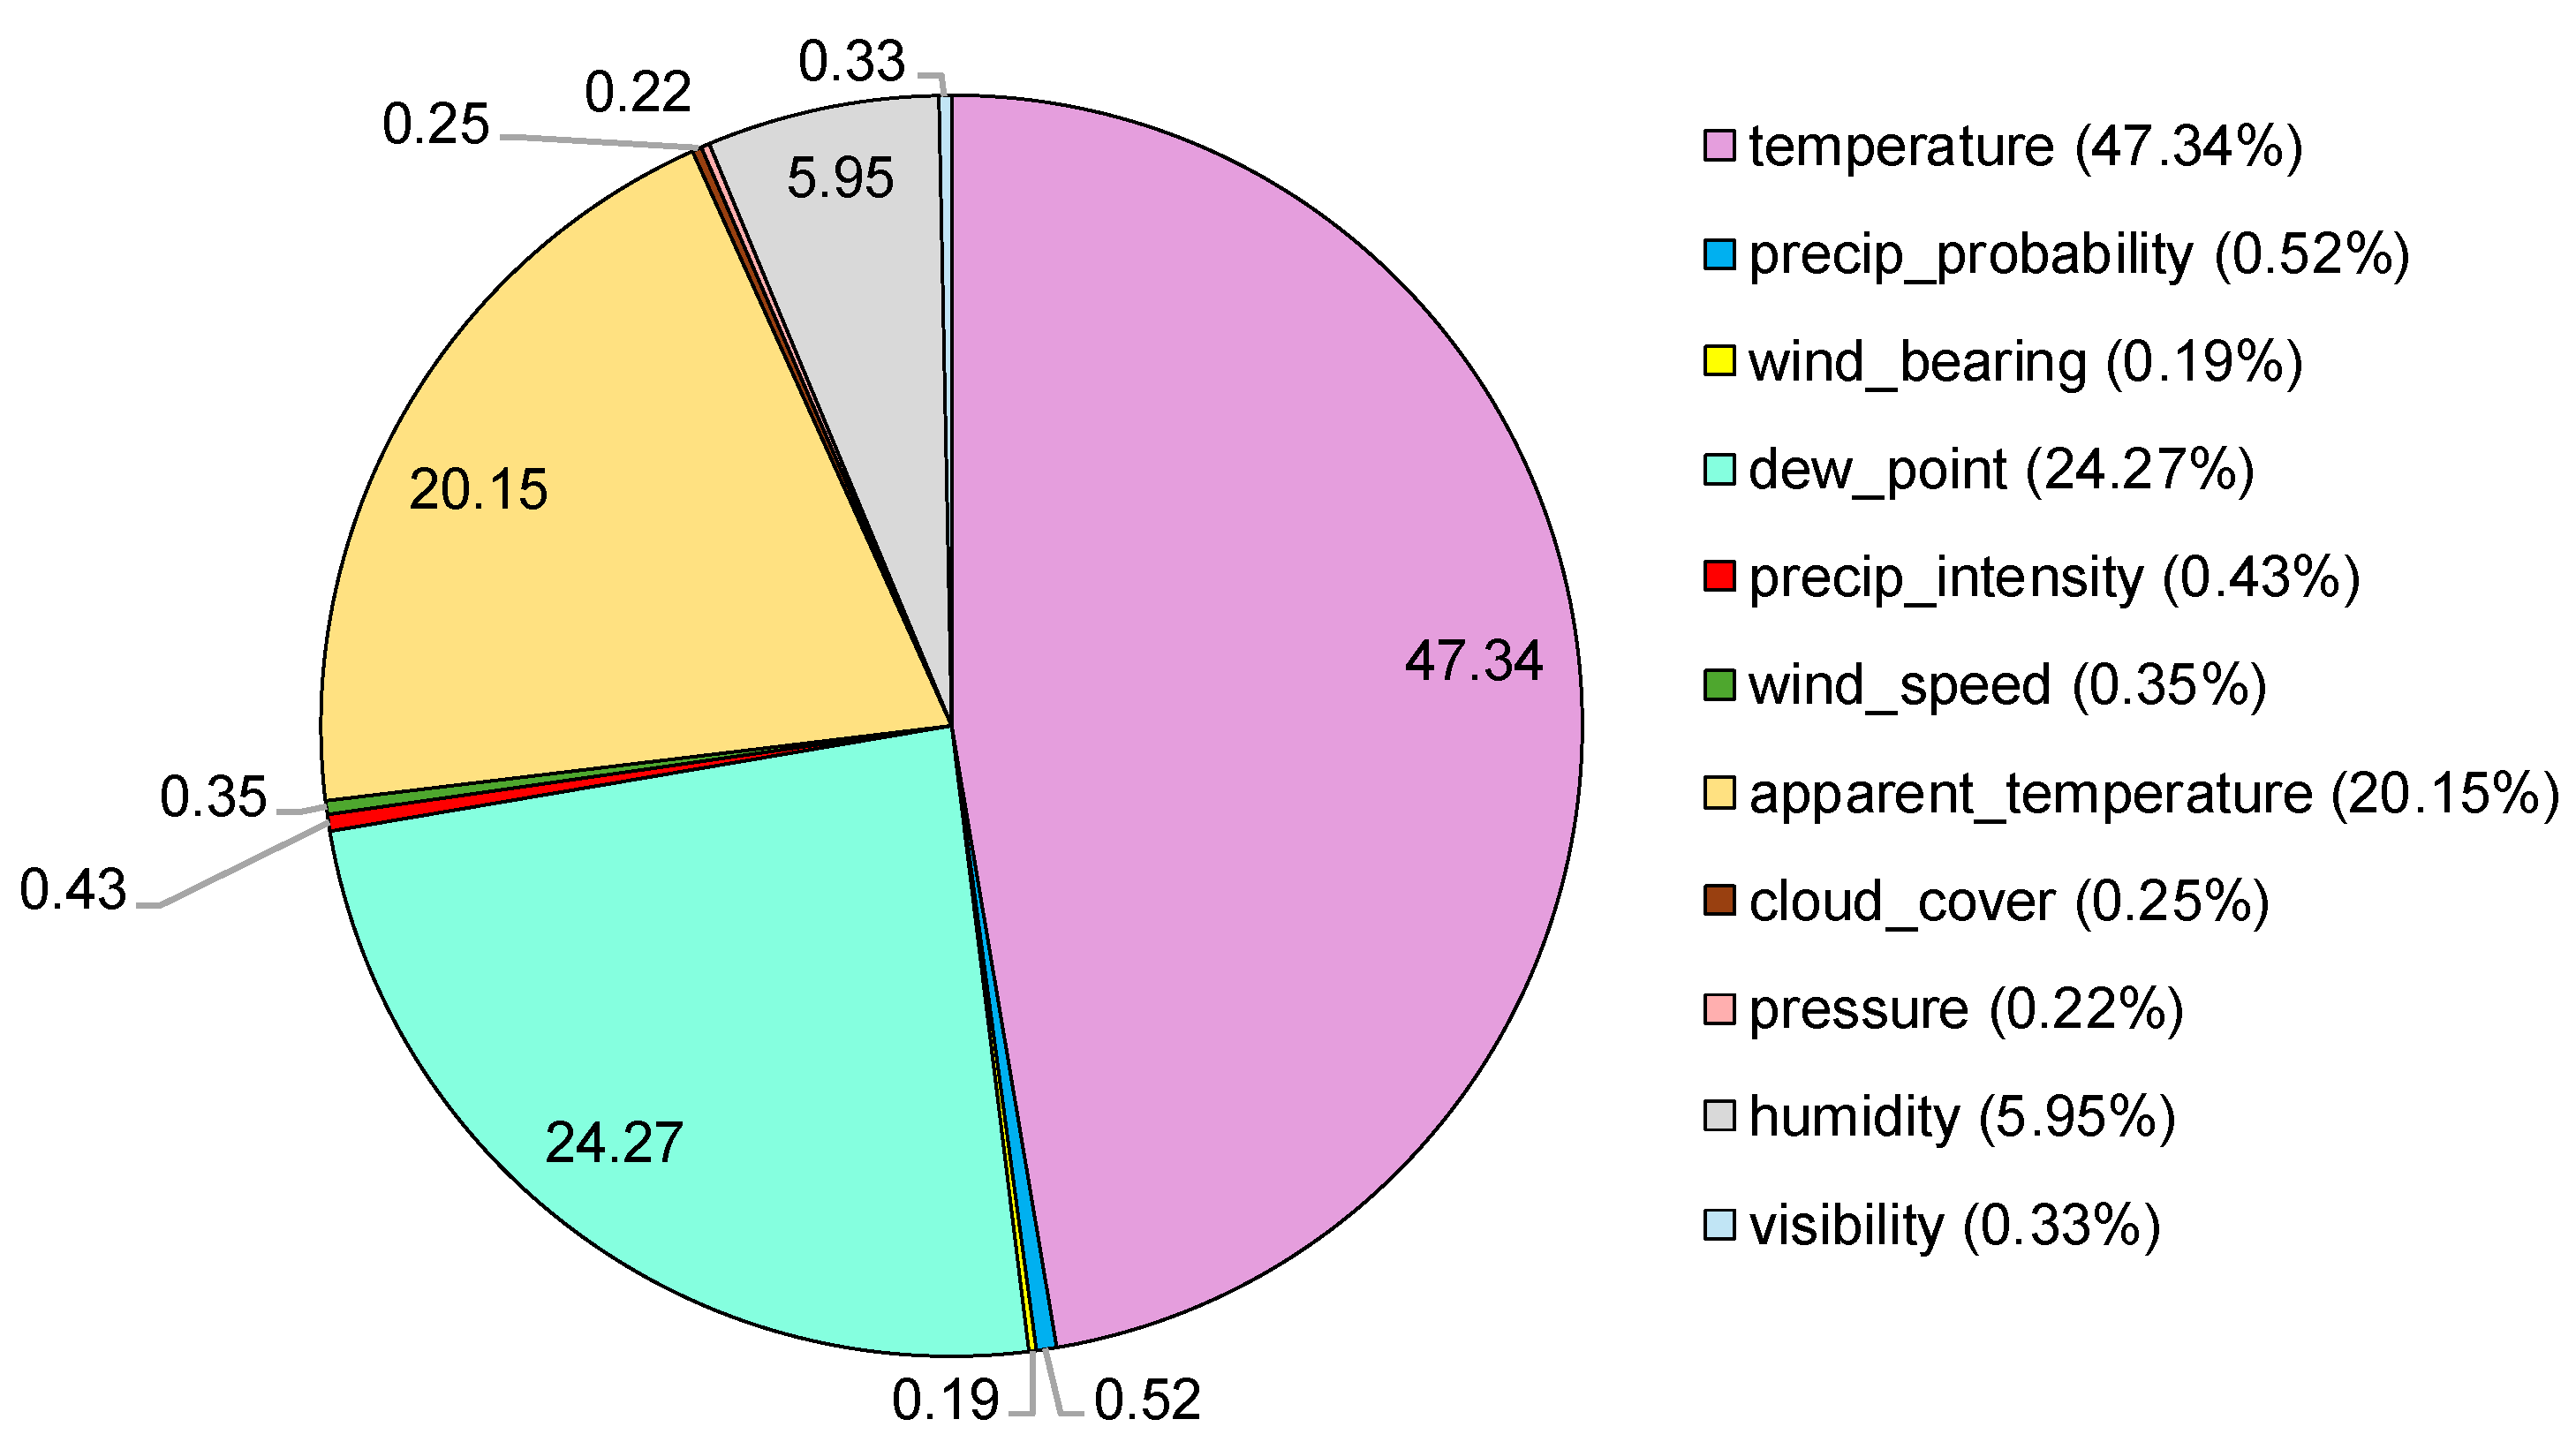
From these results, it is observed that variables such as temperature, humidity, apparent_temperature, and dew_point possess VIF values of 296.67, 37.35, 126.29, and 152.15, respectively. Therefore, these have high multicollinearity, which indicates potential issues for solar energy generation. The remaining variables, such as pressure, visibility, wind_speed, wind_bearing, cloud_cover, preceip_intensity, and precip_probability possess a VIF of <5. This shows an allowed level of multicollinearity and, thereby, no issue with solar energy generation. A summary of the percentage of criticality for each weather parameter is given in Table 5 and displayed in Figure 5.
From this figure, it is marked that temperature has a significant impact on solar power generation when compared to other weather parameters. The percentage of the criticality for temperature, apparent_temperature, and dew_point is 47.32, 20.15, and 24.27, respectively.

Scientific Significance and Usefulness of the Results

The proposed analysis bridges the gap among energy engineering, data analytics, and environmental science. It provides a scientific basis for exploiting the potential of solar energy in smart homes. The significance of this proposed analysis is outlined as follows:
It discloses the degree to which the weather factors are interrelated, developing a basic understanding of system-ecological interactions.
The presented analysis of correlation reveals which weather factors (e.g., temperature, humidity, wind speed, cloud cover, etc.) majorly influence solar energy generation. Where factors like temperature and cloud cover are directly related to photovoltaic performance, and factors like humidity and wind speed have indirect effects (e.g., panel cooling, improving efficiency).
This correlation analysis enhances model training for AI/ML-based predictive algorithms. This leads to more accurate solar energy generation forecasting models, thereby improving energy planning, stability, and reliability.
This analysis helps in finding environmental stressors that may reduce panel efficiency over time. This helps in developing hardware optimizations or adaptive control schemes for sustained performance and longevity of the solar panels.
Especially when designing control systems (such as appliance scheduling, converter control, battery charging/discharging control, or grid interaction control), it is crucial to design predefined logical decisions based on highly influential predictors.
Provides validated insights for making location-specific decisions related to solar plant deployment. Energy planners or government bodies can use these studies for renewable energy incentives or energy infrastructure design.
Further, computing the VIF reveals how the correlation analysis and predictive modeling are statistically significant and practically useful. In the context of smart homes and solar energy, it leads to smarter control systems, better energy forecasting, and efficient integration of renewable energy.
Thus, the proposed analysis in this paper helps the growth of resilient smart homes tailored to changing climatic conditions.
The intermittent nature of the weather parameters will influence the multicollinearity. From the results, it can be observed that some weather parameters are not identified as critical weather parameters based on the recorded weather data. This intermittency influences the utilization of simple models like MLR rather than other regression models.

5. Conclusions

This paper presents a correlation analysis for identifying critical weather parameters that impact solar energy generation in smart homes. The results achieved in this paper support the significance of implementing the correlation analysis on smart home data concerning the impact of weather conditions on power generation.
The variables, viz., temperature, humidity, apparent_temperature, and dew_point with VIF values 296.67, 37.35, 126.29, and 152.15, are the critical weather parameters that significantly influence solar energy generation.
The percentage of the criticality for temperature, apparent_temperature, and dew_point is 47.32, 20.15, and 24.27, respectively.
This correlation analysis helps in better generation and load management planning, viz., real-time energy monitoring, forecast-based scheduling, and time-of-use pricing for smart homes, thereby contributing to sustainable development and energy independence.

Author Contributions

Conceptualization, P.P.K. and Y.V.P.K.; methodology, P.P.K.; software, G.P.R.; validation, Y.V.P.K.; formal analysis, Y.V.P.K.; investigation, P.P.K.; resources, Y.V.P.K.; data curation, G.P.R.; writing—original draft preparation, P.P.K.; writing—review and editing, Y.V.P.K.; visualization, G.P.R.; supervision, Y.V.P.K.; project administration, Y.V.P.K. All authors have read and agreed to the published version of the manuscript.

Funding

This research received no external funding.

Institutional Review Board Statement

Not applicable.

Informed Consent Statement

Not applicable.

Data Availability Statement

The original data presented in the study are openly available in Kaggle at https://www.kaggle.com/datasets/taranvee/smart-home-dataset-with-weather-information, accessed on 6 April 2025.

Conflicts of Interest

The author declares no conflicts of interest.

References

  1. Prakash, K.P.; Kumar, Y.V.P.; Ganesh, L.K.M.; Ramani, K. Machine Learning-Based Ensemble Classifiers for Anomaly Handling in Smart Home Energy Consumption Data. Sensors 2022, 22, 9323. [Google Scholar] [CrossRef]
  2. Pedro, G.G.; Juan, A.M.; Antonio, S. A Prosumer-Oriented, Interoperable, Modular and Secure Smart Home Energy Management System Architecture. Smart Cities 2022, 5, 1054–1078. [Google Scholar] [CrossRef]
  3. Jung, H.; Yeo, C.; Jang, E.; Chang, Y.; Song, C. Machine-Learning-Based Diabetes Classification Method Using Blood Flow Oscillations and Pearson Correlation Analysis of Feature Importance. Mach. Learn. Sci. Technol. 2024, 5, 045024. [Google Scholar] [CrossRef]
  4. Wang, H.; Wang, T.; Hao, Y.; Ding, S.; Feng, J. Breast Tumor Segmentation via Deep Correlation Analysis of Multi-Sequence MRI. Med. Biol. Eng. Comput. 2024, 62, 3801–3814. [Google Scholar] [CrossRef] [PubMed]
  5. Osborne, A.J.; Bierzynska, A.; Colby, E.; Andag, U.; Kalra, P.A.; Radresa, O.; Skroblin, P.; Taal, M.W.; Welsh, G.I.; Saleem, M.A.; et al. Multivariate Canonical Correlation Analysis Identifies Additional Genetic Variants for Chronic Kidney Disease. Npj Syst. Biol. Appl. 2024, 10, 28. [Google Scholar] [CrossRef] [PubMed]
  6. Zhu, L.; Xu, Z.; Wang, Y.; Cheng, C. Correlation Analysis of Energy Consumption of Agricultural Rotorcraft. Comput. Mater. Contin. 2022, 71, 3179–3192. [Google Scholar] [CrossRef]
  7. Zhou, B.; Li, N.; Lu, D.; Xia, J. Correlation Analysis between Economic Growth and Environmental Quality. Comput. Syst. Sci. Eng. 2022, 41, 127–140. [Google Scholar] [CrossRef]
  8. Li, C.; Yao, Y.; Yang, R.; Li, C.; Zhang, H. Correlation Analysis between Environmental Pressure and Vision-Based Flames from Monitoring Camera during Depressurization Process. SIViP 2022, 16, 1369–1377. [Google Scholar] [CrossRef]
  9. Tong, L.; Zhang, C.; Peng, Z.; Wang, L. Spatial-Temporal Distribution Characteristics and Correlation Analysis of Air Pollutants from Ships in Inland Ports. Sustainability 2022, 14, 14214. [Google Scholar] [CrossRef]
  10. Li, H.; Cheshmehzangi, A.; Zhang, Z.; Su, Z.; Pourroostaei Ardakani, S.; Sedrez, M.; Dawodu, A. The Correlation Analysis between Air Quality and Construction Sites: Evaluation in the Urban Environment during the COVID-19 Pandemic. Sustainability 2022, 14, 7075. [Google Scholar] [CrossRef]
  11. Liao, J.; Liu, Y.; Guo, C.; Zhou, N.; Wang, Q.; Kang, W.; Vasquez, J.C.; Guerrero, J.M. Power Quality of DC Microgrid: Index Classification, Definition, Correlation Analysis and Cases Study. Int. J. Electr. Power Energy Syst. 2024, 156, 109782. [Google Scholar] [CrossRef]
  12. Peng, D.; Liu, Y.; Wang, D.; Zhao, H.; Qu, B. Multi-Energy Load Forecasting for Integrated Energy System Based on Sequence Decomposition Fusion and Factors Correlation Analysis. Energy 2024, 308, 132796. [Google Scholar] [CrossRef]
  13. Widianto, A.J.; Adytia, D.; Aditya, I.A. Feature Modelling for Electricity Load Forecasting Using Hybrid EEMD-BiLSTM with Spatially Correlated Weather Data. IJIES 2024, 17, 1193–1211. [Google Scholar] [CrossRef]
  14. Wang, X. Correlation Analysis of Energy Consumption, Carbon Emissions and Economic Growth. Energy Inform. 2024, 7, 45. [Google Scholar] [CrossRef]
  15. Zhong, Y.; Li, T.; Przystupa, K.; Lin, C.; Yang, G.; Yang, S.; Kochan, O.; Sikora, J. Spatiotemporal Correlation Analysis for Predicting Current Transformer Errors in Smart Grids. Energies 2024, 17, 1608. [Google Scholar] [CrossRef]
  16. Zhou, J.; Tuo, J.; Wang, L.; Shi, Y.; Zha, W. Calculation of Electricity Sales Based on Multi-Factor Correlation Analysis. Front. Energy Res. 2023, 11, 1326100. [Google Scholar] [CrossRef]
  17. Rehman, A.; Haseeb, K.; Jeon, G.; Bahaj, S.A. Secure Edge-Based Energy Management Protocol in Smart Grid Environments with Correlation Analysis. Sensors 2022, 22, 9236. [Google Scholar] [CrossRef]
  18. Fei, Y.; Leigang, S.; Juanle, W. Monthly Variation and Correlation Analysis of Global Temperature and Wind Resources under Climate Change. Energy Convers. Manag. 2023, 285, 116992. [Google Scholar] [CrossRef]
  19. Wang, Y.; Wang, J.; Cao, M.; Li, W.; Yuan, L.; Wang, N. Prediction Method of Wind Farm Power Generation Capacity Based on Feature Clustering and Correlation Analysis. Electr. Power Syst. Res. 2022, 212, 108634. [Google Scholar] [CrossRef]
  20. Wang, W.; Qin, C.; Zhang, J.; Wen, C.; Xu, G. Correlation Analysis of Three-Parameter Weibull Distribution Parameters with Wind Energy Characteristics in a Semi-Urban Environment. Energy Rep. 2022, 8, 8480–8498. [Google Scholar] [CrossRef]
  21. Xiang, Y.; Tang, Q.; Xu, W.; Hu, S.; Zhao, P.; Guo, J.; Liu, J. A Multi-Factor Spatio-Temporal Correlation Analysis Method for PV Development Potential Estimation. Renew. Energy 2024, 223, 119962. [Google Scholar] [CrossRef]
  22. Sharma, S.; Malik, P.; Sinha, S. The Impact of Soiling on Temperature and Sustainable Solar PV Power Generation: A Detailed Analysis. Renew. Energy 2024, 237, 121864. [Google Scholar] [CrossRef]
  23. Du, X.; Lang, Z.; Liu, M.; Wu, J. Regression Analysis and Prediction of Monthly Wind and Solar Power Generation in China. Energy Rep. 2024, 12, 1385–1402. [Google Scholar] [CrossRef]
  24. Issaq, S.Z.; Talal, S.K.; Azooz, A.A. Effects of Varying Weather Parameters on Solar Still Performance. Desalination Water Treat. 2023, 298, 12–22. [Google Scholar] [CrossRef]
  25. Gholami, A.; Ameri, M.; Zandi, M.; Gavagsaz Ghoachani, R.; Jafarzadegan Gerashi, S.; Kazem, H.A.; Al-Waeli, A.H.A. Impact of Harsh Weather Conditions on Solar Photovoltaic Cell Temperature: Experimental Analysis and Thermal-Optical Modeling. Sol. Energy 2023, 252, 176–194. [Google Scholar] [CrossRef]
  26. Gopi, A.; Sharma, P.; Sudhakar, K.; Ngui, W.K.; Kirpichnikova, I.; Cuce, E. Weather Impact on Solar Farm Performance: A Comparative Analysis of Machine Learning Techniques. Sustainability 2022, 15, 439. [Google Scholar] [CrossRef]
  27. Son, Y.; Yoon, Y.; Cho, J.; Choi, S. Cloud Cover Forecast Based on Correlation Analysis on Satellite Images for Short-Term Photovoltaic Power Forecasting. Sustainability 2022, 14, 4427. [Google Scholar] [CrossRef]
  28. Pilario, K.E.S.; Ibañez, J.A.; Penisa, X.N.; Obra, J.B.; Odulio, C.M.F.; Ocon, J.D. Spatio-Temporal Solar–Wind Complementarity Assessment in the Province of Kalinga-Apayao, Philippines Using Canonical Correlation Analysis. Sustainability 2022, 14, 3253. [Google Scholar] [CrossRef]
  29. Smart Home Dataset with Weather Information. Available online: https://www.kaggle.com/datasets/taranvee/smart-home-dataset-with-weather-information (accessed on 6 April 2025).
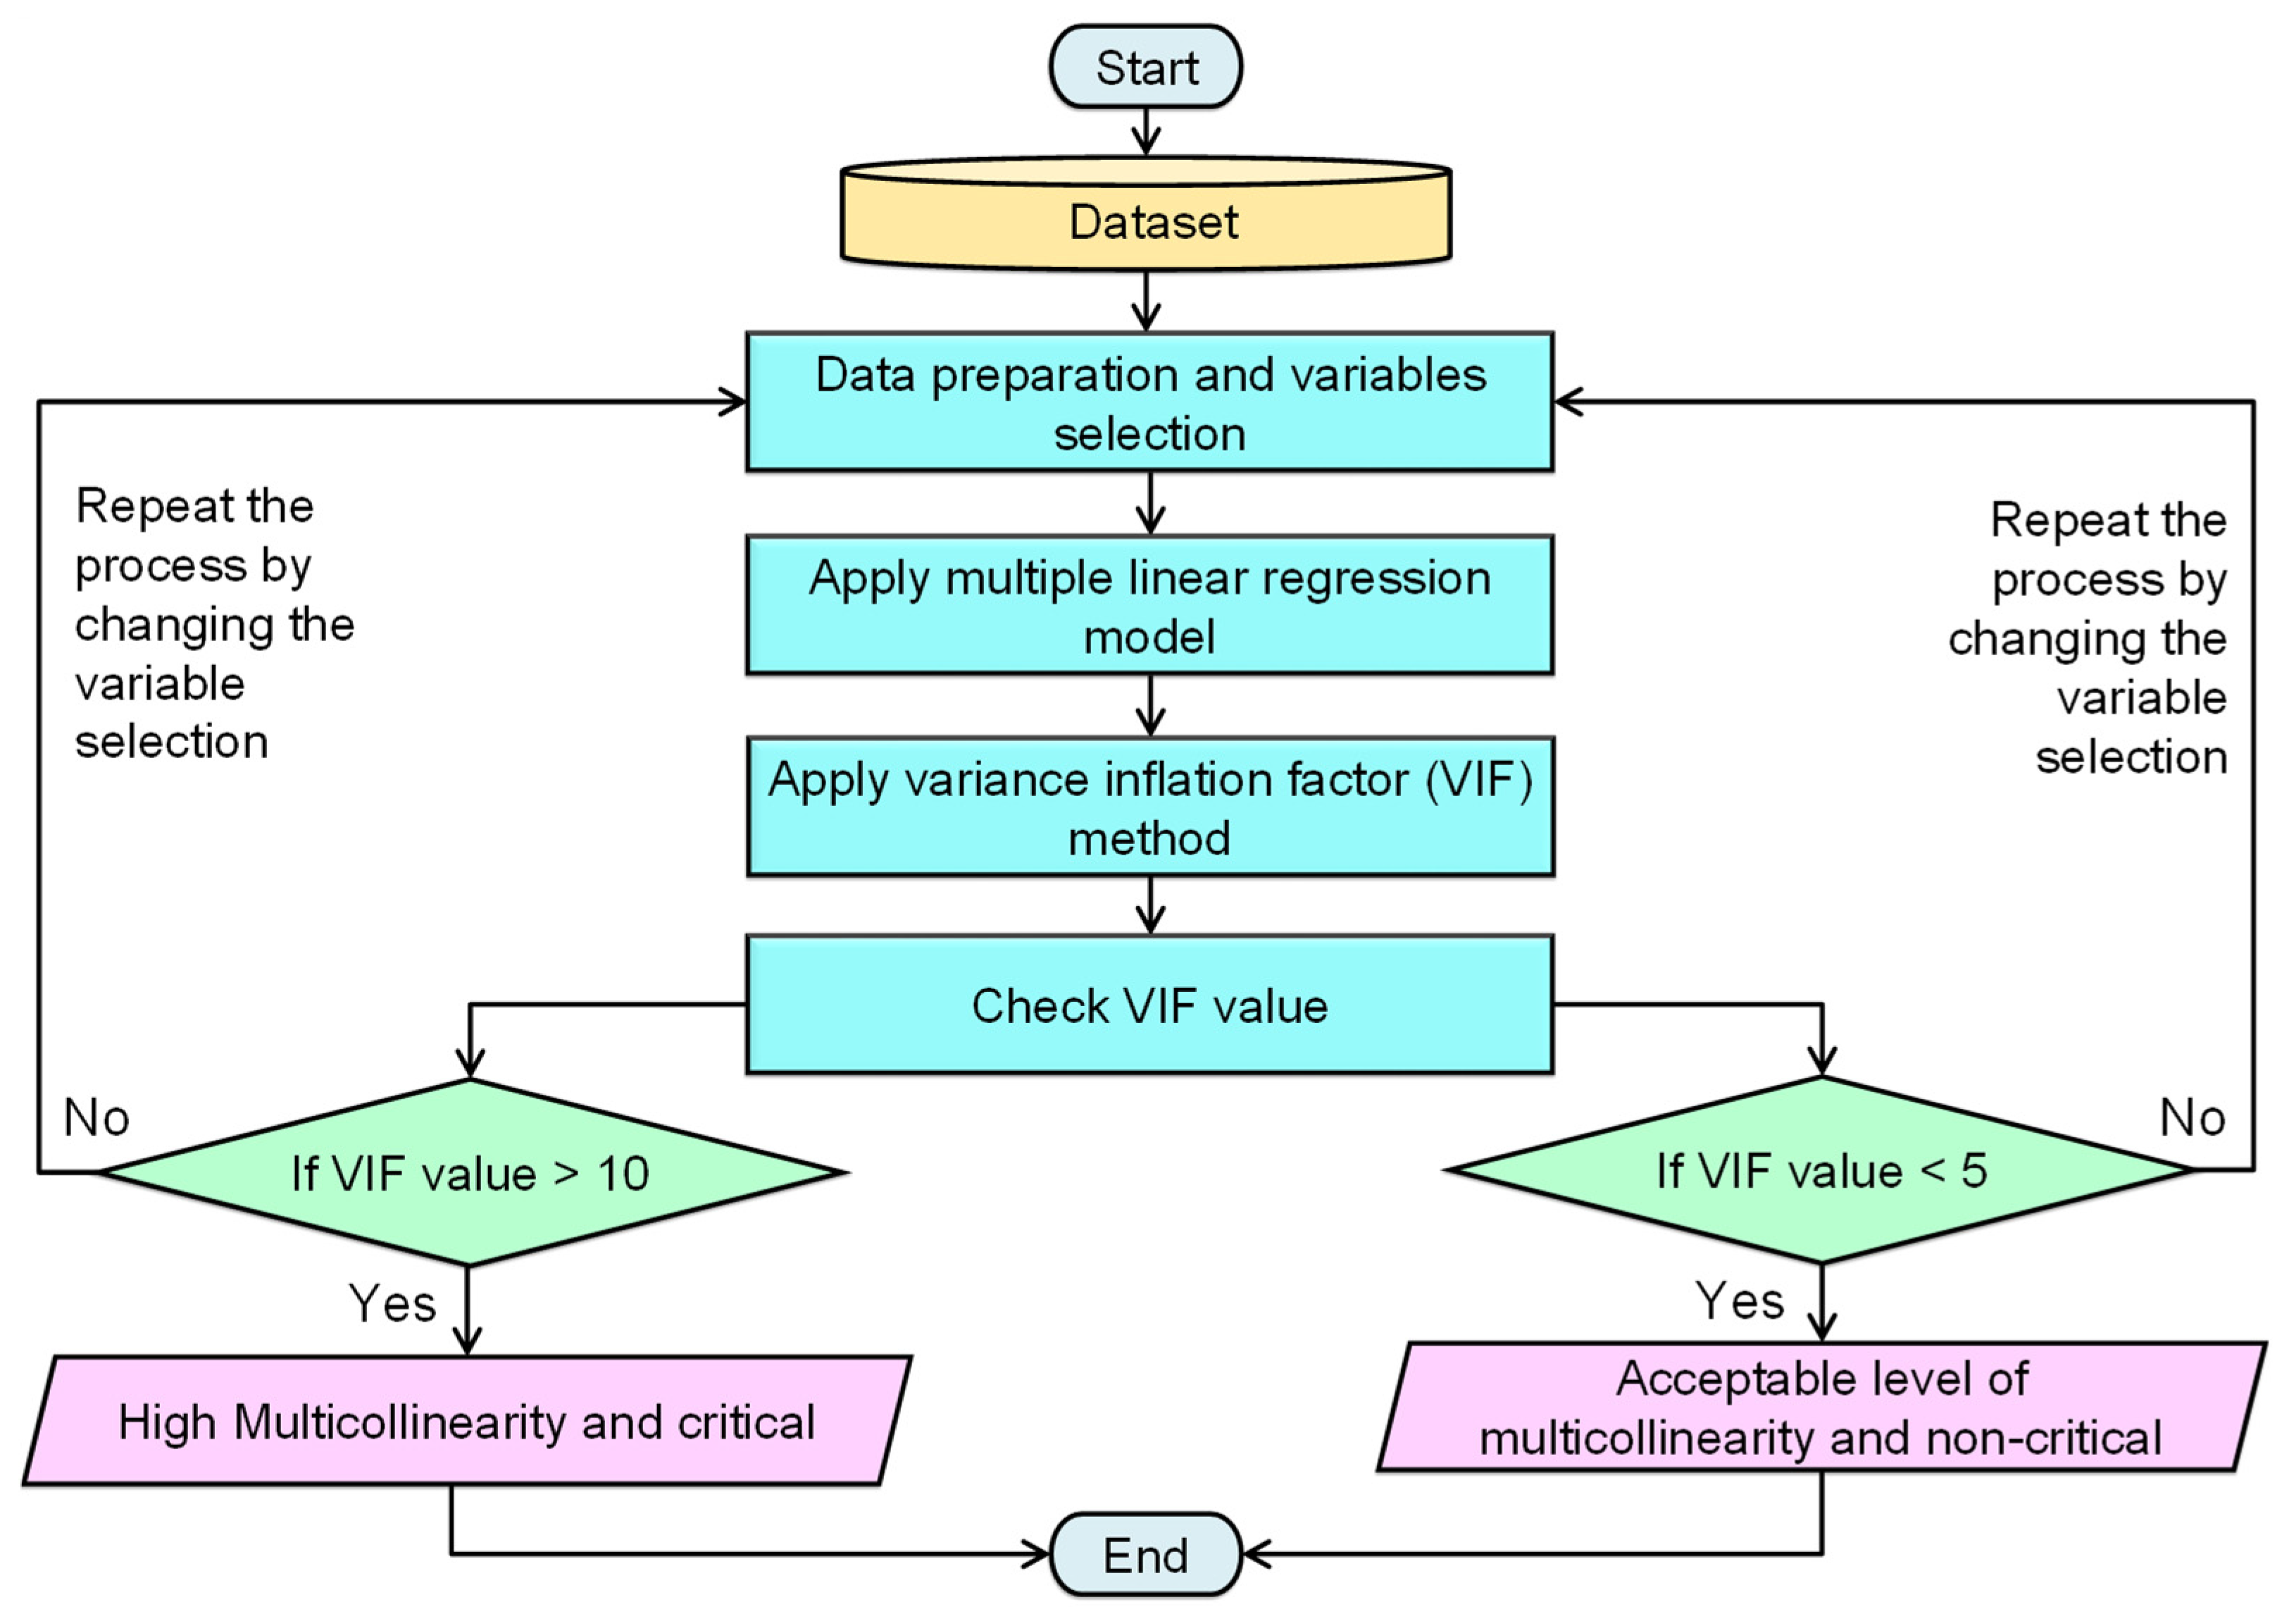
Figure 1. Workflow of the suggested methodology.
Engproc 87 00106 g001
Figure 2. VIF values of each weather parameter.
Engproc 87 00106 g002
Figure 3. Critical weather parameters (VIF value > 10).
Engproc 87 00106 g003
Figure 4. Non-critical weather parameters (VIF value < 5).
Engproc 87 00106 g004
Figure 5. Percentage of criticality.
Engproc 87 00106 g005
Table 1. Literature related to correlation analysis in various applications.
Year [Ref]AimMethodologyKey Conclusion of the Work
2024 [3]
The assessment of each blood flow oscillation.
Pearson correlation analysis and the feature importance.
The impact of blood flow oscillations was analyzed.
2024 [4]
The segmentation of breast tumors.
A hybrid deep learning framework for the correlation analysis of features in multi-sequence MRI.
Improved performance in breast tumor segmentation.
2024 [5]
The detection of genetic variations in chronic kidney disease.
Canonical correlation analysis.
Additional single-nucleotide polymorphisms and genes were identified.
2022 [6]
To find the relation between energy consumption and the flight dynamic parameters of rotorcraft.
Linear motion and turning maneuver experiments were conducted.
For agricultural rotorcraft, the arrangement of the waypoints should be in a straight line.
2022 [7]
To find the relation between economic growth and the environment.
Backpropagation neural network and panel model.
Inverted U-shaped relationship between the environmental quality and economic growth.
2022 [8]
To find the correlation between environmental pressure and vision-based flames.
Gray level co-occurrence matrix.
A linear relationship exists between the vision-based flames and the decreasing pressure.
2022 [9]
To observe the relationship between the air pollutants on ships.
Pearson correlation analysis.
Based on the analysis, it is recommended to improve the quality of the ship’s fuel.
2022 [10]
To find the association between construction sites and air quality.
Pearson correlation analysis.
Construction sites have a significant impact on air quality.
2024 [11]
To observe the relation between abnormalities, viz., fluctuations and harmonics, voltage sag and transient unbalance, and voltage deviation and steady-state unbalance in microgrids.
Power quality indices.
There is a correlation between the fluctuations and harmonics, voltage sag and transient unbalance, and voltage deviation and steady-state unbalance.
2024 [12]
The correlation between various aspects that impact multi-energy load forecasting.
MTL-CNN-BiGRU-Attention and influencing factors correlation analysis.
This analysis concluded that there was a reduction in the complexity of the time series and effective variable selection.
2024 [13]
To select the best locations to give as input to the model for electricity load forecasting.
Spatial correlation
The spatial correlation coefficient was superior, especially for handling the complexity of the electricity load.
2024 [14]
To observe the correlation between energy consumption, carbon emissions, and the growth of the economy.
Gray correlation analysis.
All augmented Dickey–Fuller values of lnCO2, △lnCO2, lnGDP, △lnGDP, lnEN, and △lnEN are greater than the critical values.
2024 [15]
To observe the correlation to predict the errors of current transformers in smart grids.
Spatiotemporal correlation analysis.
A significant improvement in the performance metrics.
2023 [16]
To analyze the importance of calculating the sales of electricity.
Multi-factor correlation analysis.
The importance of the sales of electricity was analyzed.
2022 [17]
To find the most reliable neighbors for predicting the optimal paths.
Edge-based sensing protocol.
The most reliable neighbors were identified.
2023 [18]
To find the relation between wind sources and global temperature.
Theil–Sen’s median linear regression and Mann–Kendall test.
There was a significant impact of climate change on wind sources.
2022 [19]
To support the estimate of wind farm power generation capacity.
Pearson correlation coefficient.
The estimation of power generation capacity with the proposed analysis was observed to be superior.
2022 [20]
The correlation between the wind energy parameters and the Weibull distribution function in a semi-urban environment.
Correlation coefficient method.
This analysis observed the positive and negative correlation between wind energy and the Weibull distribution function.
2024 [21]
To find the correlation between various spatiotemporal factors to better plan the development of photovoltaic (PV) systems.
Multi-factor spatiotemporal correlation analysis.
This analysis found that there was a significant impact of various factors such as PV power data information, spatial irradiance, and wind speed.
2024 [22]
To observe the correlation between soiling and temperature for maintainable PV power generation by decreasing soiling-induced temperature variations.
Hybrid diode model.
This analysis concluded that the soiling-induced temperature variations should be addressed.
2024 [23]
To determine the inhomogeneity quantities and seasonal components that influence the monthly power generation patterns of solar and wind energy sources in China.
Regression analysis.
This study analyzed that there will be a substantial growth in power generation from wind energy sources in China.
2023 [24]
To analyze the correlation between various weather parameters, namely wind speed, temperature, dew point, and solar still performance.
Empirical model equation.
This analysis revealed that the solar still performance was based on the wind speed, temperature, dew point.
2023 [25]
To study the effect of tough weather conditions on solar PV temperature.
Semi-empirical correlation forms.
It was concluded that the implementation of the proposed semi-empirical correlation forms should be preferred for better performance.
2022 [26]
To discuss the effect of weather parameters on the performance of solar farms.
Machine-learning techniques.
Comparison of various machine learning models was performed.
2022 [27]
To estimate the short-term PV power using satellite images of cloud cover.
Spatiotemporal correlation analysis.
This work concluded that the analysis of cloud cover was good for estimating the short-term PV power.
2022 [28]
To study the solar and wind complementarity for a Philippines case study
Canonical correlation.
Solar and wind complementarity was analyzed.
Table 2. Details of the considered variables in the dataset.
Dependent VariableIndependent Variables
solar_gentemperature, visibility, pressure, humidity, wind_speed, wind_bearing, precip_probability, precip_intensity, apparent_temperature, cloud_cover, dew_point
Table 3. Summary of regression coefficients.
TermEstimateStd Errorp-Value
(Intercept)0.00650.0280.818
temperature−0.00310.00020
humidity−0.1840.00560
visibility−0.0030.00020
apparent_temperature0.00030.00010.0002
wind_speed−0.00210.00010
pressure0.000200
wind_bearing000
cloud_cover−0.00240.00080.0023
precip_intensity−0.1290.02640
dew_point0.00350.00010
precip_probability 0.04150.0020
Table 4. Summary of VIF values of various weather parameters.
S. No.Weather ParameterVIF ValueVIF Value > 10Status (C: Critical; NC: Non-Critical)
1temperature296.67YesC
2humidity37.35YesC
3visibility1.99NoNC
4apparent_temperature126.29YesC
5wind_speed2.07NoNC
6pressure1.37NoNC
7wind_bearing1.18NoNC
8cloud_cover1.61NoNC
9precip_intensity2.74NoNC
10dew_point152.15YesC
11precip_probability 3.27NoNC
Table 5. Summary of the percentage of criticality.
S. No.Weather ParameterCriticality (%)
1temperature47.32
2humidity5.95
3visibility0.31
4apparent_temperature20.15
5wind_speed0.33
6pressure0.21
7wind_bearing0.18
8cloud_cover0.25
9precip_intensity0.43
10dew_point24.27
11precip_probability0.52
Disclaimer/Publisher’s Note: The statements, opinions and data contained in all publications are solely those of the individual author(s) and contributor(s) and not of MDPI and/or the editor(s). MDPI and/or the editor(s) disclaim responsibility for any injury to people or property resulting from any ideas, methods, instructions or products referred to in the content.