Multiple Linear Regression-Based Correlation Analysis of Various Critical Weather Factors and Solar Energy Generation in Smart Homes †
Abstract
1. Introduction
2. Literature Review
3. Materials and Methods
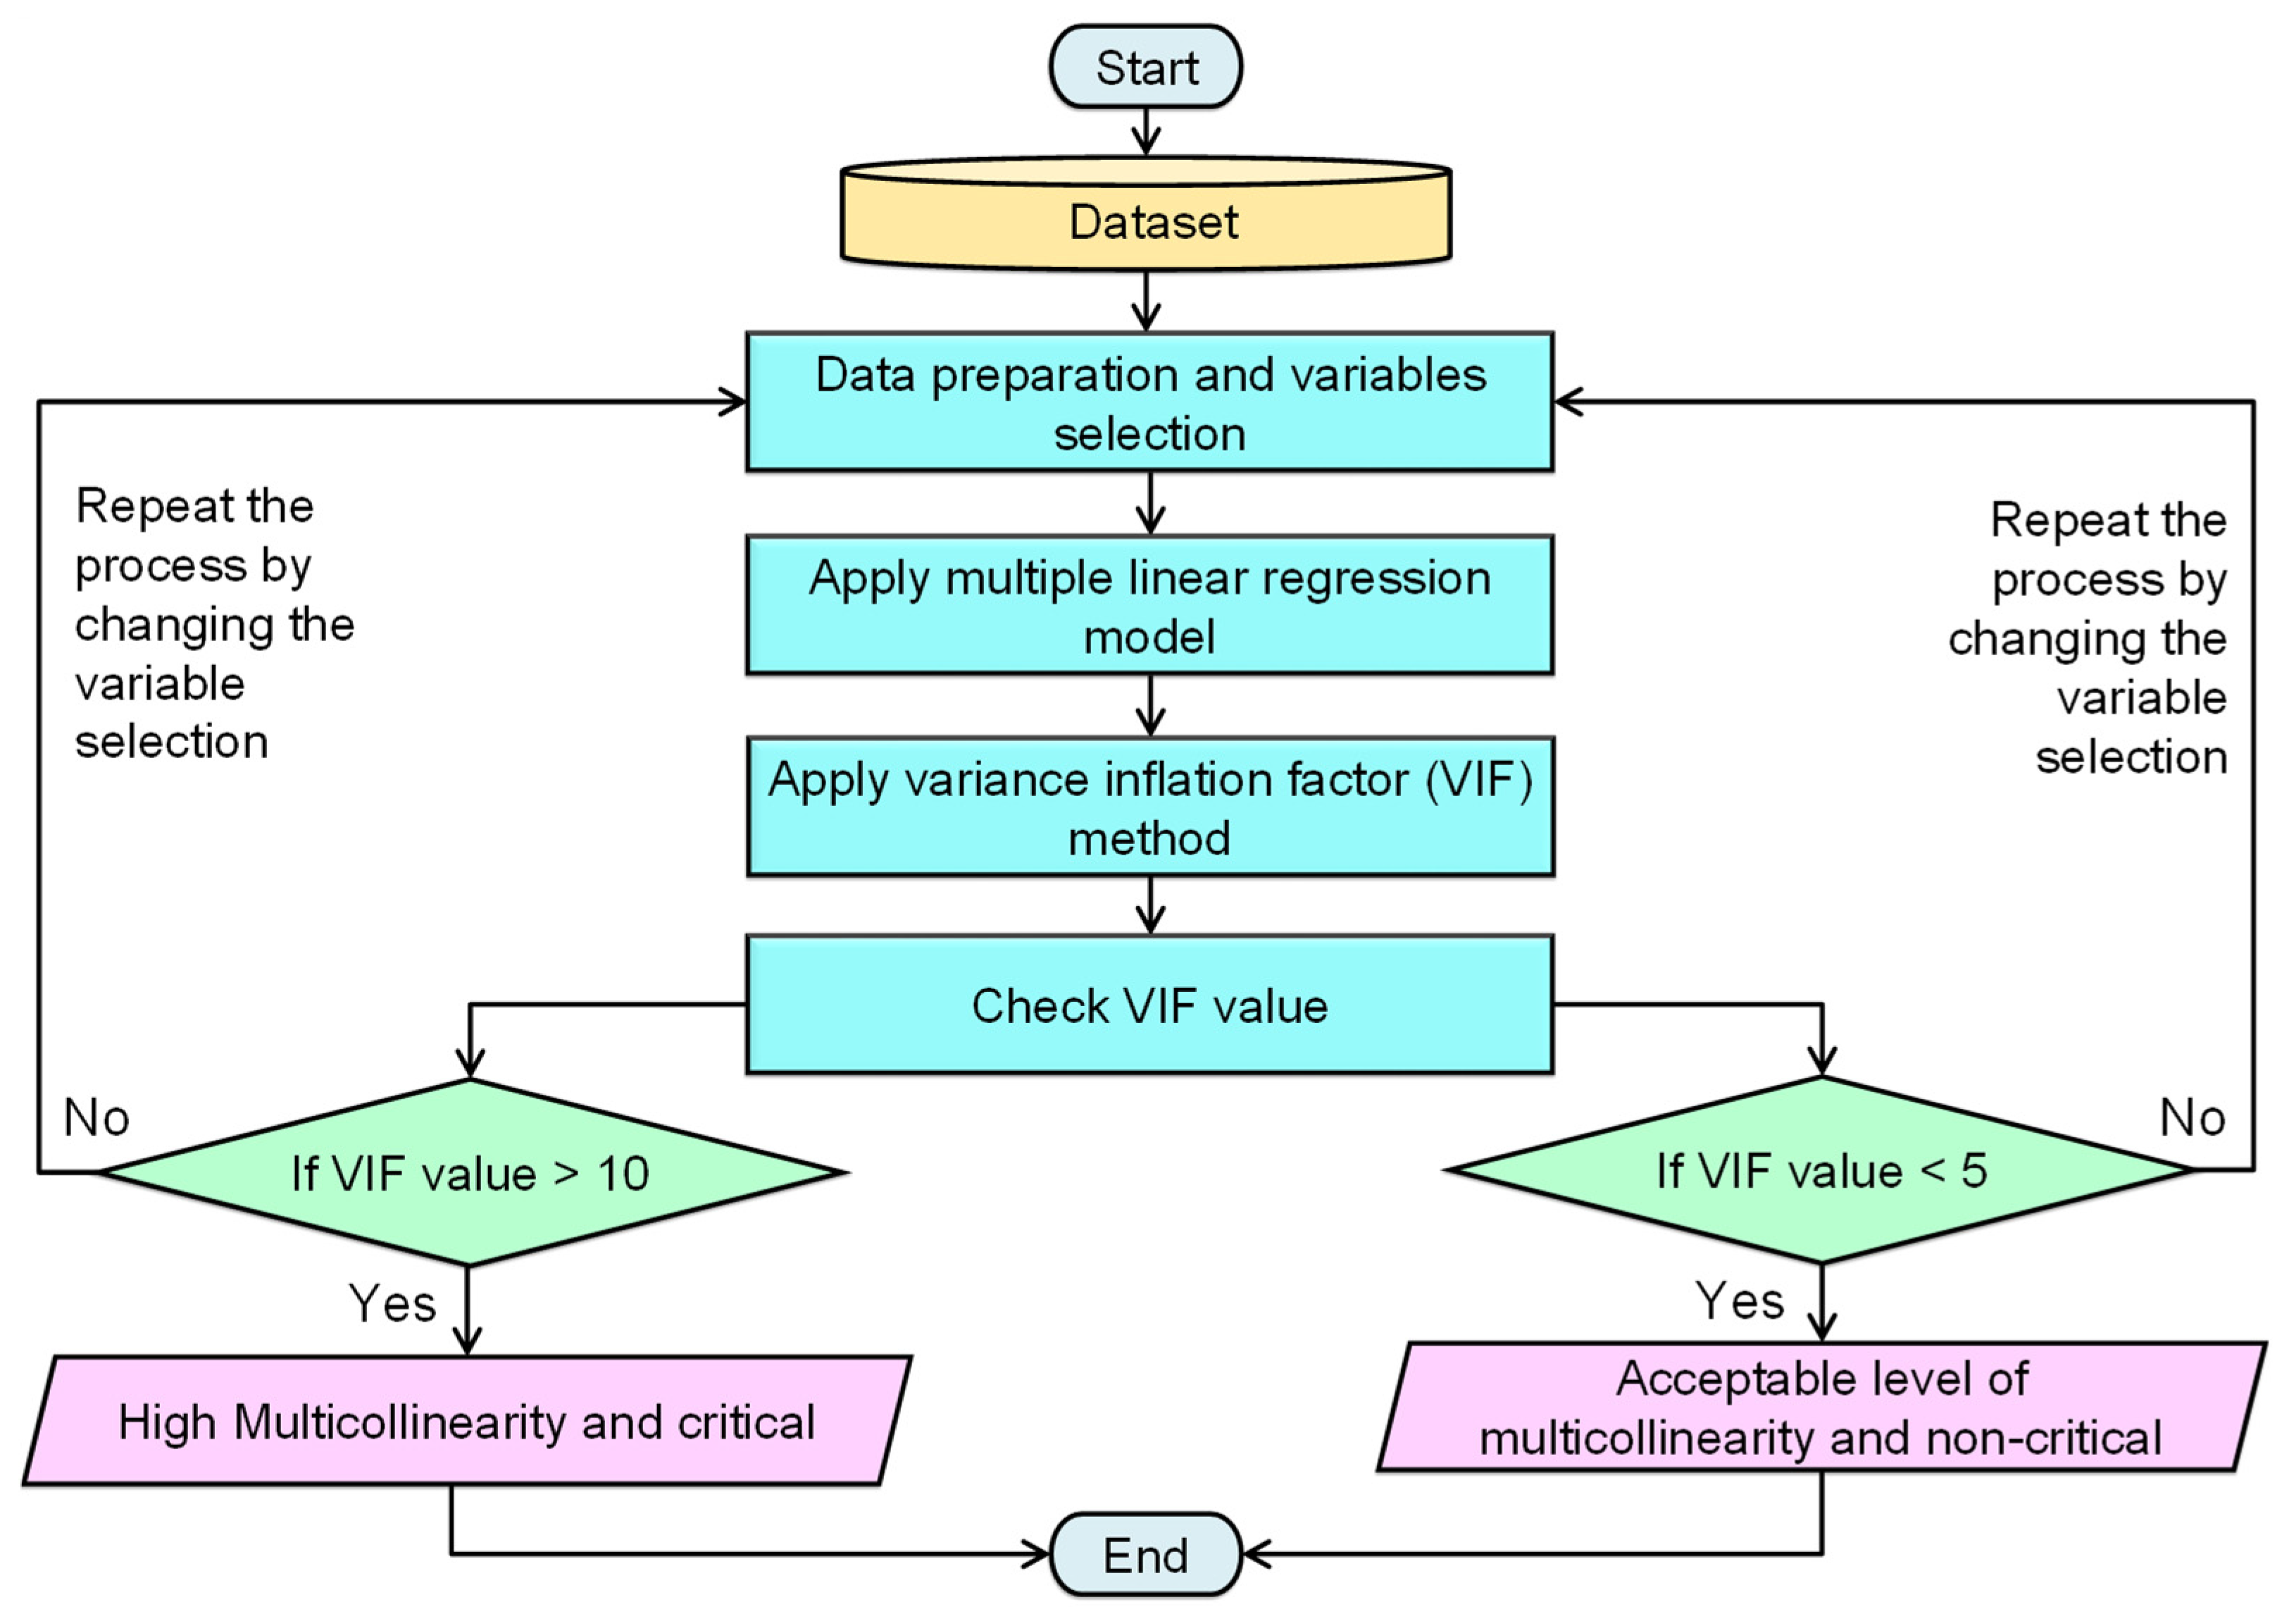
3.1. Workflow of the Proposed Methodology
3.2. Dataset Description
3.3. Rationale for Implementing Multiple Linear Regression
3.4. Multiple Linear Regression
- ▪
- The lm() function is primarily used for regression analysis to fit the linear models to the data. A model is built using the lm() function, which takes a dependent variable and multiple independent variables as input. This model will estimate the association between the independent and dependent variables.
- ▪
- The syntax of the regression model is as follows:
- ▪
- The following is the model for the considered variables for the proposed work:
- ▪
- The output of the lm() function will be an object that contains the coefficients for each independent variable, including statistics like the p-value, R-squared, and other metrics to assess the model’s performance.
3.5. Variance Inflation Factor
4. Results and Discussion
Scientific Significance and Usefulness of the Results
- ▪
- It discloses the degree to which the weather factors are interrelated, developing a basic understanding of system-ecological interactions.
- ▪
- The presented analysis of correlation reveals which weather factors (e.g., temperature, humidity, wind speed, cloud cover, etc.) majorly influence solar energy generation. Where factors like temperature and cloud cover are directly related to photovoltaic performance, and factors like humidity and wind speed have indirect effects (e.g., panel cooling, improving efficiency).
- ▪
- This correlation analysis enhances model training for AI/ML-based predictive algorithms. This leads to more accurate solar energy generation forecasting models, thereby improving energy planning, stability, and reliability.
- ▪
- This analysis helps in finding environmental stressors that may reduce panel efficiency over time. This helps in developing hardware optimizations or adaptive control schemes for sustained performance and longevity of the solar panels.
- ▪
- Especially when designing control systems (such as appliance scheduling, converter control, battery charging/discharging control, or grid interaction control), it is crucial to design predefined logical decisions based on highly influential predictors.
- ▪
- Provides validated insights for making location-specific decisions related to solar plant deployment. Energy planners or government bodies can use these studies for renewable energy incentives or energy infrastructure design.
- ▪
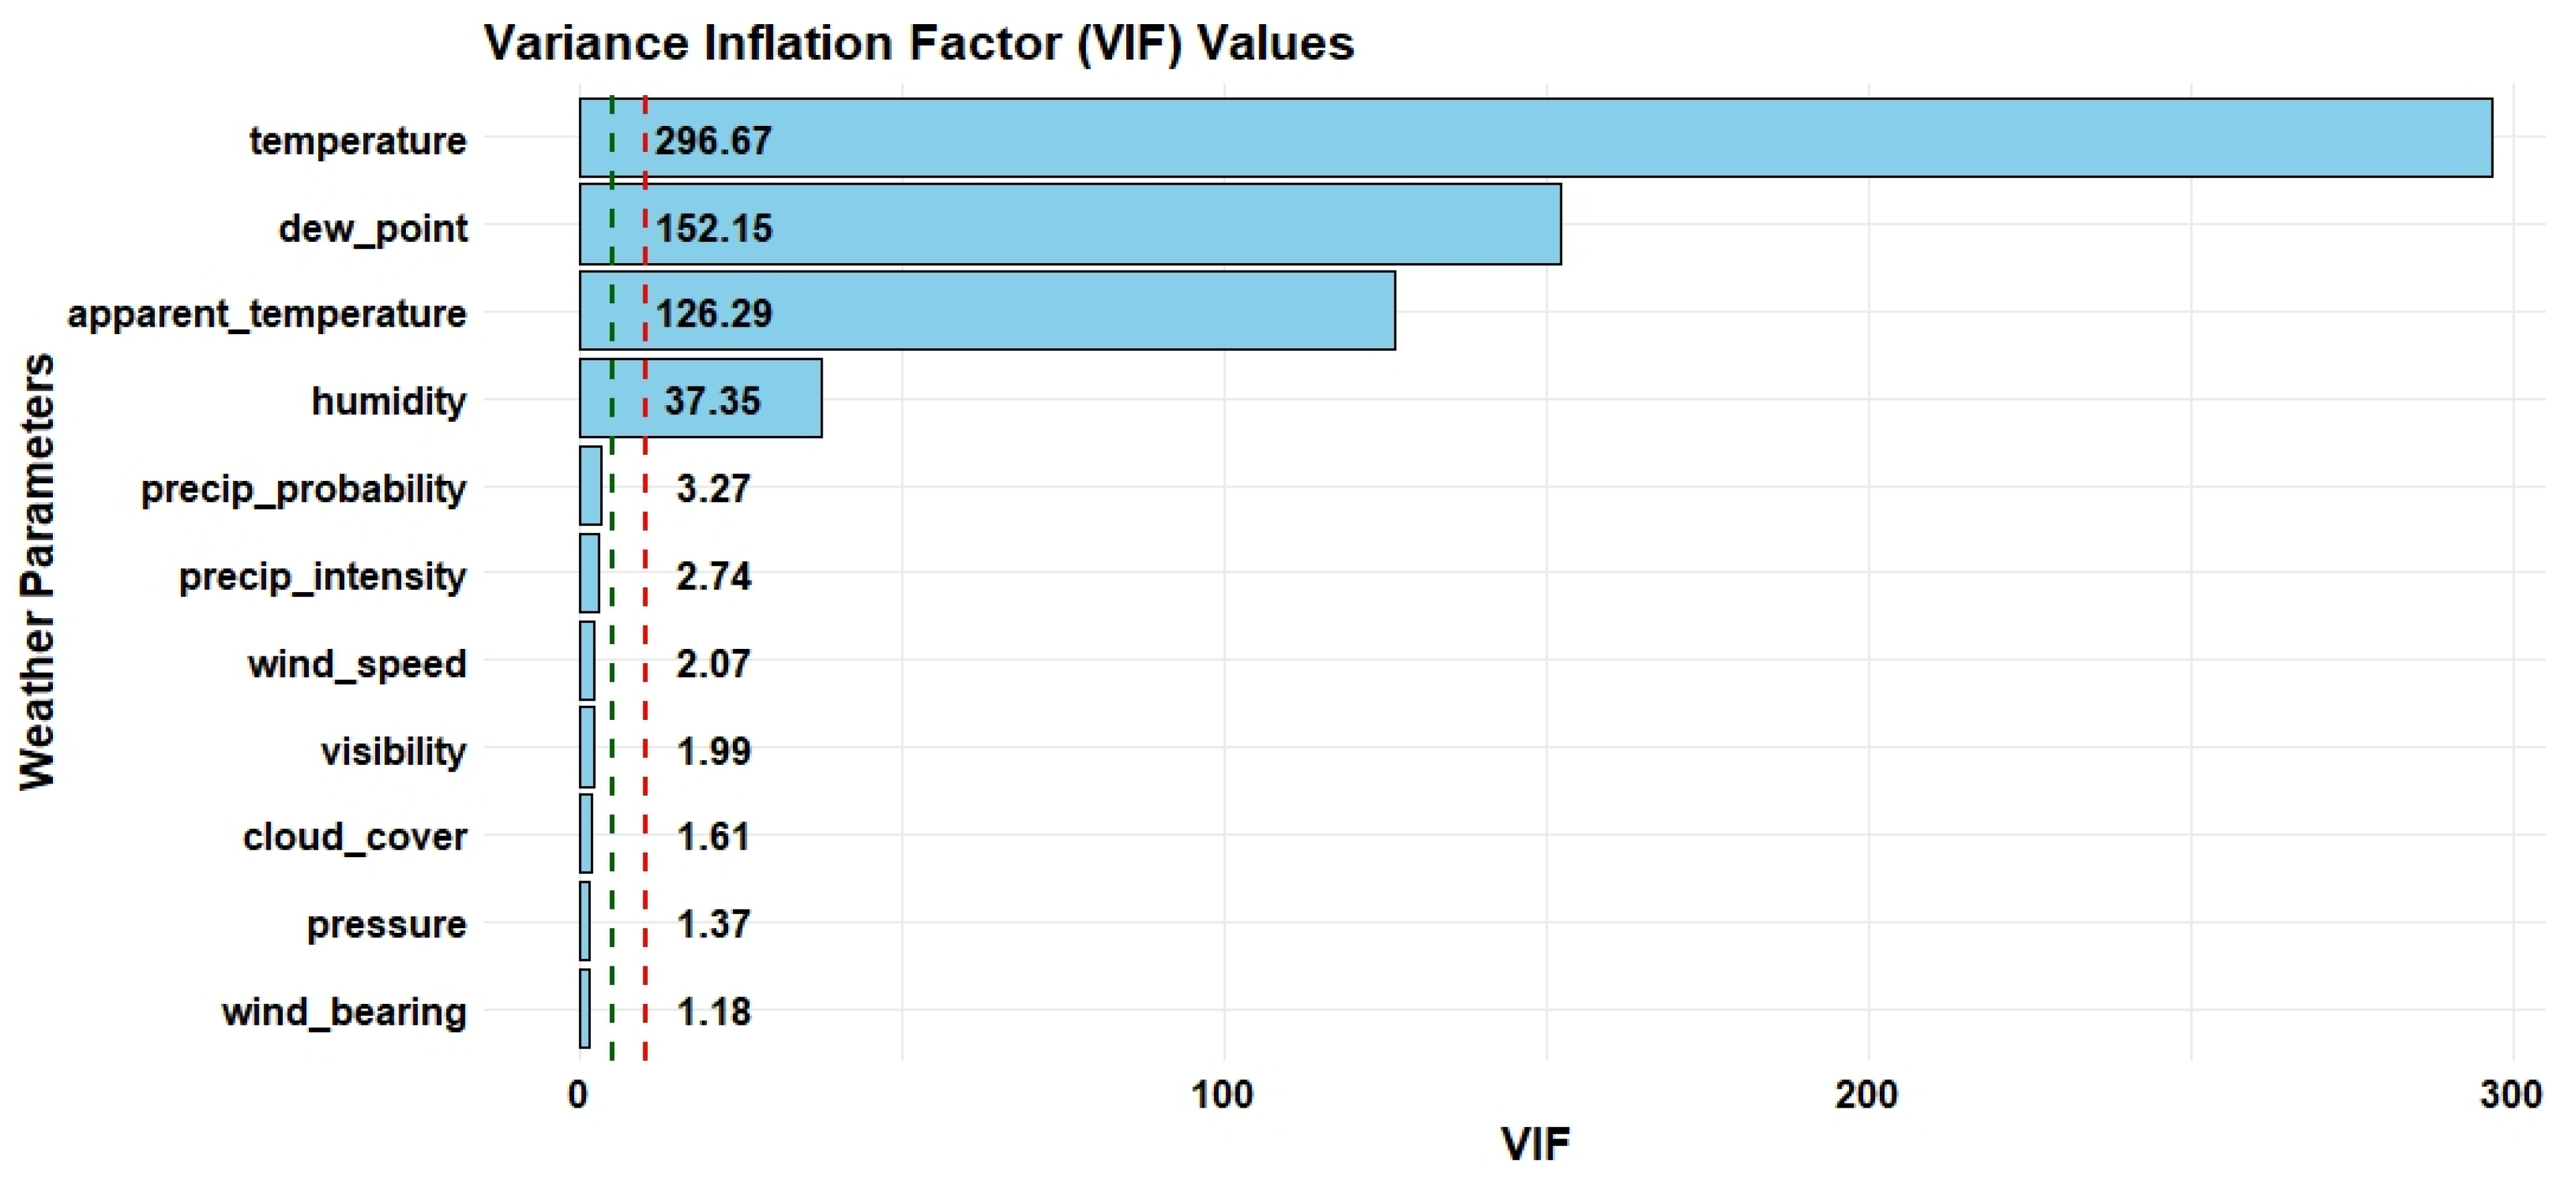
- Further, computing the VIF reveals how the correlation analysis and predictive modeling are statistically significant and practically useful. In the context of smart homes and solar energy, it leads to smarter control systems, better energy forecasting, and efficient integration of renewable energy.
5. Conclusions
- ▪
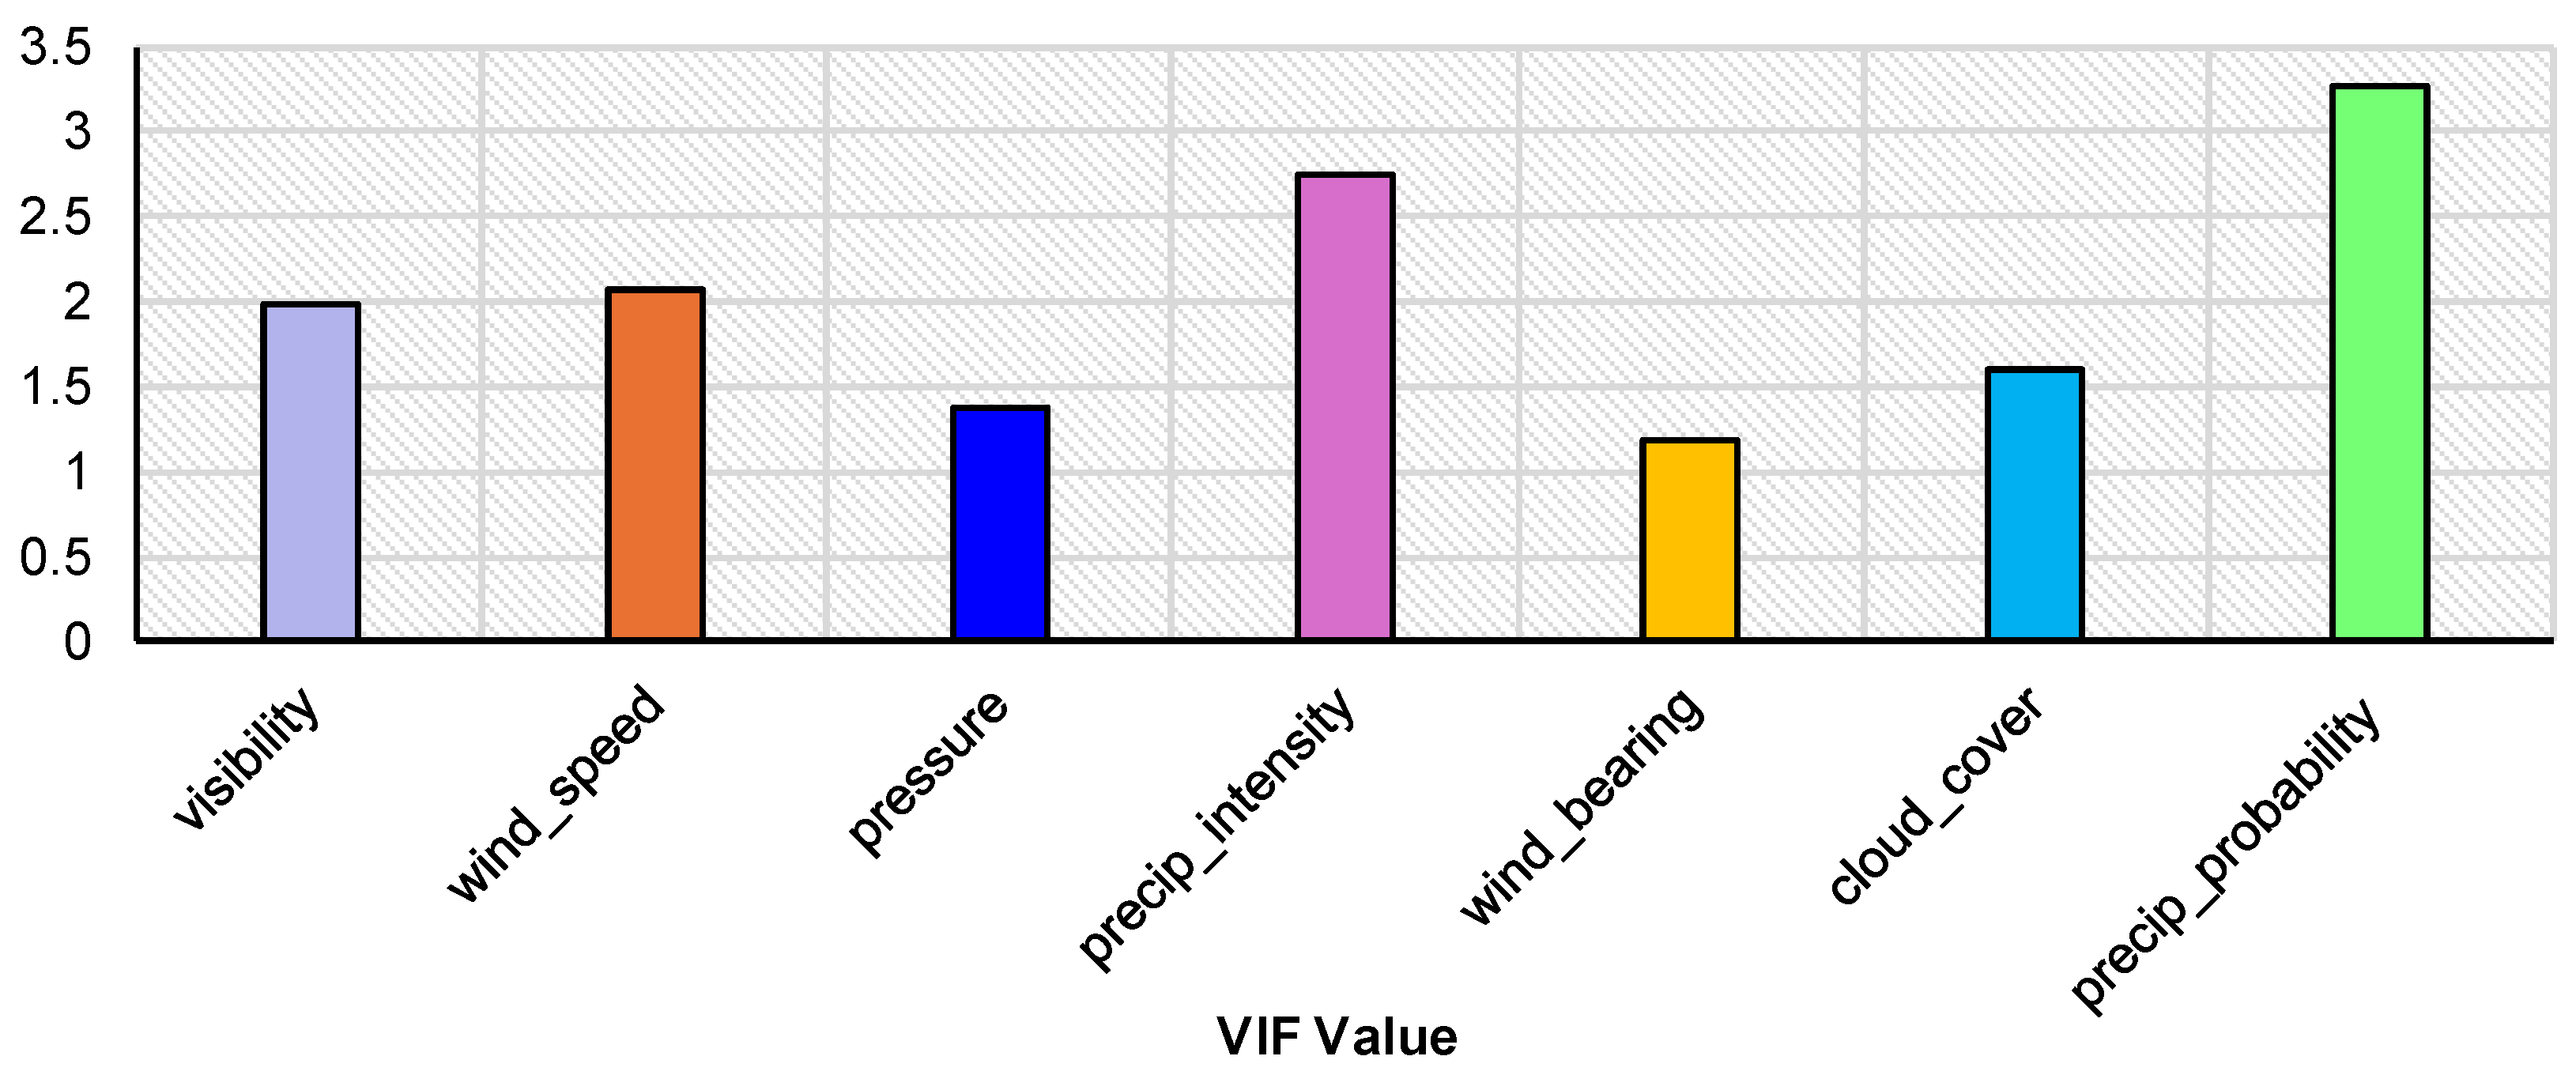
- The variables, viz., temperature, humidity, apparent_temperature, and dew_point with VIF values 296.67, 37.35, 126.29, and 152.15, are the critical weather parameters that significantly influence solar energy generation.
- ▪
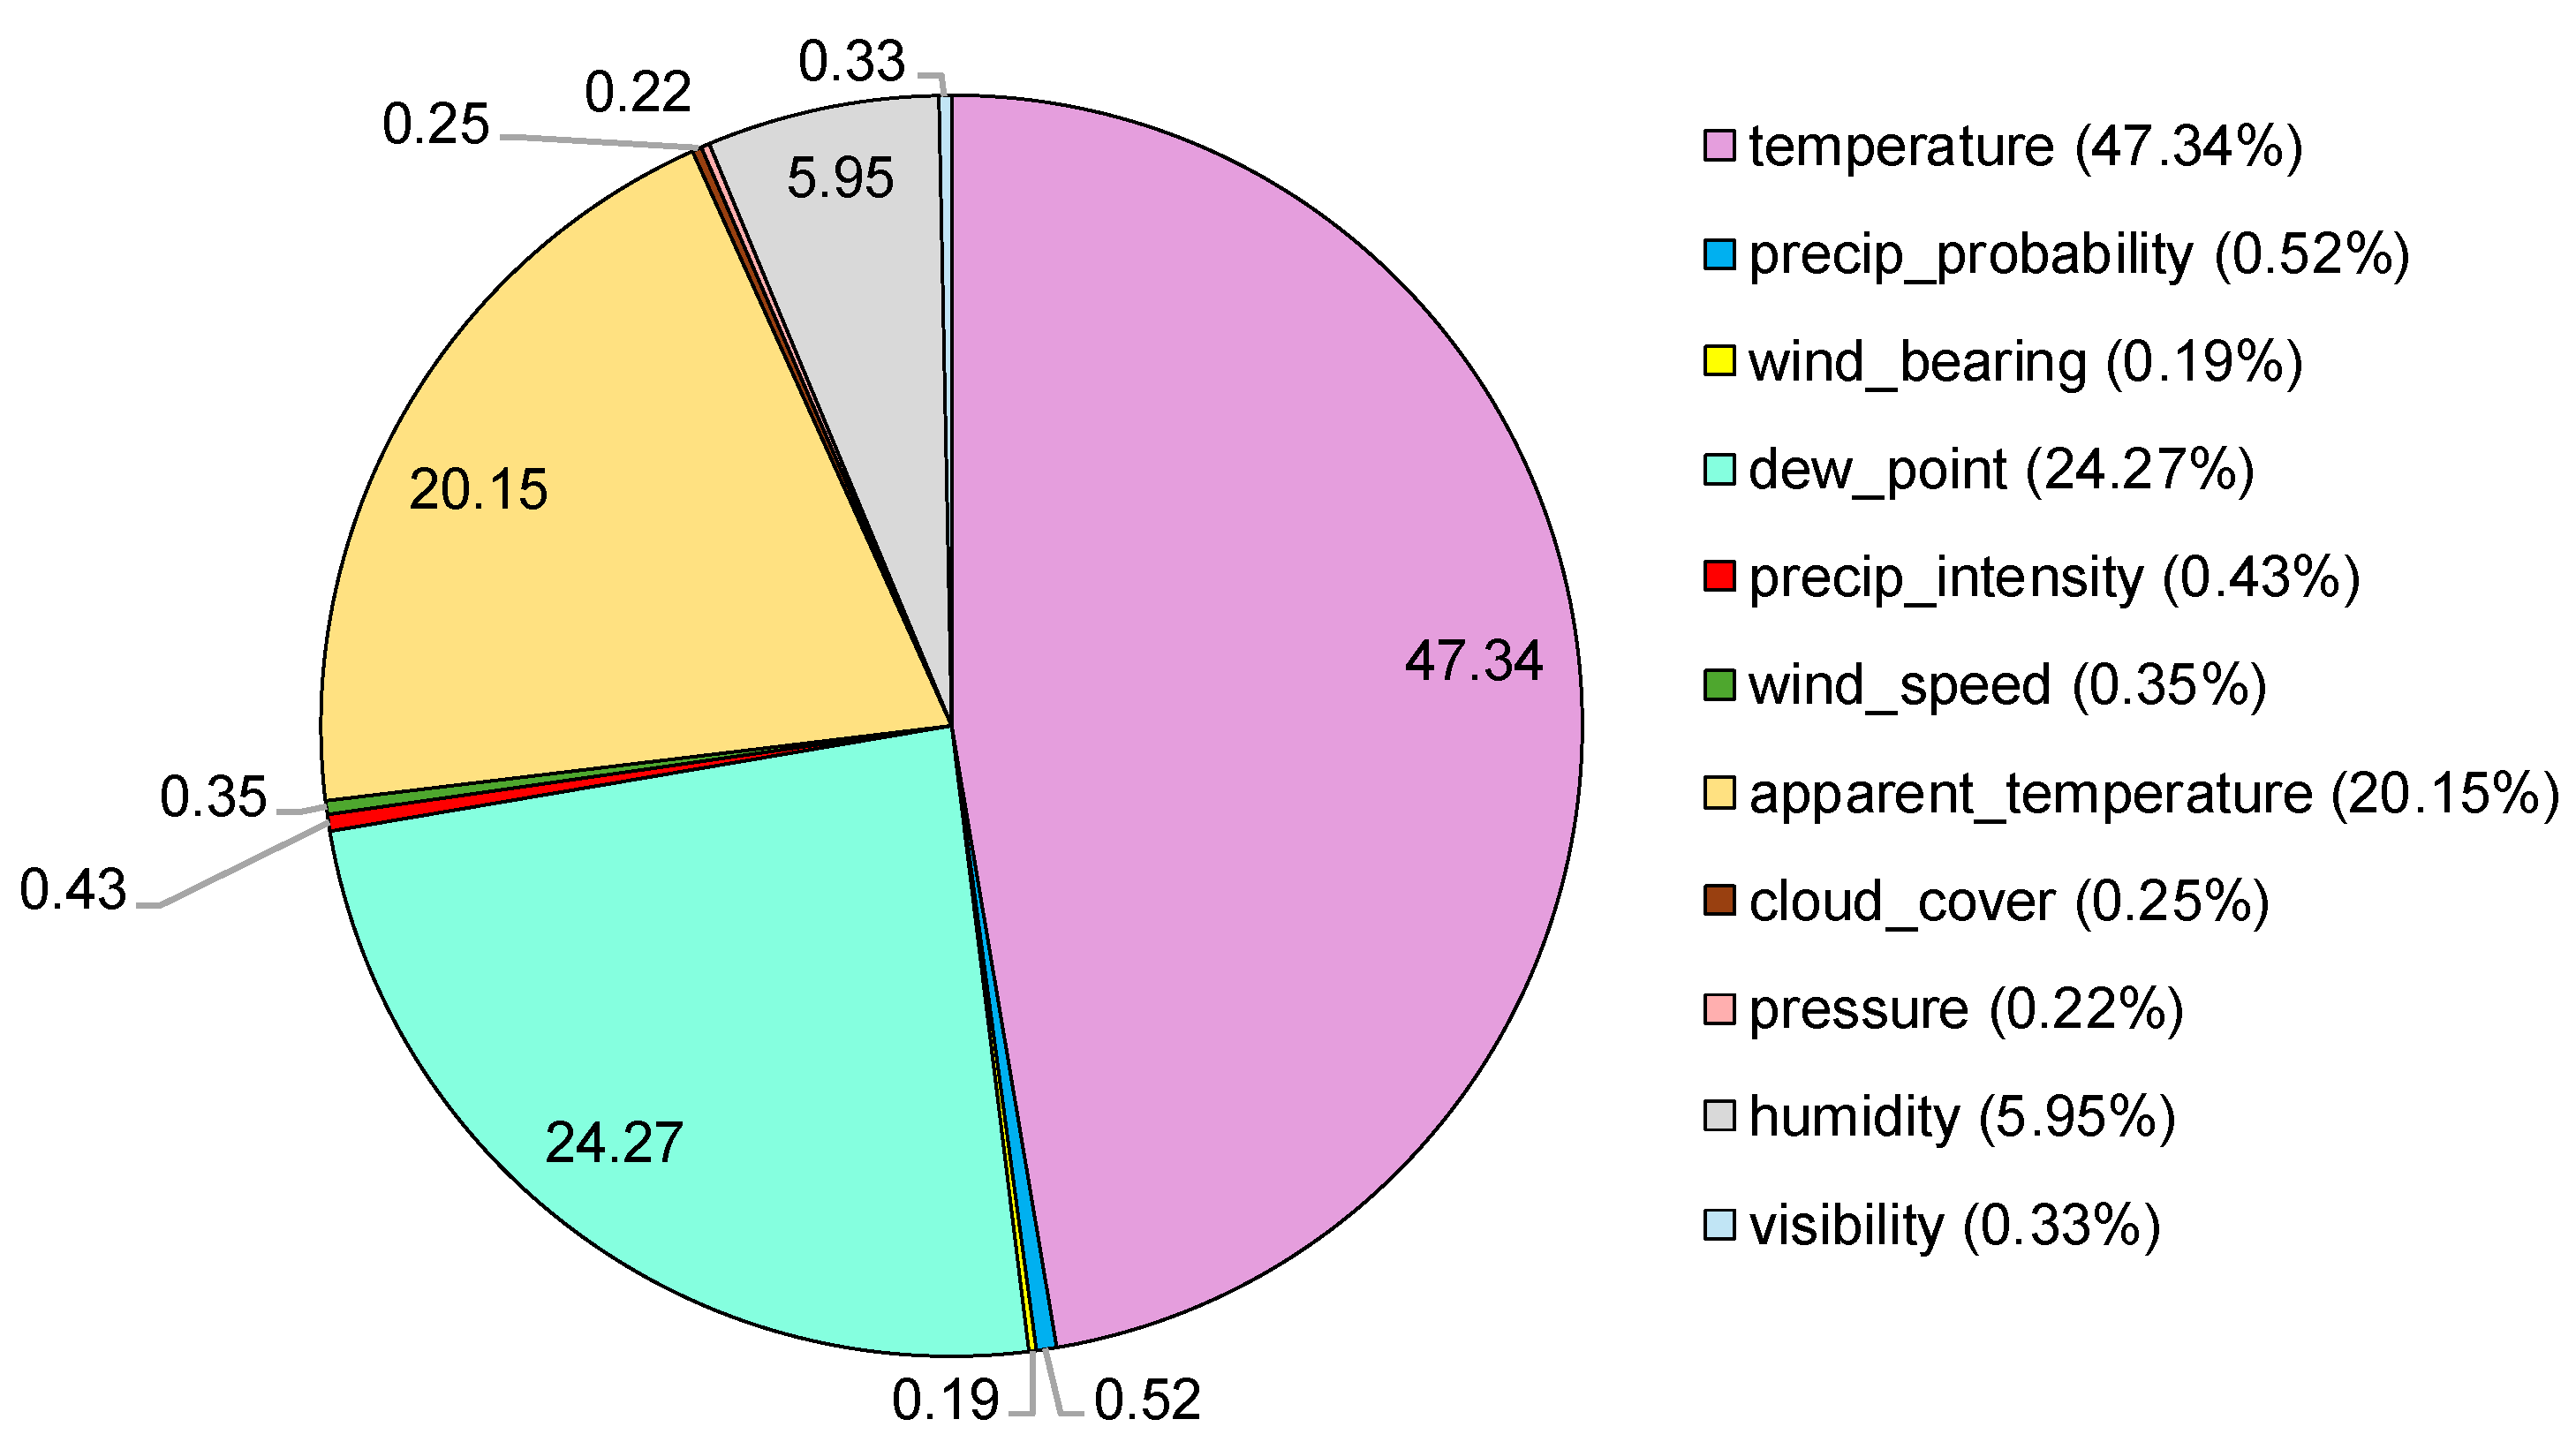
- The percentage of the criticality for temperature, apparent_temperature, and dew_point is 47.32, 20.15, and 24.27, respectively.
Author Contributions
Funding
Institutional Review Board Statement
Informed Consent Statement
Data Availability Statement
Conflicts of Interest
References
- Prakash, K.P.; Kumar, Y.V.P.; Ganesh, L.K.M.; Ramani, K. Machine Learning-Based Ensemble Classifiers for Anomaly Handling in Smart Home Energy Consumption Data. Sensors 2022, 22, 9323. [Google Scholar] [CrossRef]
- Pedro, G.G.; Juan, A.M.; Antonio, S. A Prosumer-Oriented, Interoperable, Modular and Secure Smart Home Energy Management System Architecture. Smart Cities 2022, 5, 1054–1078. [Google Scholar] [CrossRef]
- Jung, H.; Yeo, C.; Jang, E.; Chang, Y.; Song, C. Machine-Learning-Based Diabetes Classification Method Using Blood Flow Oscillations and Pearson Correlation Analysis of Feature Importance. Mach. Learn. Sci. Technol. 2024, 5, 045024. [Google Scholar] [CrossRef]
- Wang, H.; Wang, T.; Hao, Y.; Ding, S.; Feng, J. Breast Tumor Segmentation via Deep Correlation Analysis of Multi-Sequence MRI. Med. Biol. Eng. Comput. 2024, 62, 3801–3814. [Google Scholar] [CrossRef] [PubMed]
- Osborne, A.J.; Bierzynska, A.; Colby, E.; Andag, U.; Kalra, P.A.; Radresa, O.; Skroblin, P.; Taal, M.W.; Welsh, G.I.; Saleem, M.A.; et al. Multivariate Canonical Correlation Analysis Identifies Additional Genetic Variants for Chronic Kidney Disease. Npj Syst. Biol. Appl. 2024, 10, 28. [Google Scholar] [CrossRef] [PubMed]
- Zhu, L.; Xu, Z.; Wang, Y.; Cheng, C. Correlation Analysis of Energy Consumption of Agricultural Rotorcraft. Comput. Mater. Contin. 2022, 71, 3179–3192. [Google Scholar] [CrossRef]
- Zhou, B.; Li, N.; Lu, D.; Xia, J. Correlation Analysis between Economic Growth and Environmental Quality. Comput. Syst. Sci. Eng. 2022, 41, 127–140. [Google Scholar] [CrossRef]
- Li, C.; Yao, Y.; Yang, R.; Li, C.; Zhang, H. Correlation Analysis between Environmental Pressure and Vision-Based Flames from Monitoring Camera during Depressurization Process. SIViP 2022, 16, 1369–1377. [Google Scholar] [CrossRef]
- Tong, L.; Zhang, C.; Peng, Z.; Wang, L. Spatial-Temporal Distribution Characteristics and Correlation Analysis of Air Pollutants from Ships in Inland Ports. Sustainability 2022, 14, 14214. [Google Scholar] [CrossRef]
- Li, H.; Cheshmehzangi, A.; Zhang, Z.; Su, Z.; Pourroostaei Ardakani, S.; Sedrez, M.; Dawodu, A. The Correlation Analysis between Air Quality and Construction Sites: Evaluation in the Urban Environment during the COVID-19 Pandemic. Sustainability 2022, 14, 7075. [Google Scholar] [CrossRef]
- Liao, J.; Liu, Y.; Guo, C.; Zhou, N.; Wang, Q.; Kang, W.; Vasquez, J.C.; Guerrero, J.M. Power Quality of DC Microgrid: Index Classification, Definition, Correlation Analysis and Cases Study. Int. J. Electr. Power Energy Syst. 2024, 156, 109782. [Google Scholar] [CrossRef]
- Peng, D.; Liu, Y.; Wang, D.; Zhao, H.; Qu, B. Multi-Energy Load Forecasting for Integrated Energy System Based on Sequence Decomposition Fusion and Factors Correlation Analysis. Energy 2024, 308, 132796. [Google Scholar] [CrossRef]
- Widianto, A.J.; Adytia, D.; Aditya, I.A. Feature Modelling for Electricity Load Forecasting Using Hybrid EEMD-BiLSTM with Spatially Correlated Weather Data. IJIES 2024, 17, 1193–1211. [Google Scholar] [CrossRef]
- Wang, X. Correlation Analysis of Energy Consumption, Carbon Emissions and Economic Growth. Energy Inform. 2024, 7, 45. [Google Scholar] [CrossRef]
- Zhong, Y.; Li, T.; Przystupa, K.; Lin, C.; Yang, G.; Yang, S.; Kochan, O.; Sikora, J. Spatiotemporal Correlation Analysis for Predicting Current Transformer Errors in Smart Grids. Energies 2024, 17, 1608. [Google Scholar] [CrossRef]
- Zhou, J.; Tuo, J.; Wang, L.; Shi, Y.; Zha, W. Calculation of Electricity Sales Based on Multi-Factor Correlation Analysis. Front. Energy Res. 2023, 11, 1326100. [Google Scholar] [CrossRef]
- Rehman, A.; Haseeb, K.; Jeon, G.; Bahaj, S.A. Secure Edge-Based Energy Management Protocol in Smart Grid Environments with Correlation Analysis. Sensors 2022, 22, 9236. [Google Scholar] [CrossRef]
- Fei, Y.; Leigang, S.; Juanle, W. Monthly Variation and Correlation Analysis of Global Temperature and Wind Resources under Climate Change. Energy Convers. Manag. 2023, 285, 116992. [Google Scholar] [CrossRef]
- Wang, Y.; Wang, J.; Cao, M.; Li, W.; Yuan, L.; Wang, N. Prediction Method of Wind Farm Power Generation Capacity Based on Feature Clustering and Correlation Analysis. Electr. Power Syst. Res. 2022, 212, 108634. [Google Scholar] [CrossRef]
- Wang, W.; Qin, C.; Zhang, J.; Wen, C.; Xu, G. Correlation Analysis of Three-Parameter Weibull Distribution Parameters with Wind Energy Characteristics in a Semi-Urban Environment. Energy Rep. 2022, 8, 8480–8498. [Google Scholar] [CrossRef]
- Xiang, Y.; Tang, Q.; Xu, W.; Hu, S.; Zhao, P.; Guo, J.; Liu, J. A Multi-Factor Spatio-Temporal Correlation Analysis Method for PV Development Potential Estimation. Renew. Energy 2024, 223, 119962. [Google Scholar] [CrossRef]
- Sharma, S.; Malik, P.; Sinha, S. The Impact of Soiling on Temperature and Sustainable Solar PV Power Generation: A Detailed Analysis. Renew. Energy 2024, 237, 121864. [Google Scholar] [CrossRef]
- Du, X.; Lang, Z.; Liu, M.; Wu, J. Regression Analysis and Prediction of Monthly Wind and Solar Power Generation in China. Energy Rep. 2024, 12, 1385–1402. [Google Scholar] [CrossRef]
- Issaq, S.Z.; Talal, S.K.; Azooz, A.A. Effects of Varying Weather Parameters on Solar Still Performance. Desalination Water Treat. 2023, 298, 12–22. [Google Scholar] [CrossRef]
- Gholami, A.; Ameri, M.; Zandi, M.; Gavagsaz Ghoachani, R.; Jafarzadegan Gerashi, S.; Kazem, H.A.; Al-Waeli, A.H.A. Impact of Harsh Weather Conditions on Solar Photovoltaic Cell Temperature: Experimental Analysis and Thermal-Optical Modeling. Sol. Energy 2023, 252, 176–194. [Google Scholar] [CrossRef]
- Gopi, A.; Sharma, P.; Sudhakar, K.; Ngui, W.K.; Kirpichnikova, I.; Cuce, E. Weather Impact on Solar Farm Performance: A Comparative Analysis of Machine Learning Techniques. Sustainability 2022, 15, 439. [Google Scholar] [CrossRef]
- Son, Y.; Yoon, Y.; Cho, J.; Choi, S. Cloud Cover Forecast Based on Correlation Analysis on Satellite Images for Short-Term Photovoltaic Power Forecasting. Sustainability 2022, 14, 4427. [Google Scholar] [CrossRef]
- Pilario, K.E.S.; Ibañez, J.A.; Penisa, X.N.; Obra, J.B.; Odulio, C.M.F.; Ocon, J.D. Spatio-Temporal Solar–Wind Complementarity Assessment in the Province of Kalinga-Apayao, Philippines Using Canonical Correlation Analysis. Sustainability 2022, 14, 3253. [Google Scholar] [CrossRef]
- Smart Home Dataset with Weather Information. Available online: https://www.kaggle.com/datasets/taranvee/smart-home-dataset-with-weather-information (accessed on 6 April 2025).


| Year [Ref] | Aim | Methodology | Key Conclusion of the Work |
|---|---|---|---|
| 2024 [3] |
|
|
|
| 2024 [4] |
|
|
|
| 2024 [5] |
|
|
|
| 2022 [6] |
|
|
|
| 2022 [7] |
|
|
|
| 2022 [8] |
|
|
|
| 2022 [9] |
|
|
|
| 2022 [10] |
|
|
|
| 2024 [11] |
|
|
|
| 2024 [12] |
|
|
|
| 2024 [13] |
|
|
|
| 2024 [14] |
|
|
|
| 2024 [15] |
|
|
|
| 2023 [16] |
|
|
|
| 2022 [17] |
|
|
|
| 2023 [18] |
|
|
|
| 2022 [19] |
|
|
|
| 2022 [20] |
|
|
|
| 2024 [21] |
|
|
|
| 2024 [22] |
|
|
|
| 2024 [23] |
|
|
|
| 2023 [24] |
|
|
|
| 2023 [25] |
|
|
|
| 2022 [26] |
|
|
|
| 2022 [27] |
|
|
|
| 2022 [28] |
|
|
|
| Dependent Variable | Independent Variables |
|---|---|
| solar_gen | temperature, visibility, pressure, humidity, wind_speed, wind_bearing, precip_probability, precip_intensity, apparent_temperature, cloud_cover, dew_point |
| Term | Estimate | Std Error | p-Value |
|---|---|---|---|
| (Intercept) | 0.0065 | 0.028 | 0.818 |
| temperature | −0.0031 | 0.0002 | 0 |
| humidity | −0.184 | 0.0056 | 0 |
| visibility | −0.003 | 0.0002 | 0 |
| apparent_temperature | 0.0003 | 0.0001 | 0.0002 |
| wind_speed | −0.0021 | 0.0001 | 0 |
| pressure | 0.0002 | 0 | 0 |
| wind_bearing | 0 | 0 | 0 |
| cloud_cover | −0.0024 | 0.0008 | 0.0023 |
| precip_intensity | −0.129 | 0.0264 | 0 |
| dew_point | 0.0035 | 0.0001 | 0 |
| precip_probability | 0.0415 | 0.002 | 0 |
| S. No. | Weather Parameter | VIF Value | VIF Value > 10 | Status (C: Critical; NC: Non-Critical) |
|---|---|---|---|---|
| 1 | temperature | 296.67 | Yes | C |
| 2 | humidity | 37.35 | Yes | C |
| 3 | visibility | 1.99 | No | NC |
| 4 | apparent_temperature | 126.29 | Yes | C |
| 5 | wind_speed | 2.07 | No | NC |
| 6 | pressure | 1.37 | No | NC |
| 7 | wind_bearing | 1.18 | No | NC |
| 8 | cloud_cover | 1.61 | No | NC |
| 9 | precip_intensity | 2.74 | No | NC |
| 10 | dew_point | 152.15 | Yes | C |
| 11 | precip_probability | 3.27 | No | NC |
| S. No. | Weather Parameter | Criticality (%) |
|---|---|---|
| 1 | temperature | 47.32 |
| 2 | humidity | 5.95 |
| 3 | visibility | 0.31 |
| 4 | apparent_temperature | 20.15 |
| 5 | wind_speed | 0.33 |
| 6 | pressure | 0.21 |
| 7 | wind_bearing | 0.18 |
| 8 | cloud_cover | 0.25 |
| 9 | precip_intensity | 0.43 |
| 10 | dew_point | 24.27 |
| 11 | precip_probability | 0.52 |
Disclaimer/Publisher’s Note: The statements, opinions and data contained in all publications are solely those of the individual author(s) and contributor(s) and not of MDPI and/or the editor(s). MDPI and/or the editor(s) disclaim responsibility for any injury to people or property resulting from any ideas, methods, instructions or products referred to in the content. |
© 2025 by the authors. Licensee MDPI, Basel, Switzerland. This article is an open access article distributed under the terms and conditions of the Creative Commons Attribution (CC BY) license (https://creativecommons.org/licenses/by/4.0/).
Share and Cite
Kasaraneni, P.P.; Venkata Pavan Kumar, Y.; Pradeep Reddy, G. Multiple Linear Regression-Based Correlation Analysis of Various Critical Weather Factors and Solar Energy Generation in Smart Homes. Eng. Proc. 2025, 87, 106. https://doi.org/10.3390/engproc2025087106
Kasaraneni PP, Venkata Pavan Kumar Y, Pradeep Reddy G. Multiple Linear Regression-Based Correlation Analysis of Various Critical Weather Factors and Solar Energy Generation in Smart Homes. Engineering Proceedings. 2025; 87(1):106. https://doi.org/10.3390/engproc2025087106
Chicago/Turabian StyleKasaraneni, Purna Prakash, Yellapragada Venkata Pavan Kumar, and Gogulamudi Pradeep Reddy. 2025. "Multiple Linear Regression-Based Correlation Analysis of Various Critical Weather Factors and Solar Energy Generation in Smart Homes" Engineering Proceedings 87, no. 1: 106. https://doi.org/10.3390/engproc2025087106
APA StyleKasaraneni, P. P., Venkata Pavan Kumar, Y., & Pradeep Reddy, G. (2025). Multiple Linear Regression-Based Correlation Analysis of Various Critical Weather Factors and Solar Energy Generation in Smart Homes. Engineering Proceedings, 87(1), 106. https://doi.org/10.3390/engproc2025087106


