Abstract
AISI 304L is a low-carbon austenitic stainless steel widely used in common engineering applications, according to its good mechanical properties such as high ductility, corrosion resistance, and easy weldability. This material is adopted in various environmental conditions, such as pressure vessels or in pipelines where fluid temperature variations occur and affect its mechanical behavior. Nowadays, the applications of advanced investigation methodologies, such as infrared thermography, are widely adopted for the rapid analysis of the fatigue properties of common materials, especially metals. In this work, fatigue properties were evaluated on AISI304L specimens having two different microstructural states, one in the as-received condition and the other one after solution annealing. Fatigue test campaigns were performed with the application of the Risitano Thermographic Method. The microscopic analysis highlights the differences in the microstructure before and after the heat treatment. The characteristics of the microstructures are the main ones responsible for the different fatigue behavior obtained with experimental tests. The Thermographic Method proved to be a valid rapid approach for the fatigue analysis, confirming that the annealing process led to an improvement in the fatigue strength of the material.
1. Introduction
AISI 304L austenitic stainless steel is widely used in critical industrial applications, such as the aerospace, chemical, petroleum, and nuclear industries [1,2,3,4], due to its excellent mechanical properties, corrosion resistance, and good machinability. Its mechanical properties, especially fatigue strength, are of primary importance for applications where components are subjected to cyclic loads. The fatigue strength of this material can be affected by several factors, including microstructure, cold working, and heat treatments, such as solution annealing [5,6,7]. Solution annealing treatment, commonly employed to reduce residual stresses and restore ductility, leads to a significant change in the microstructure of the material [8,9,10]. This process involves the dissolution of the carbides, leading to better corrosion resistance, although grain coarsening would lead to worse mechanical properties [11]. However, the comparison between the fatigue properties of 304L steel in the base condition and after solution annealing treatment has so far been little explored in the literature with regard to their microstructure, and this represents an area of interest to better understand the long-term behavior of critical components. Several studies have shown that microstructure and microscopic imperfections, such as surface defects, grain size, and the presence of secondary phases, have a significant impact on the fatigue behavior of 304L stainless steel [5,6,12,13,14].
Differences in the fatigue life of materials caused by different microstructural characteristics can be quickly assessed using Risitano Thermographic Methods (RTMs). The measurement of energy release in specimens during cyclic loads over time is widely used for the estimation of the mechanical properties of several types of materials, and also in the case of notched components or components produced using additive manufacturing techniques, which are characterized by numerous imperfections related to the fabrication technique and a microstructural investigation is necessary to understand the causes of failure [15,16].
The objective of this study is to analyze and compare the fatigue properties of 304L steel under two different microstructural conditions: in the as-received condition and after solution annealing treatment. Based on microstructural analyses using advanced electron microscopy techniques such as EDS (energy-dispersive X-ray spectroscopy) and EBSD (electron backscatter diffraction), cyclic fatigue tests were performed on specimens in both states. The analysis of the energetic release of the specimens by means of the Thermographic Method led to a rapid estimation of the fatigue limits of the materials. The influence of microstructural differences is discussed to understand the variation in the fatigue life between these material states.
2. Materials and Methods
2.1. AISI 304L
The material used for the study is AISI 304L stainless steel in the form of hot-rolled and annealed sheets 20 mm thick. The same material was used in previous works by some authors [5,6] so the microstructures characteristics are reported in this article. The chemical composition of the material is shown in Table 1; it is possible to see the typical low-carbon content indicated by the L in the steel name.

Table 1.
The chemical composition of AISI 304L provided by the manufacturer (in wt.%) [1].
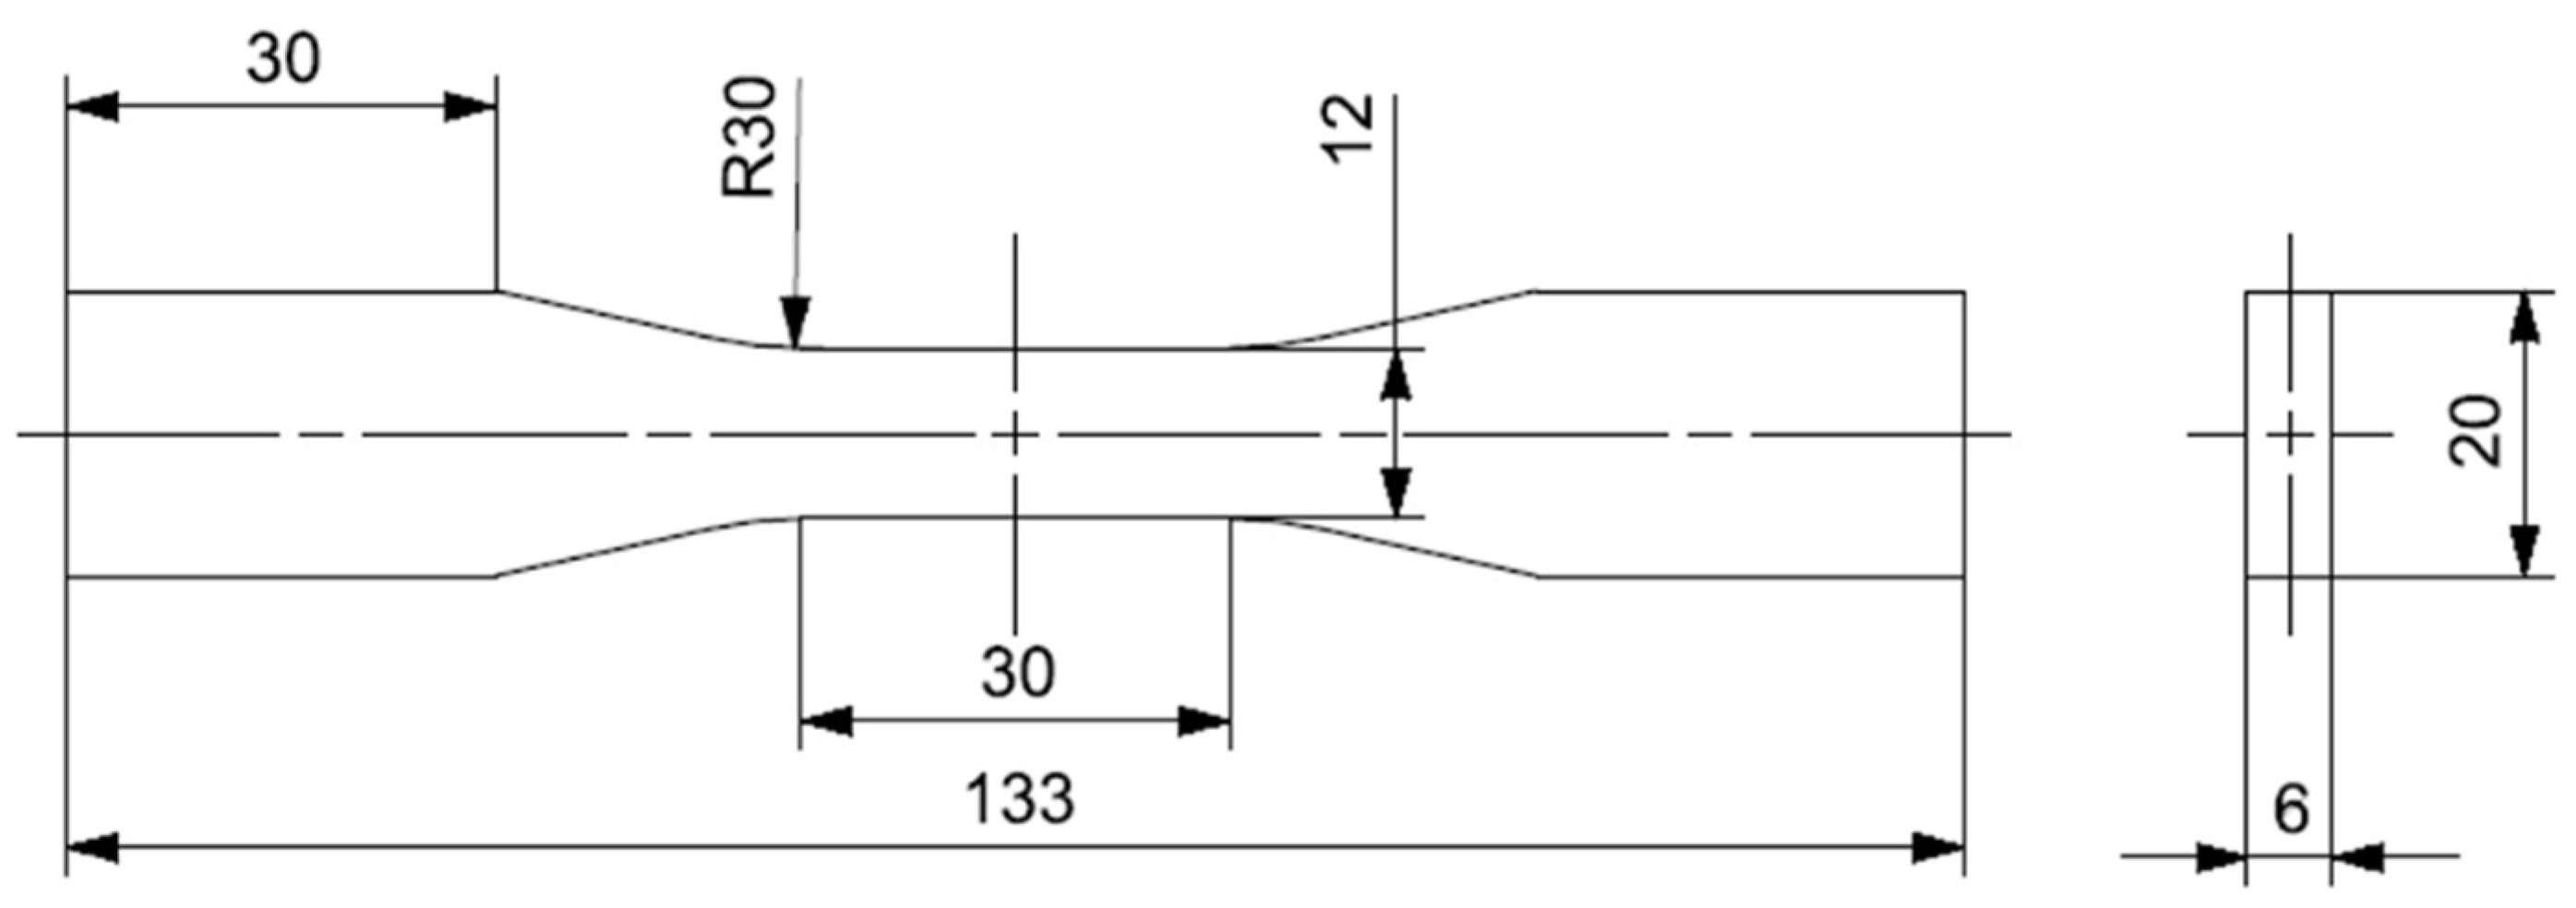
Raw material specimens defined as “as received” (AR) and specimens after solution annealing heat treatment (SA) were studied. The solution annealing process took place at 1050 °C for 30 min in a nitrogen-protected atmosphere with subsequent cooling in a nitrogen flow. Dog-bone test specimens whose geometry is shown in Figure 1 were used for fatigue tests using the servo-hydraulic testing machine MTS810 with a load cell of 250 kN.
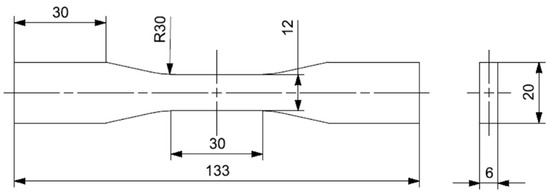
Figure 1.
Geometry of AISI 304L dog-bone specimens.
The surface temperature trend was monitored with an infrared camera, model FLIR A40, and the thermal signal was extracted using a rectangular region of interest (ROI) positioned over the fracture area, which always occurred in the middle of the specimen’s length in each test. Before the test, the surface specimen was covered with a thin layer of matte black paint to increase its thermal emissivity. The thermal signal was then processed using Matlab® software (version R2024b) to remove outliers and present results. Three specimens for each material state were tested for the fatigue tests.
The fatigue tests with the application of the Risitano Thermographic Method were carried out at the laboratories of the Engineering Department of the University of Messina.
2.2. Risitano Thermographic Method
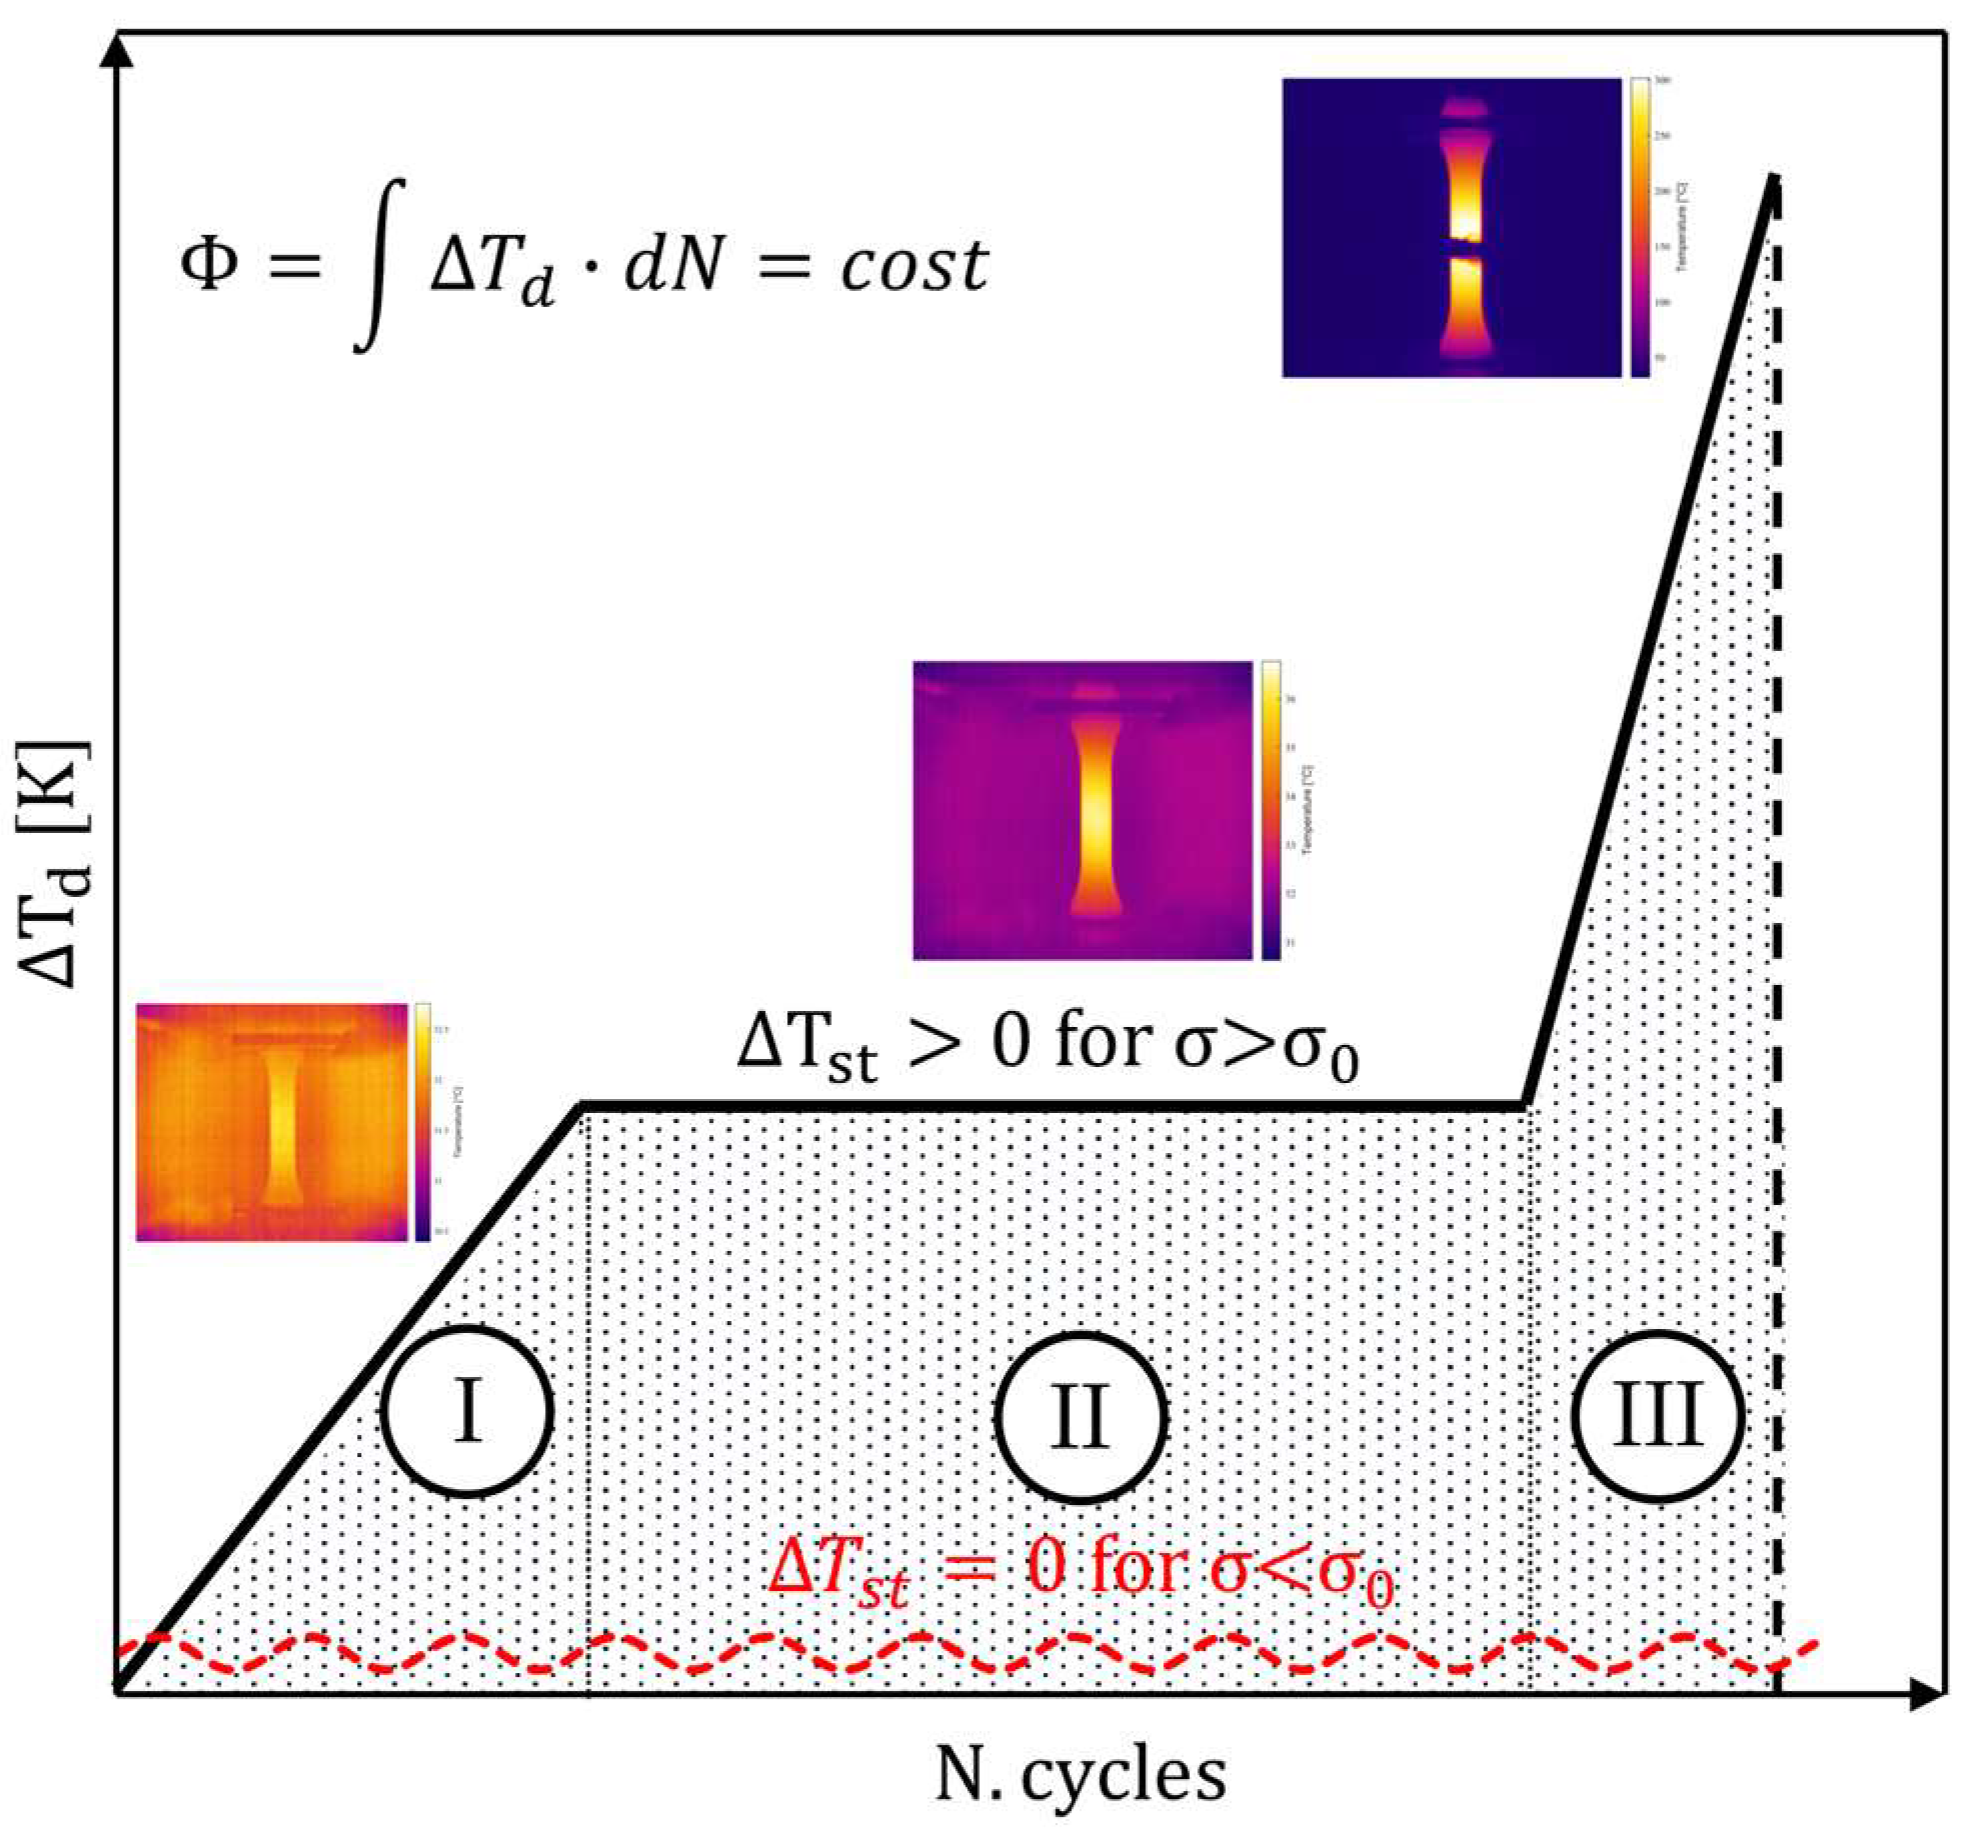
During fatigue tests, energy dissipation phenomena occur from the specimen to the surrounding environment. In 2000, La Rosa and Risitano [17] monitored the surface temperature of a specimen during a constant-amplitude test using an infrared camera. They noted that the temperature trend is characterized by three phases (Figure 2):

Figure 2.
Evolution of the specimen’s surface temperature through three phases during a constant-amplitude fatigue test. Phase I: Initial temperature increase. Phase II: Temperature stabilization region. Phase III: Final temperature increase leading to specimen failure.
- Phase I: an initial rapid increment of the temperature.
- Phase II: a stabilization temperature level ΔTst, defined by a plateau region.
- Phase III: a very high further increase in temperature until the failure of the specimen.
For the stress level under the fatigue limit of the material, no notable temperature increment can be appreciated and the temperature variation could be assumed as negligible.
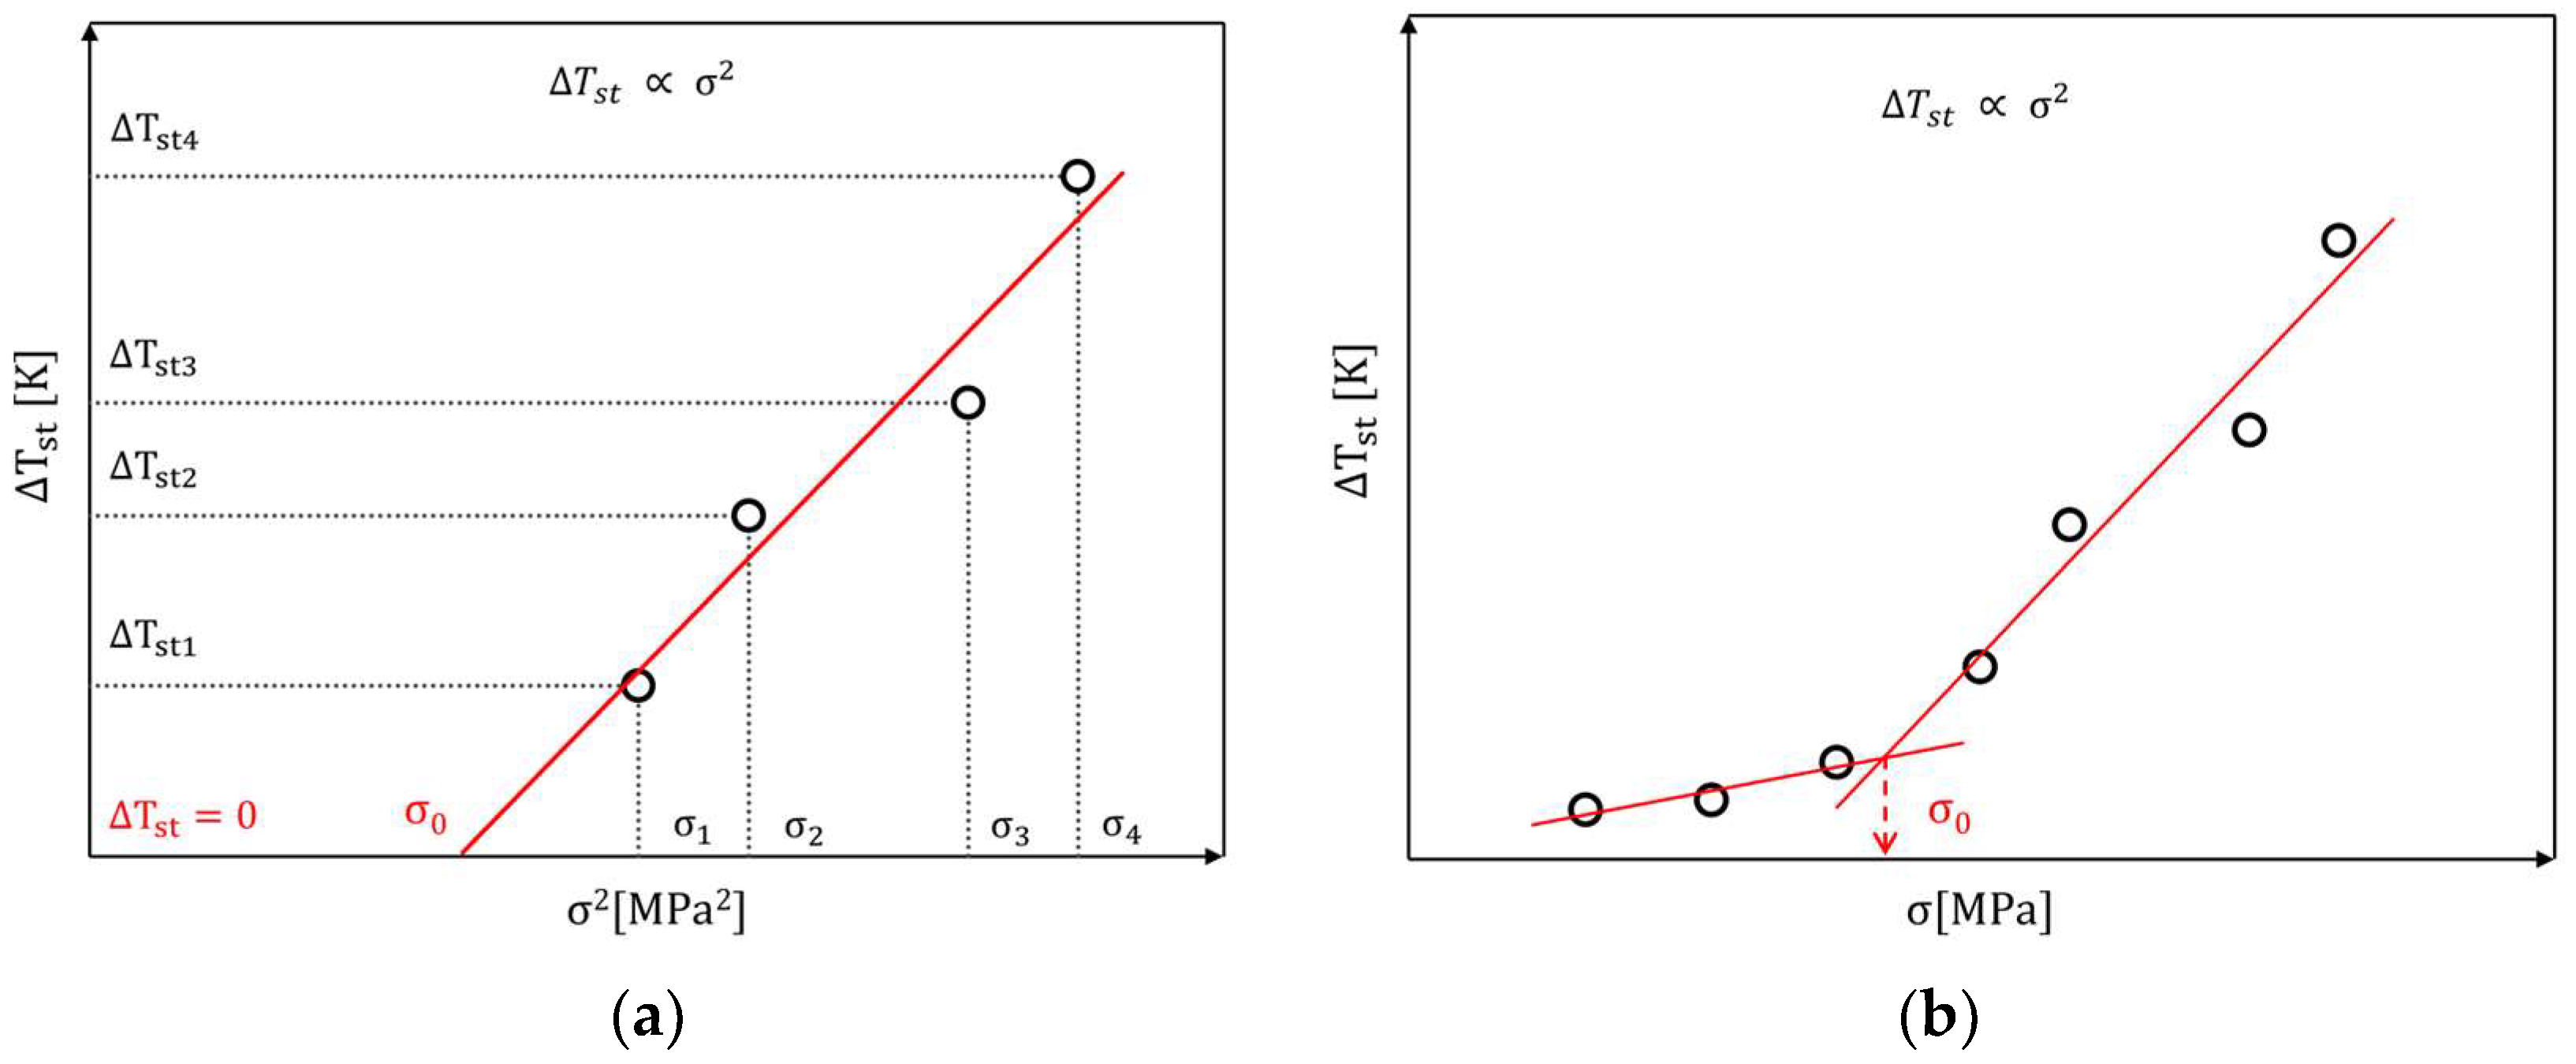
Reporting in graph form the stabilization temperature versus the square of the different applied stress levels, it is possible to estimate the fatigue limit as the intersection of the stress axis (ΔTst = 0) as shown in Figure 3a.
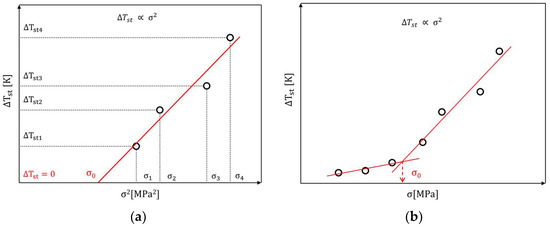
Figure 3.
Fatigue limit estimation by RTM using (a) one or (b) two fitting curves.
Other strategies for estimating the fatigue limit of materials have been proposed by Luong [18,19,20], considering for the first time not only temperature increases above the fatigue limit. For the stress level below the fatigue limit, it has been observed that some materials may exhibit a temperature increment that cannot be considered negligible, so the fatigue limit estimation must be assessed from the intersection of two fitting curves, one with data below and one above the fatigue limit (Figure 3b). The accuracy of the fatigue limit determination can be improved by using iterative algorithms based on maximizing the correlation coefficient of the regression curve or minimizing a threshold error, as proposed by Curà et al. [21].
The amount of energy released by the material during the fatigue test can be evaluated as the integral of the temperature variation with respect to the number of cycles, called the energy parameter Φ, shown in Figure 2. This energy can be assumed as a constant parameter, which characterizes the material fatigue life. As the applied stress increases, the stabilization temperature increases, but the energy parameter will remain constant for that material. From this consideration, a single specimen can be used to characterize the fatigue properties of the material.
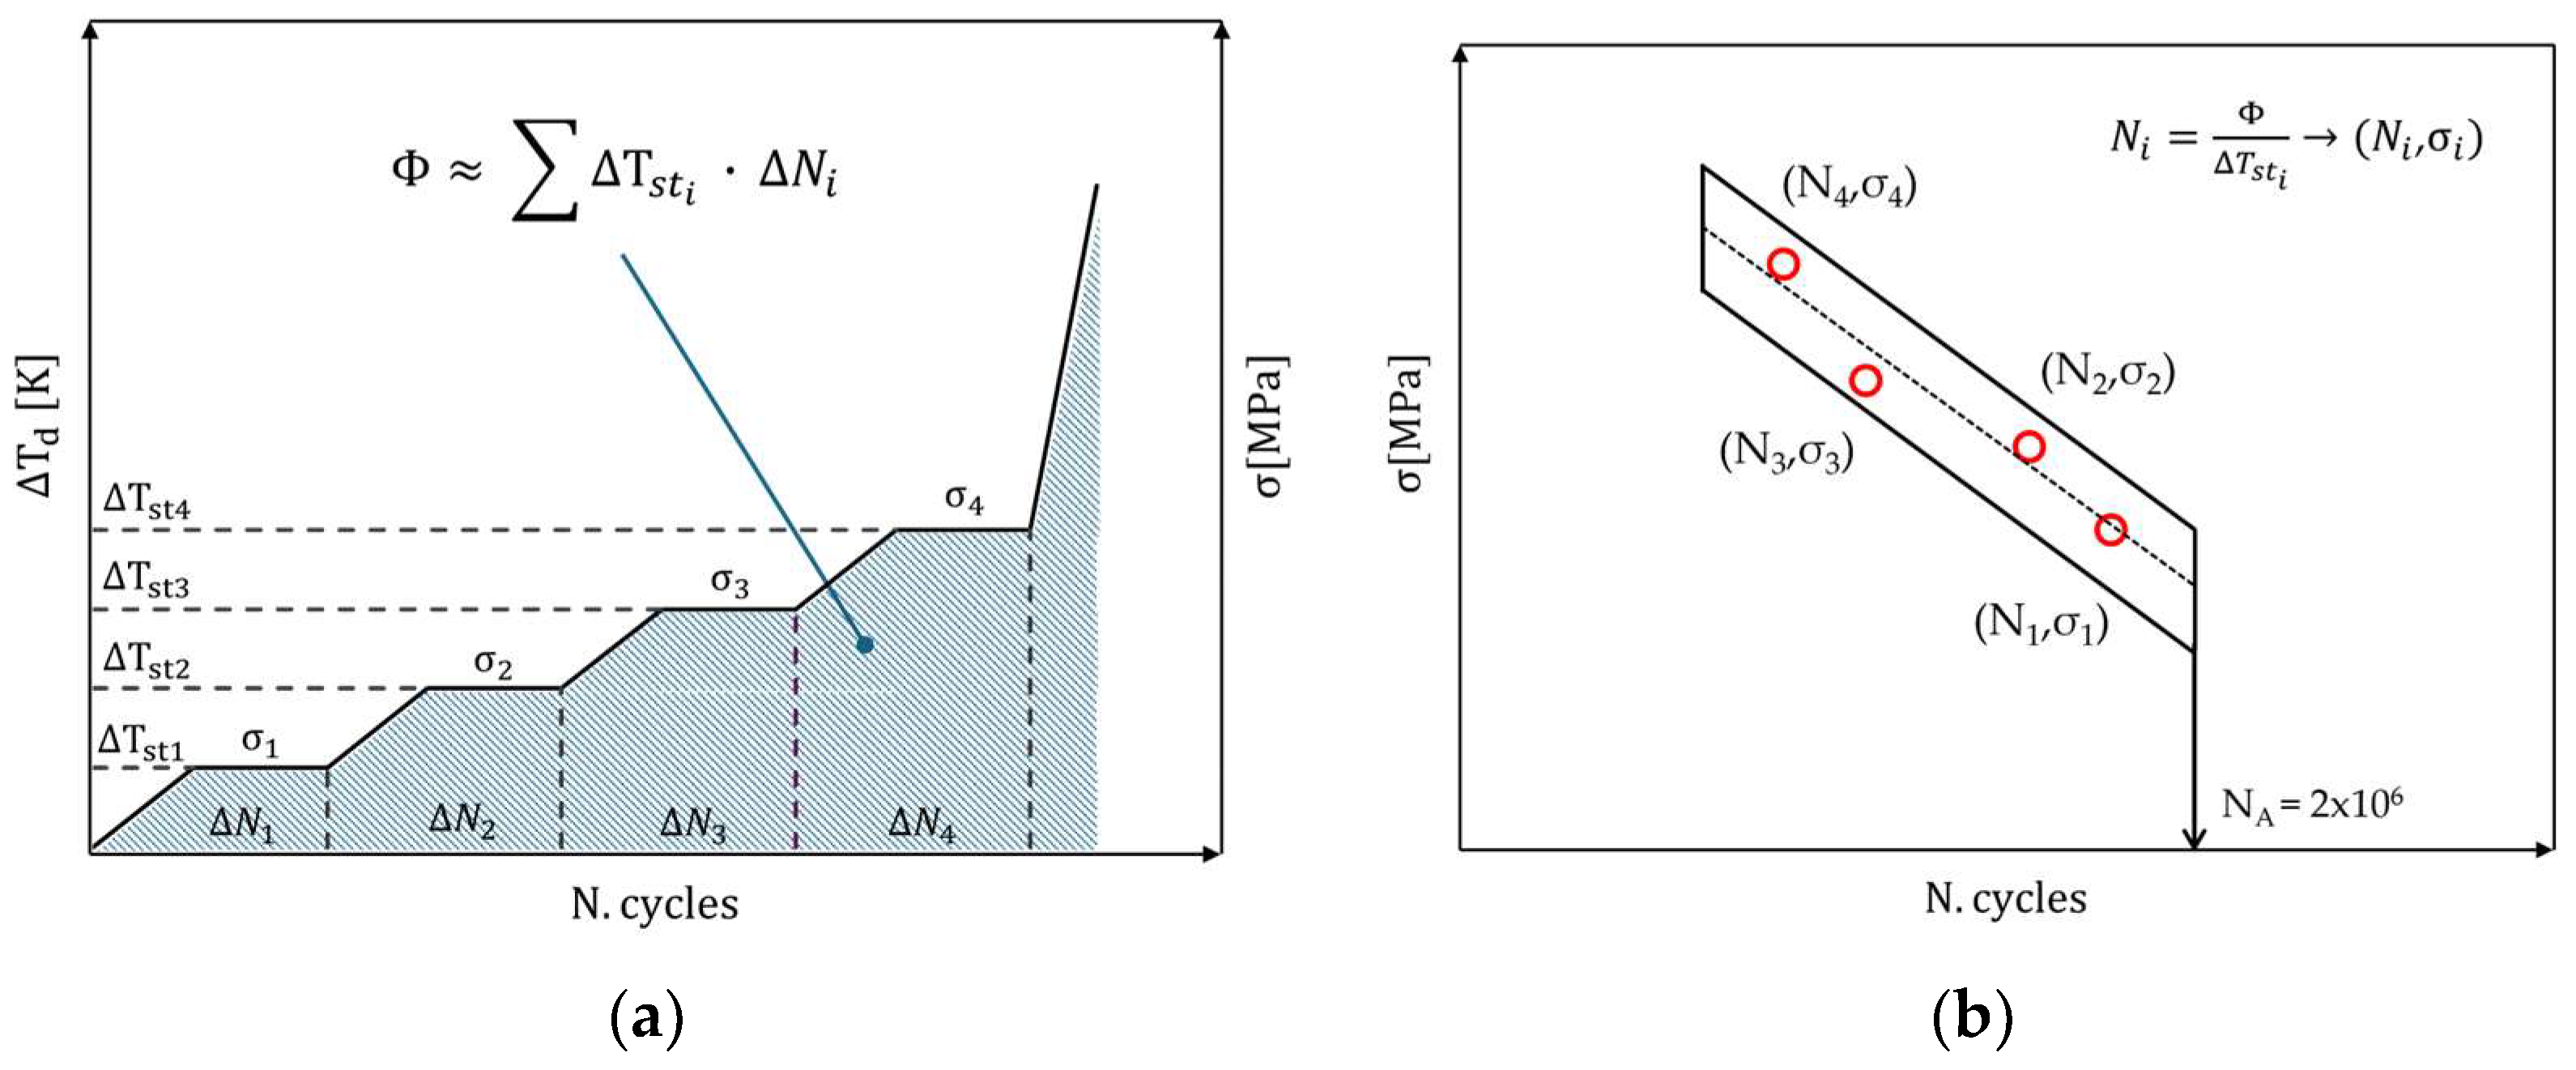
A fatigue test can be performed with increasing stress levels (stepwise test), as shown in Figure 4a, to define the stabilization temperatures for each stress level. Furthermore, the evaluation of the energy parameter Φ allows the estimation of the S-N curve (Figure 4b).
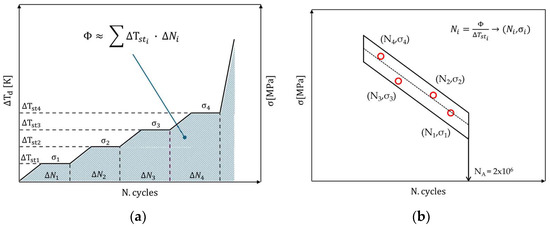
Figure 4.
(a) Temperature trend during stepwise fatigue test; (b) S-N curve by RTM.
2.3. Microstructure
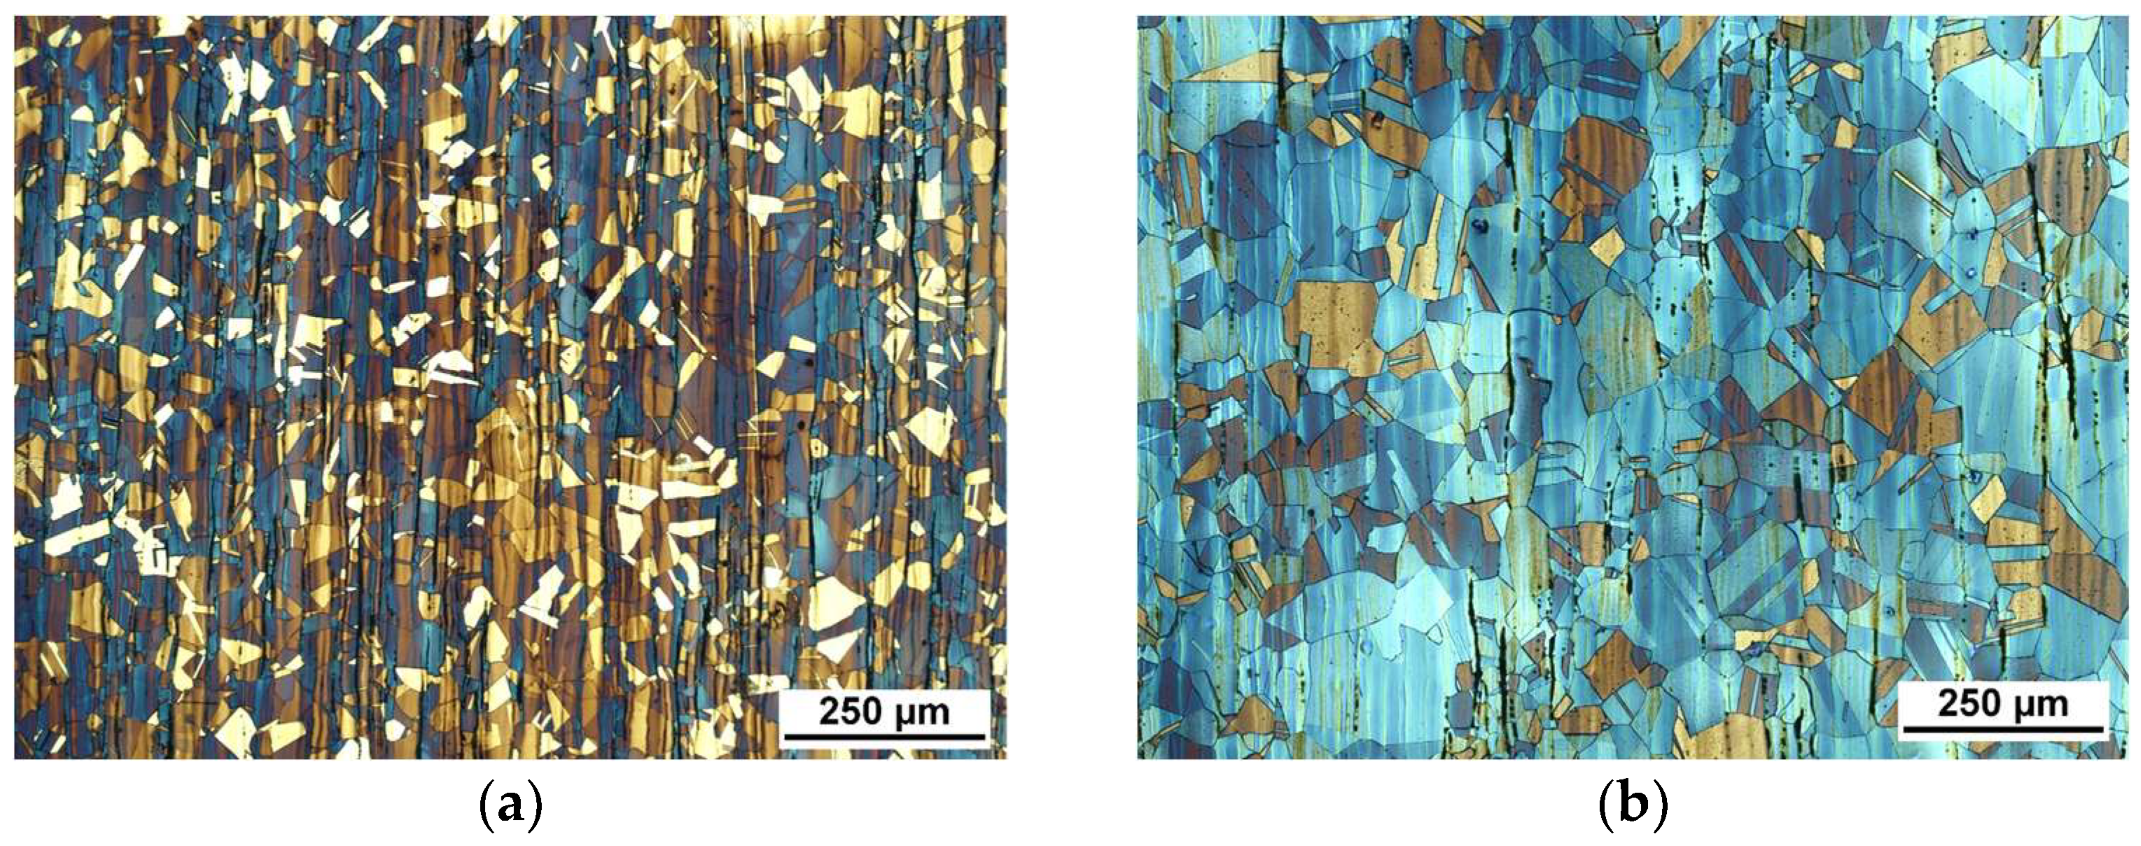
The microstructure of this material was widely investigated by the coauthor of this work in other studies with the same steel sheet [5,6]. Color images through the optical microscope of the metallographic surfaces (Figure 5) provide evidence of the significant decrease in the volume fraction of delta ferrite present in black strings parallel to the rolling direction and better shown in the blue strings in Figure 6c,d. The different color shades on the bands of the surface showed a chemical heterogeneity. Analyses by means of magnetic induction with the feritscope allowed us to estimate a reduction in δ-ferrite from 1.24% in the AR state to 0.54% in the SA state.

Figure 5.
Optical light microscope images of the microstructure of AR (a) and SA (b) 304L specimens. The δ-ferrite is represented as the black strings aligned with the bands parallel to the rolling direction [6].
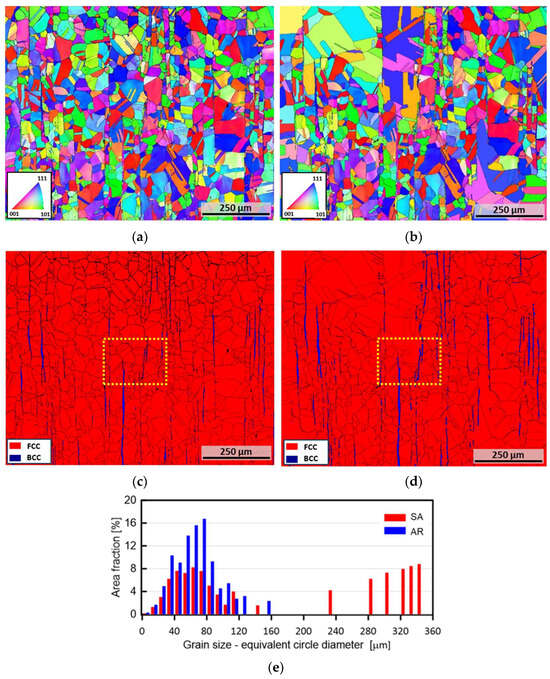
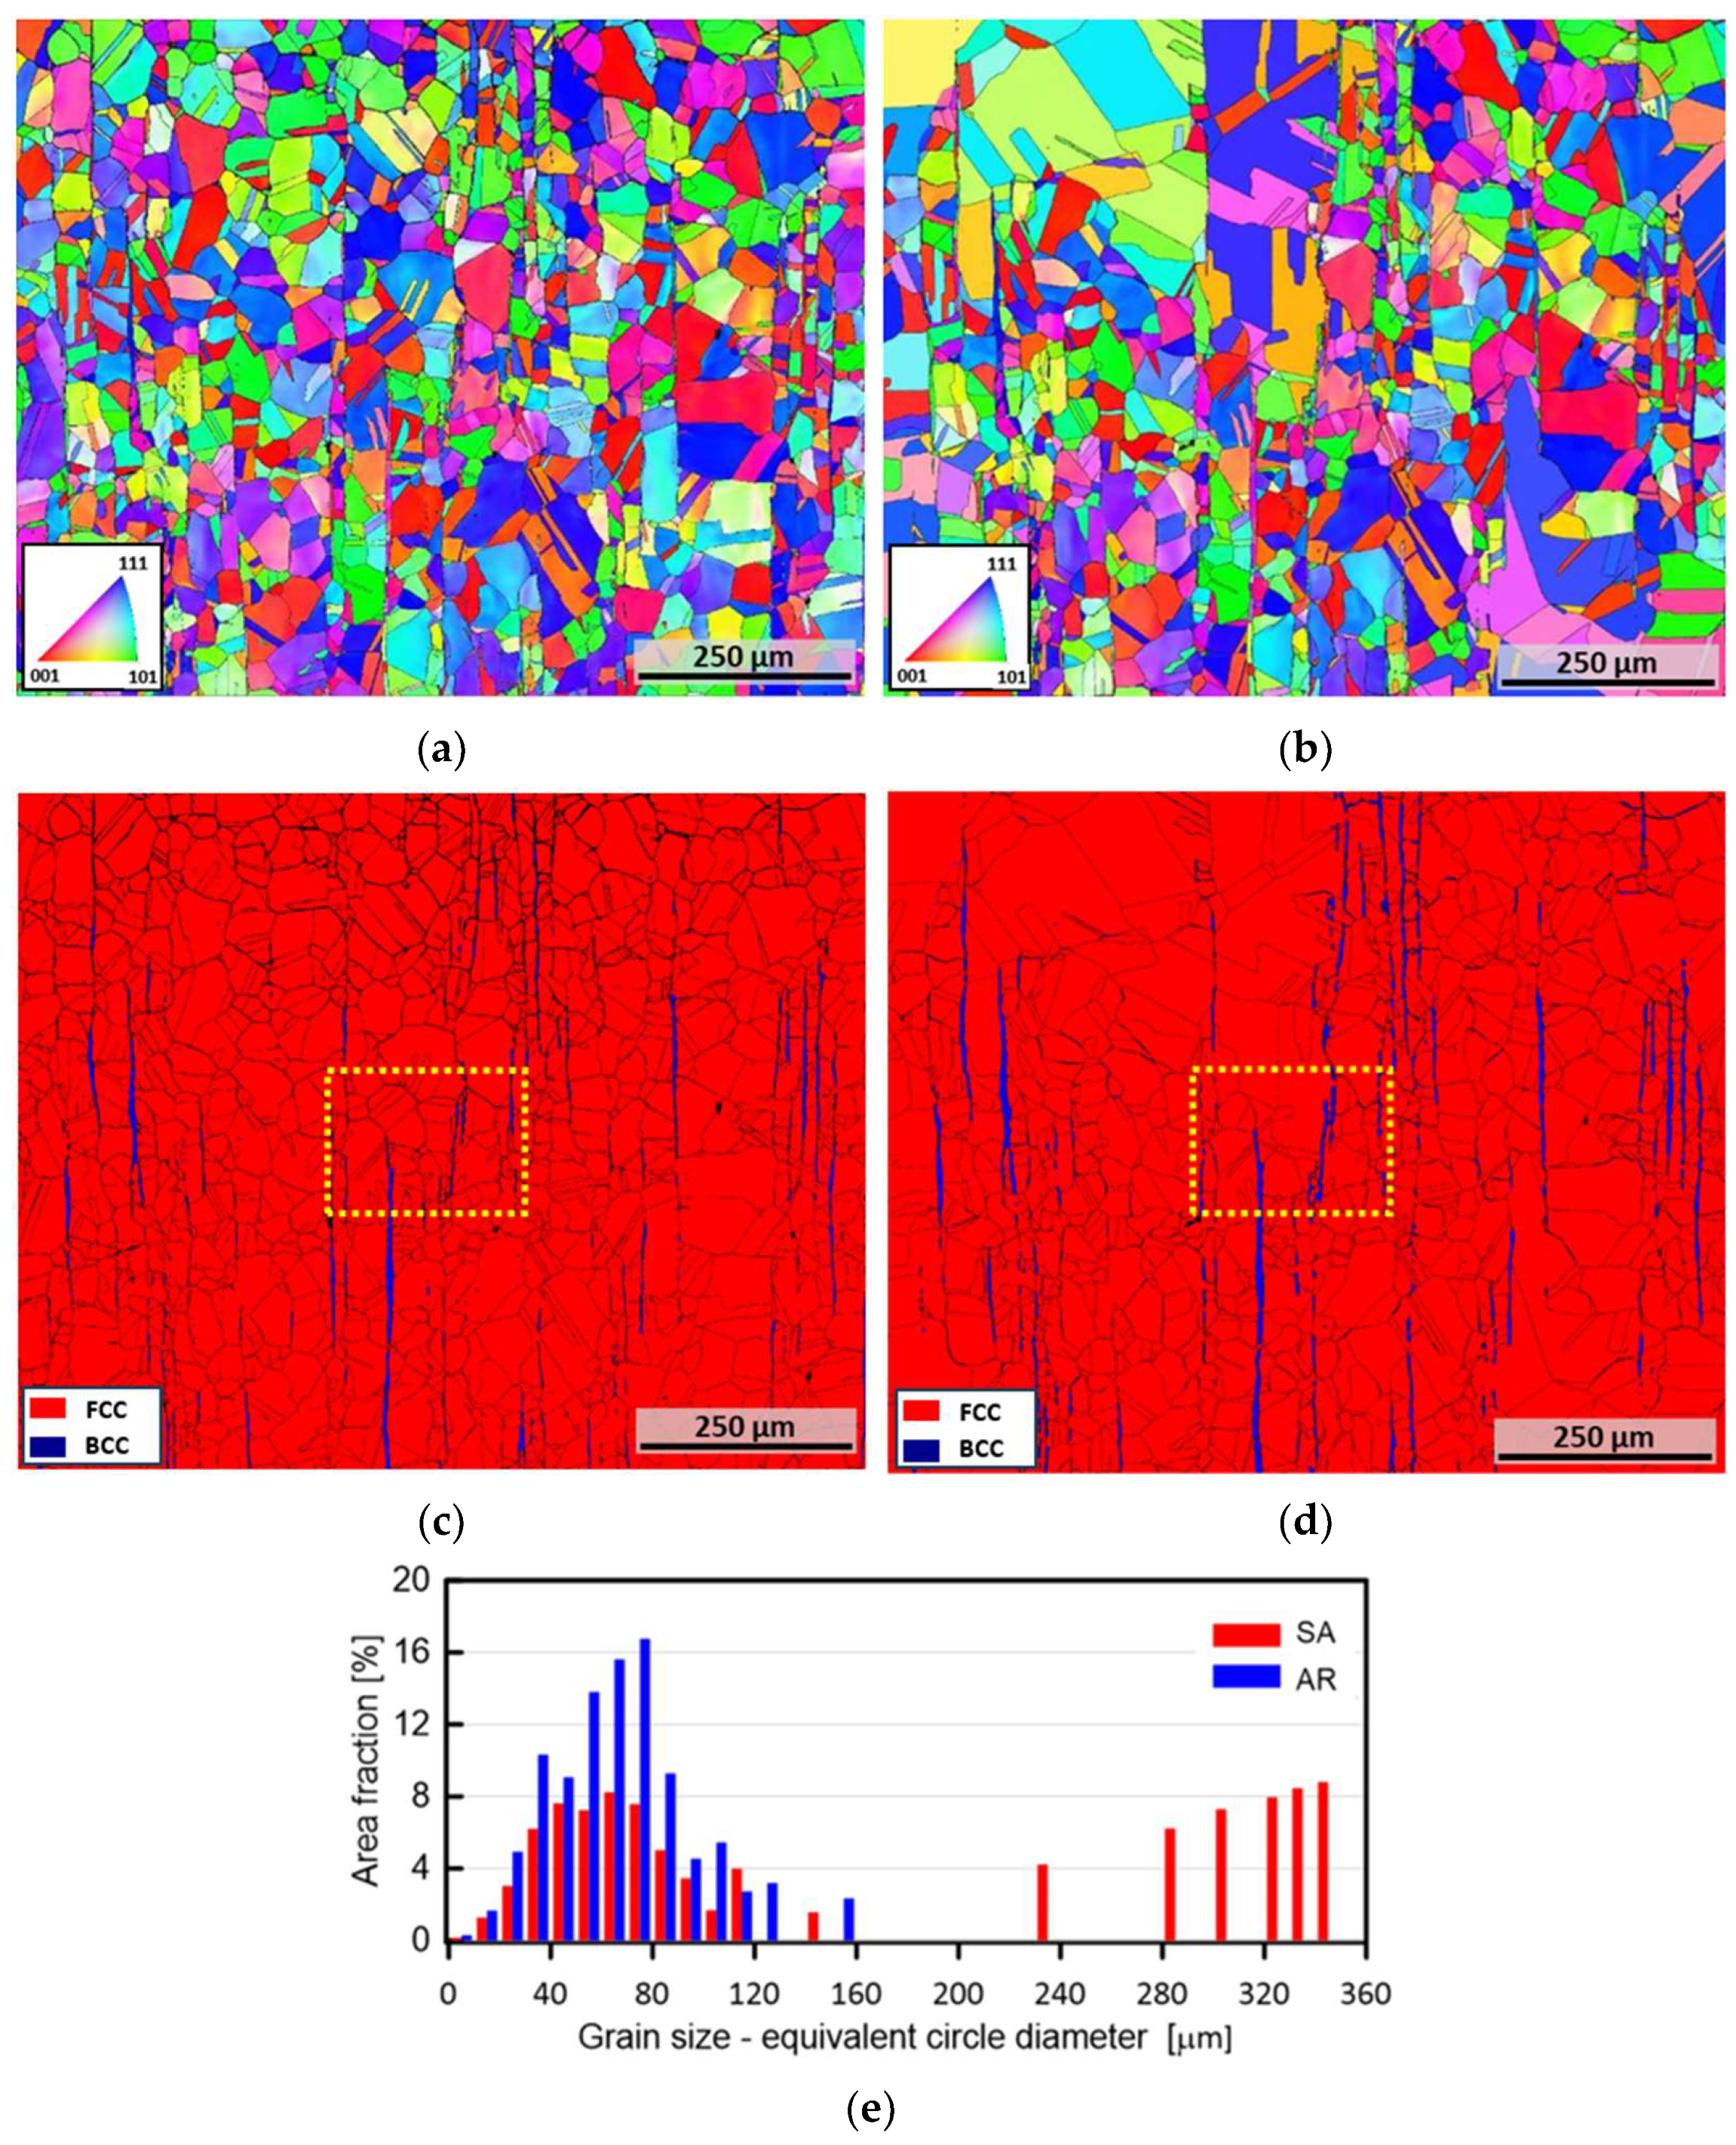
Figure 6.
Microstructures of the AR specimen (left side) and SA specimen (right side): (a,b) inverse pole figure maps; (c,d) phase maps evidencing the presence of delta ferrite on strings; (e) grain size distribution on AR and SA states; The yellow rectangles indicate the regions used for the EDS analysis; adapted from [6].
The results of the electron-backscattered diffraction (EBSD) analysis of the two material states are shown in Figure 6. Both material states present equiaxed austenite grains with numerous annealing twins and δ-ferrite strings aligned along the rolling direction. From Figure 6a,b, it can be seen that after the solution annealing process, the regions near the δ-ferrite retain their original grain size, while in the other areas, there is an increase in grain size. The δ-ferrite zones are better shown in Figure 6c,d and the dimension of grain size is reported in Figure 6e. Excluding the twin boundaries, the average grain size of the AR specimen was 32 μm ± 11 μm while a greater dimension grain size of 48 μm ± 32 μm was achieved after the heat treatment. It appears to be clear that the solution annealing process transformed the homogeneous microstructure of AR specimens into a heterogeneous microstructure characterized by regions with little grains or coarse grains.
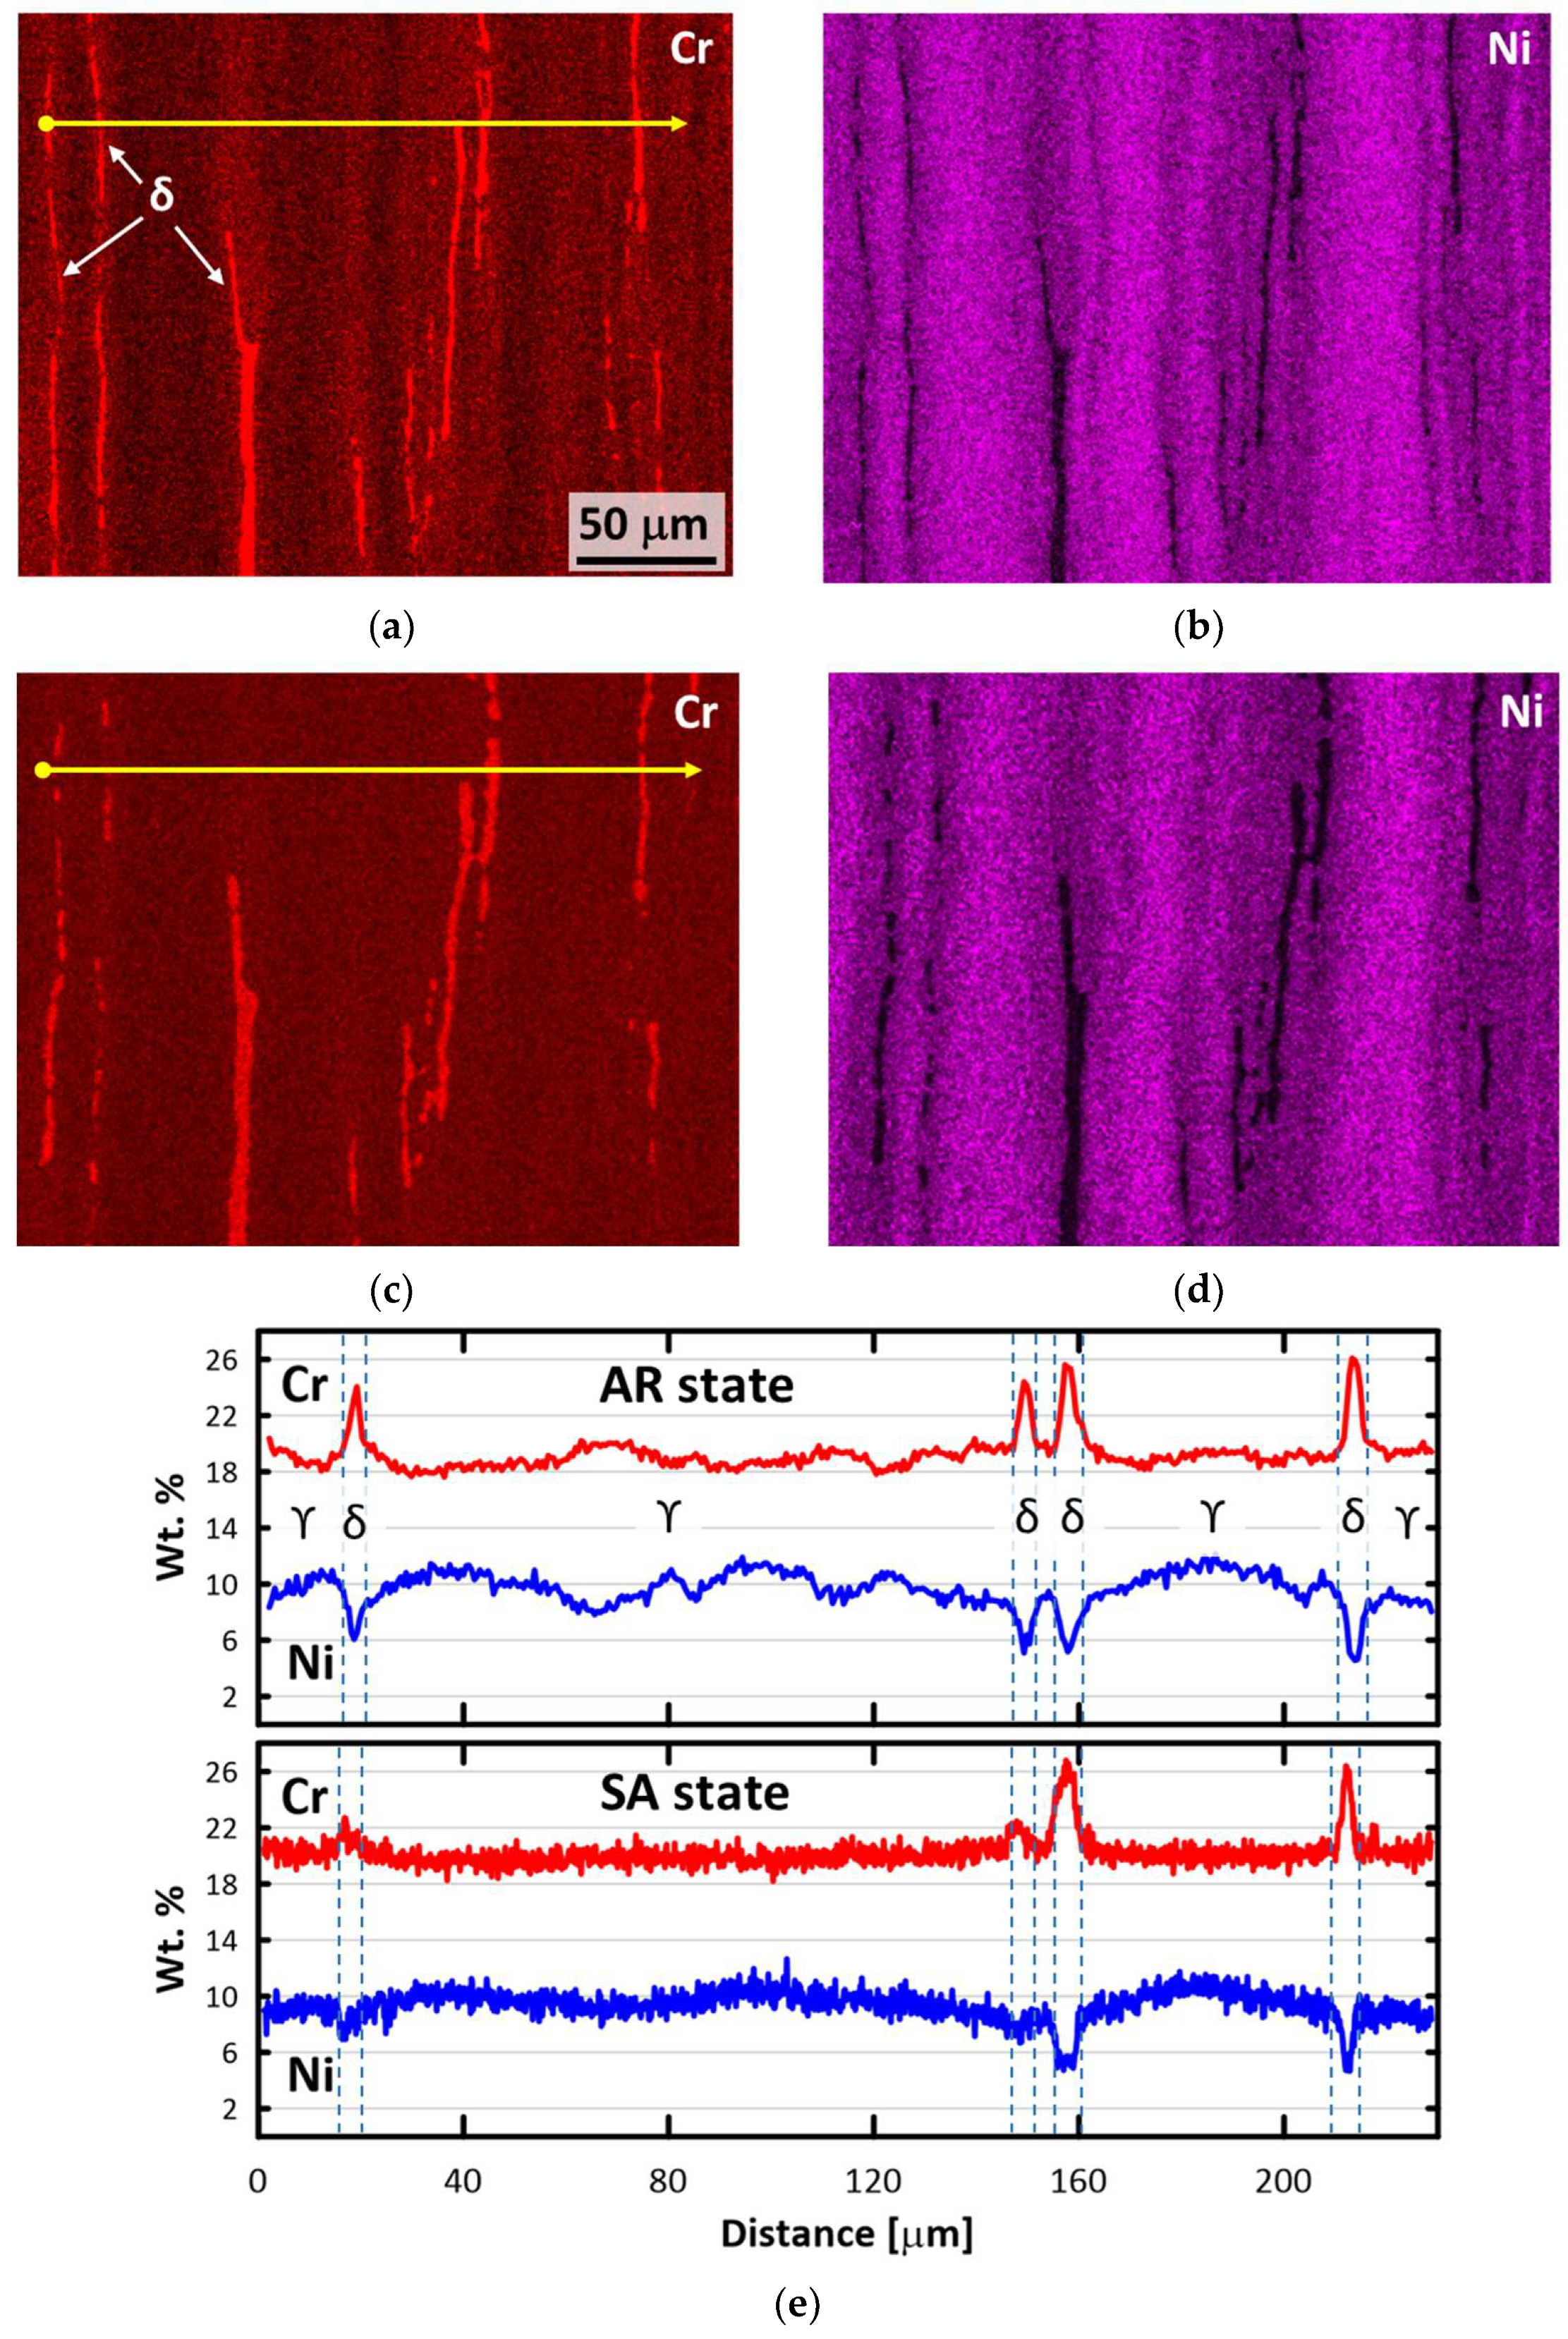
Figure 7 shows the results of the EDS analysis conducted on the same sample used for the EBSD analysis. The regions used for the EDS analysis are highlighted with the yellow rectangles in Figure 6c,d. The maps of Cr and Ni in both states are shown in Figure 7a–d with the yellow lines that indicate the positions of the linescan analysis (Figure 7e). The microstructure consists of an apparent alternation of Cr and Ni bands, with the Cr bands containing δ-ferrite strings. It can be observed that the chemical segregation between states is reduced; in fact, in the austenite between the δ-ferrite strings, fluctuations in Cr content are suppressed and Ni content is also partially reduced.
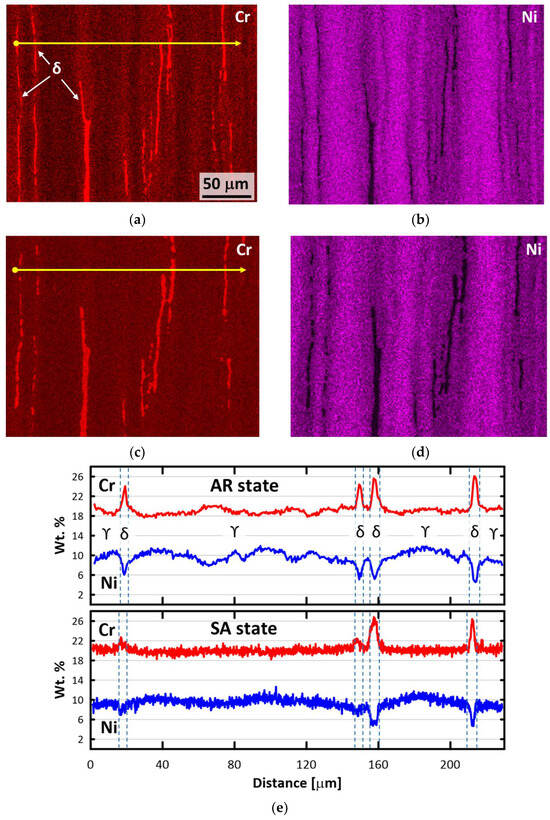
Figure 7.
EDS analysis of yellow area highlighted in Figure 6c,d: (a,b) Cr and Ni map distribution on AR specimen; (c,d) Cr and Ni map distribution on SA specimen; (e) linescan analysis along yellow line shown in (a,c), adapted from [6].
There is a noticeable difference in the two states in the morphology and volume of δ-ferrite, a Cr-rich phase. The fine strings partially or completely dissolved, while the thicker ones became slightly larger. The dissolution of the δ-ferrite probably led to an increase in the content of Cr, which is a stabilizing element of ferrite, within the adjacent austenite matrix. This would explain the reduced fluctuations in austenite after solution annealing.
3. Results and Discussion
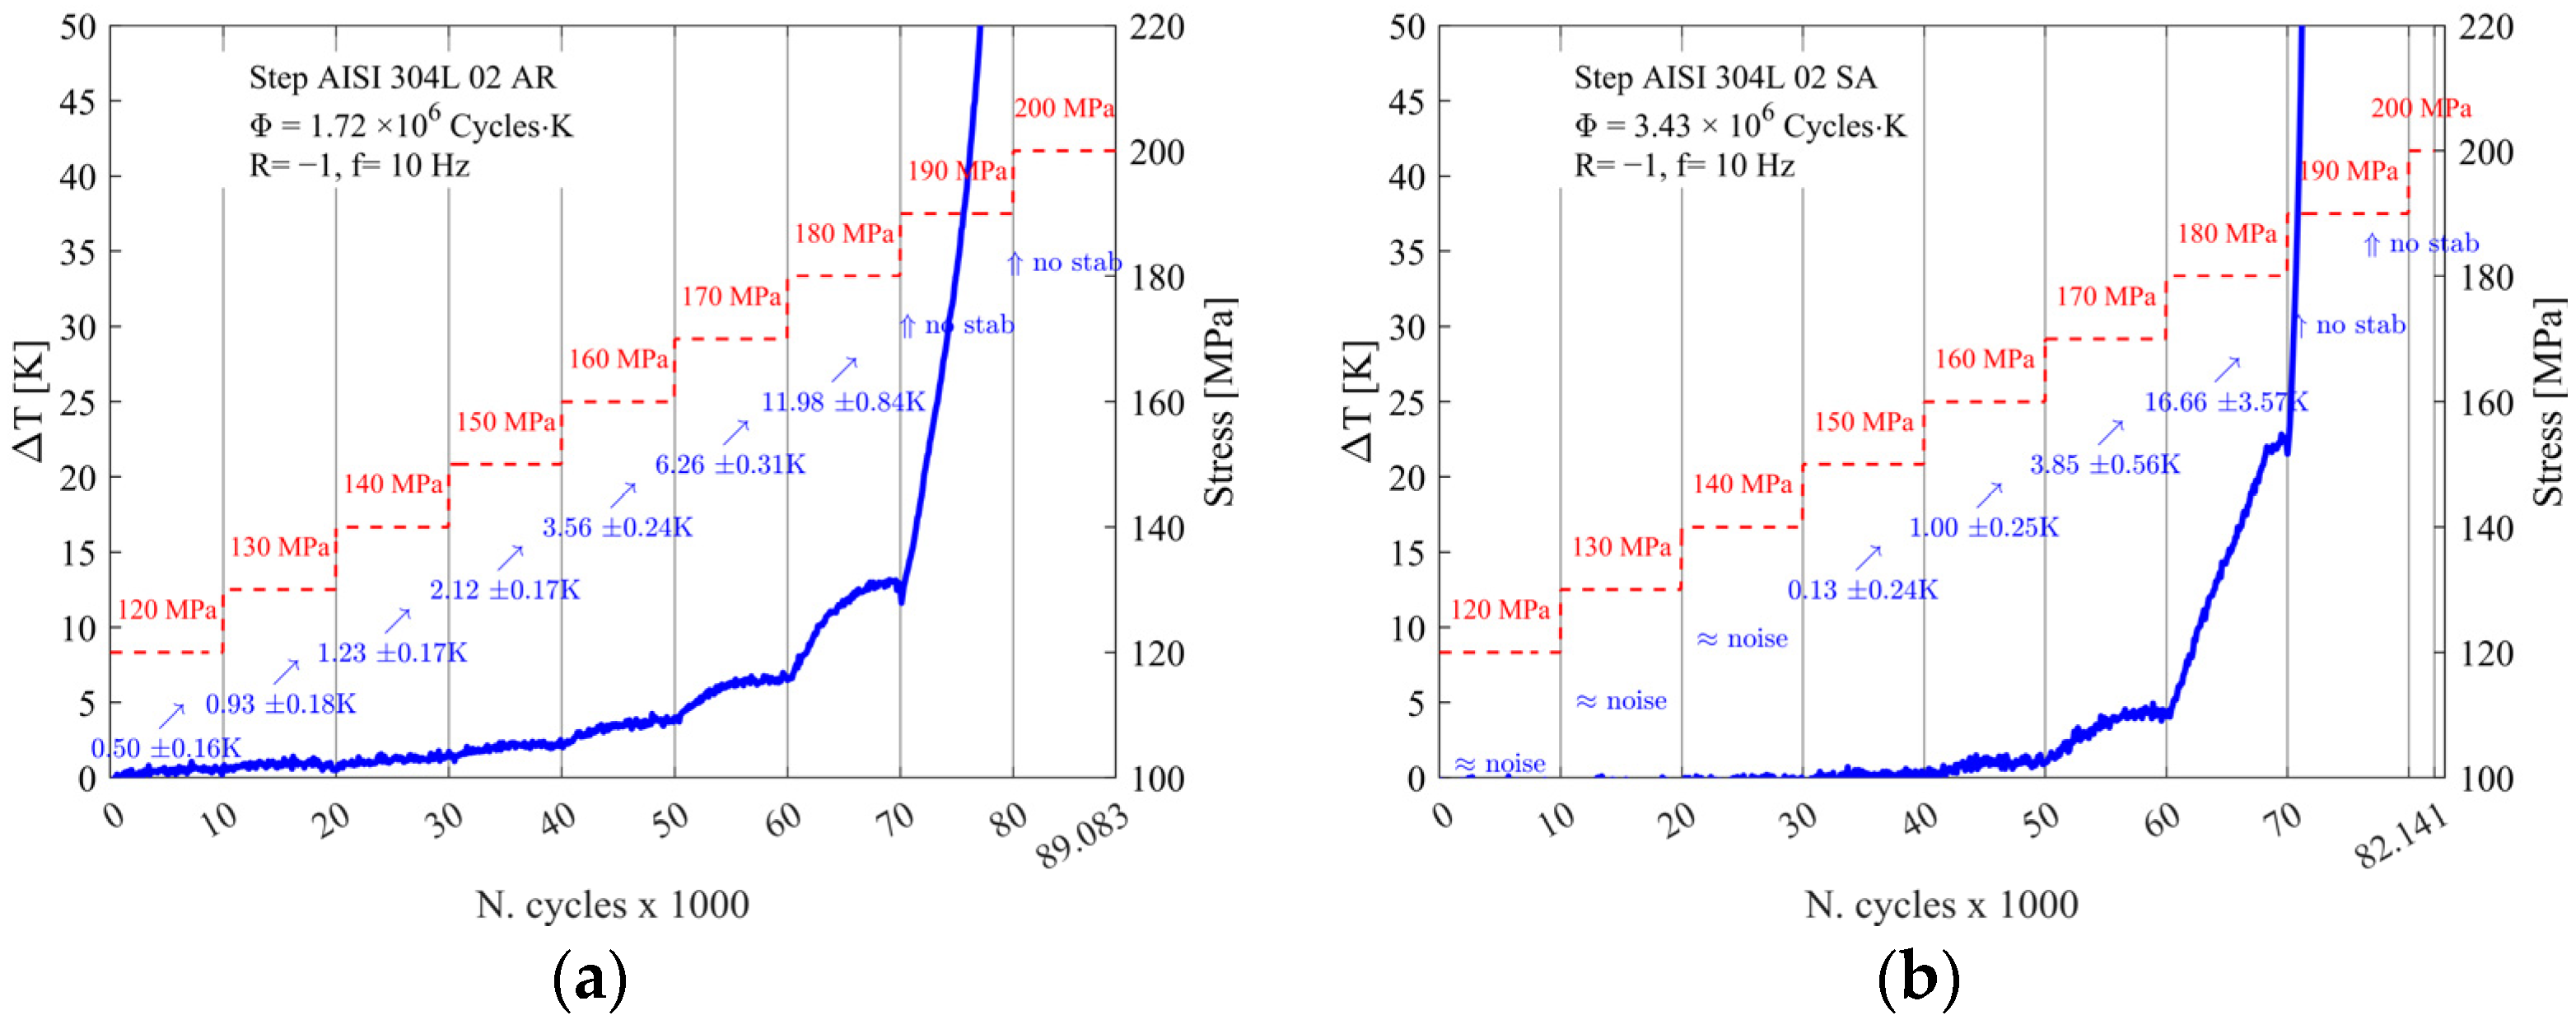
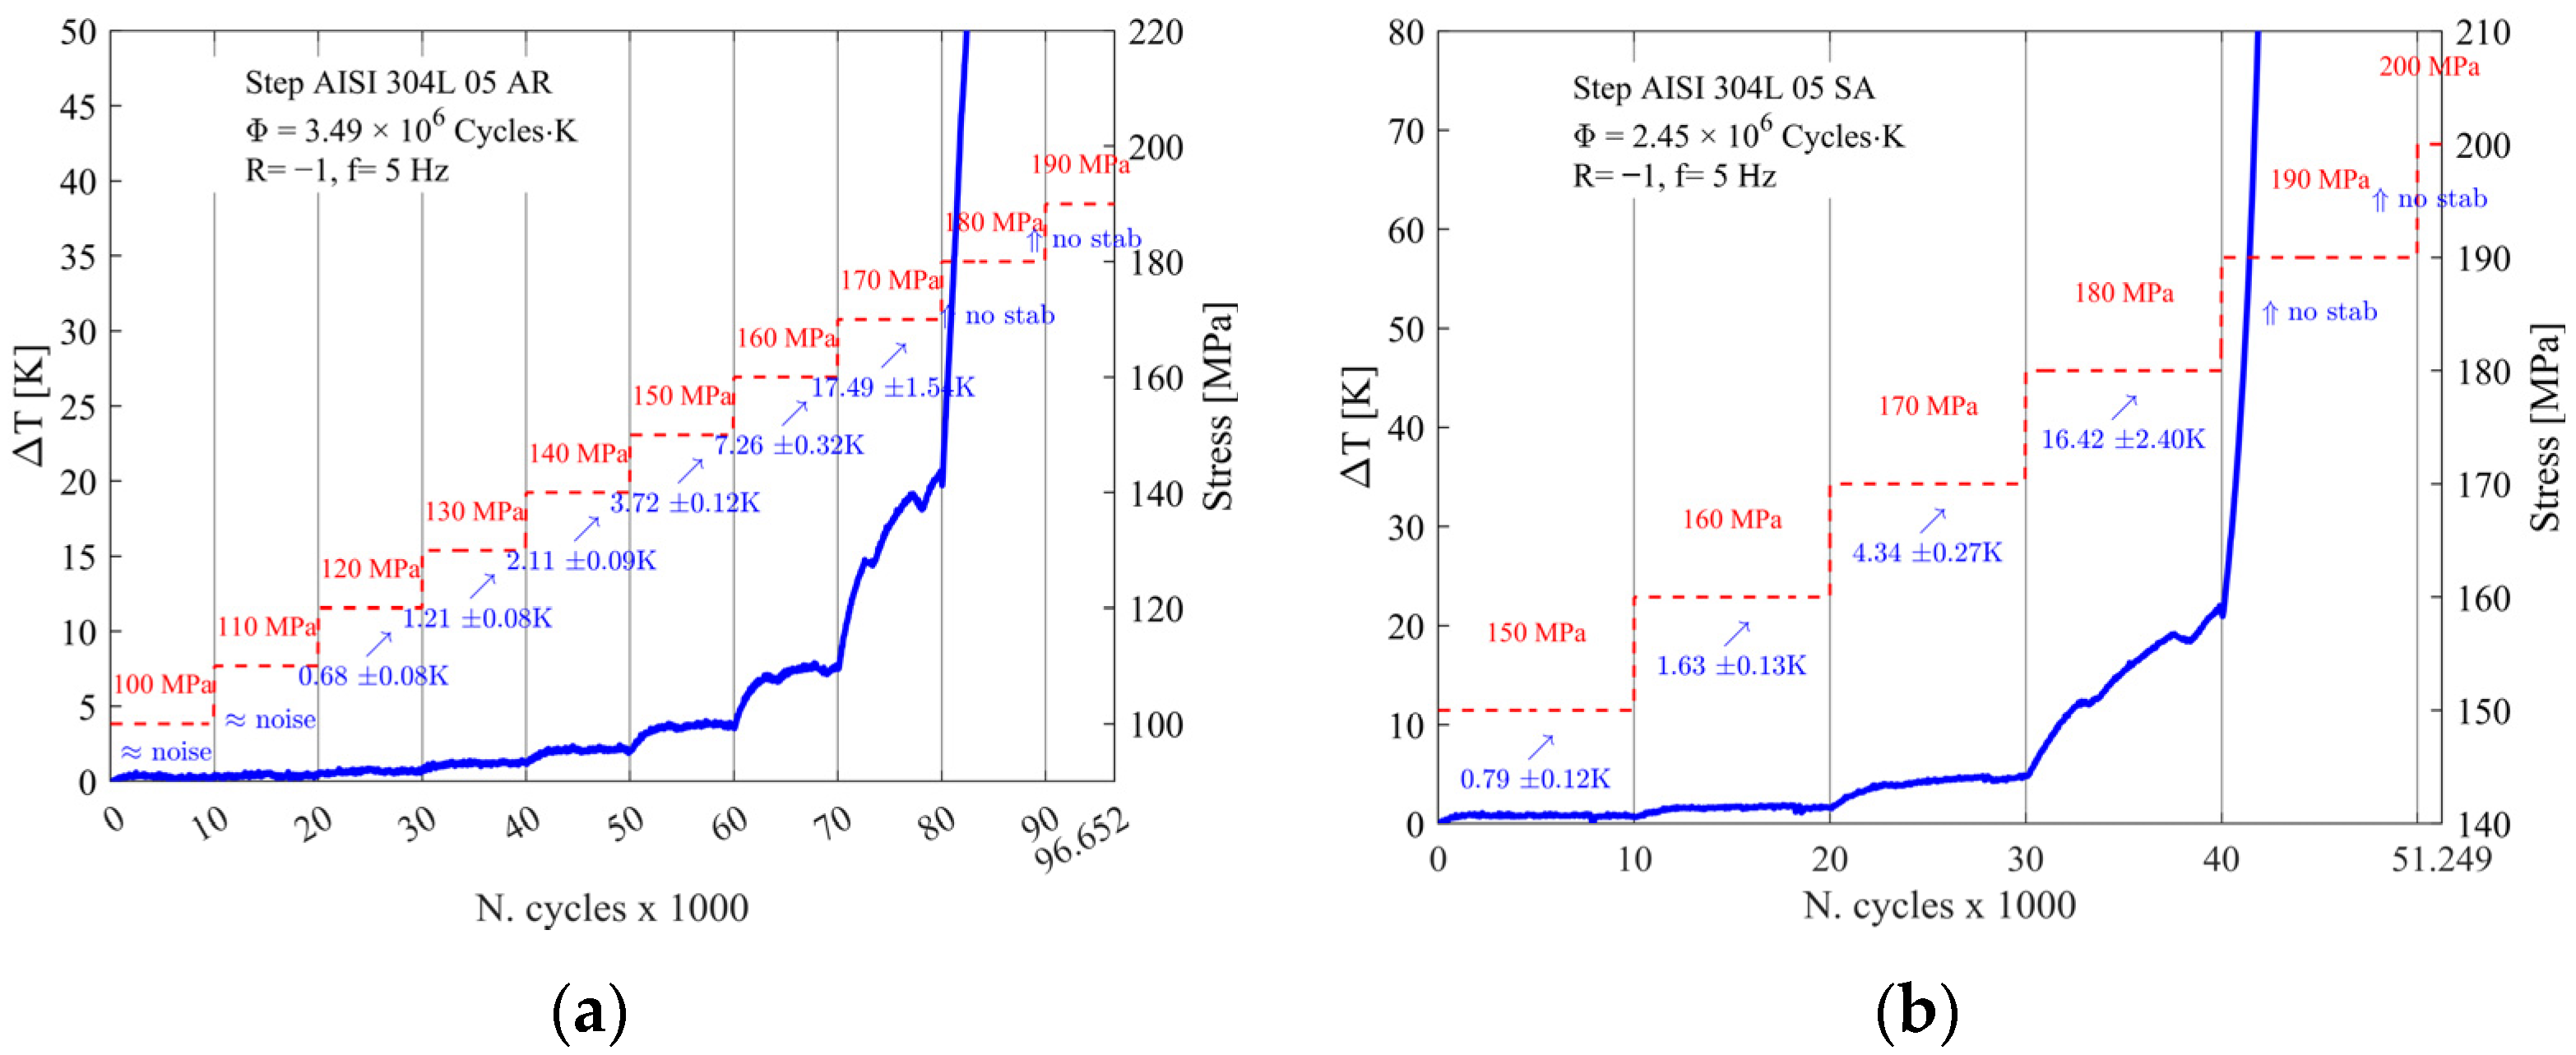
Stepwise tests were performed increasing by 10 MPa the load levels from 120 MPa to 200 MPa every 10 k cycles at the frequency of 10 Hz and stress ratio R = −1. Two tests were performed for each type of specimen. Figure 8 shows two examples of stabilization temperature as a function of the number of cycles and the applied stress level for AR and SA AISI 304L specimens. It can be seen that the thermal behavior between the two material states is quite different.
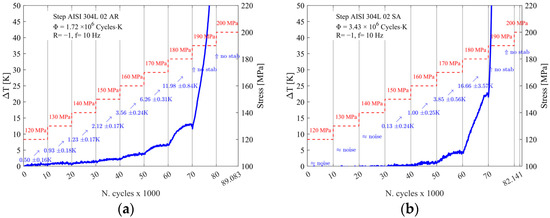
Figure 8.
Stepwise fatigue test on AISI 304L specimen at frequency of 10 Hz: (a) AR; (b) SA.
For the AR specimens, the surface temperature increases more slowly than for the SA specimens, reaching a temperature of 10 K after 70 k cycles at a stress of 180 MPa, and then increasing rapidly until failure at about 89 k cycles. In the SA specimens, on the other hand, the specimen surface temperature appears to remain unchanged for about 40 k cycles but as soon as it reaches 60 k cycles, it suddenly increases until failure at 82 k cycles. With the same loading history, the SA specimen seems to have a more unpredictable thermal trend, and failure occurs on average 10 k cycles earlier.
The energy parameter Φ, evaluated as the area subtended by the curve in the graph indicating temperature variation and the number of cycles, remains fairly similar in the tests.
Given the temperature trend, especially in the SA material, in order to avert any influence of the excessive test frequency used (10 Hz) on the material, it was decided to repeat three tests for each material state at a frequency of 5 Hz and to change the loading history for the SA material.
The new temperature trends obtained for both specimen types with stepwise fatigue tests at a frequency of 5 Hz are shown in Figure 9.
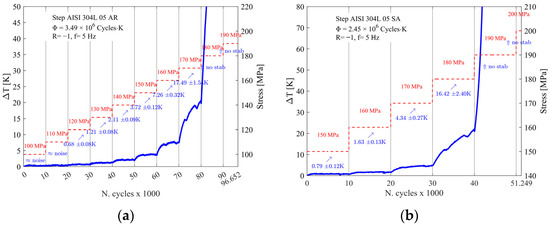
Figure 9.
Stepwise fatigue test on AISI 304L specimen at frequency of 5 Hz: (a) AR; (b) SA.
Modifying the load histories did not show any significant change in the thermal trends for both states of the materials, so the same considerations made above for the thermal trends of the tests conducted at 10 Hz are valid.
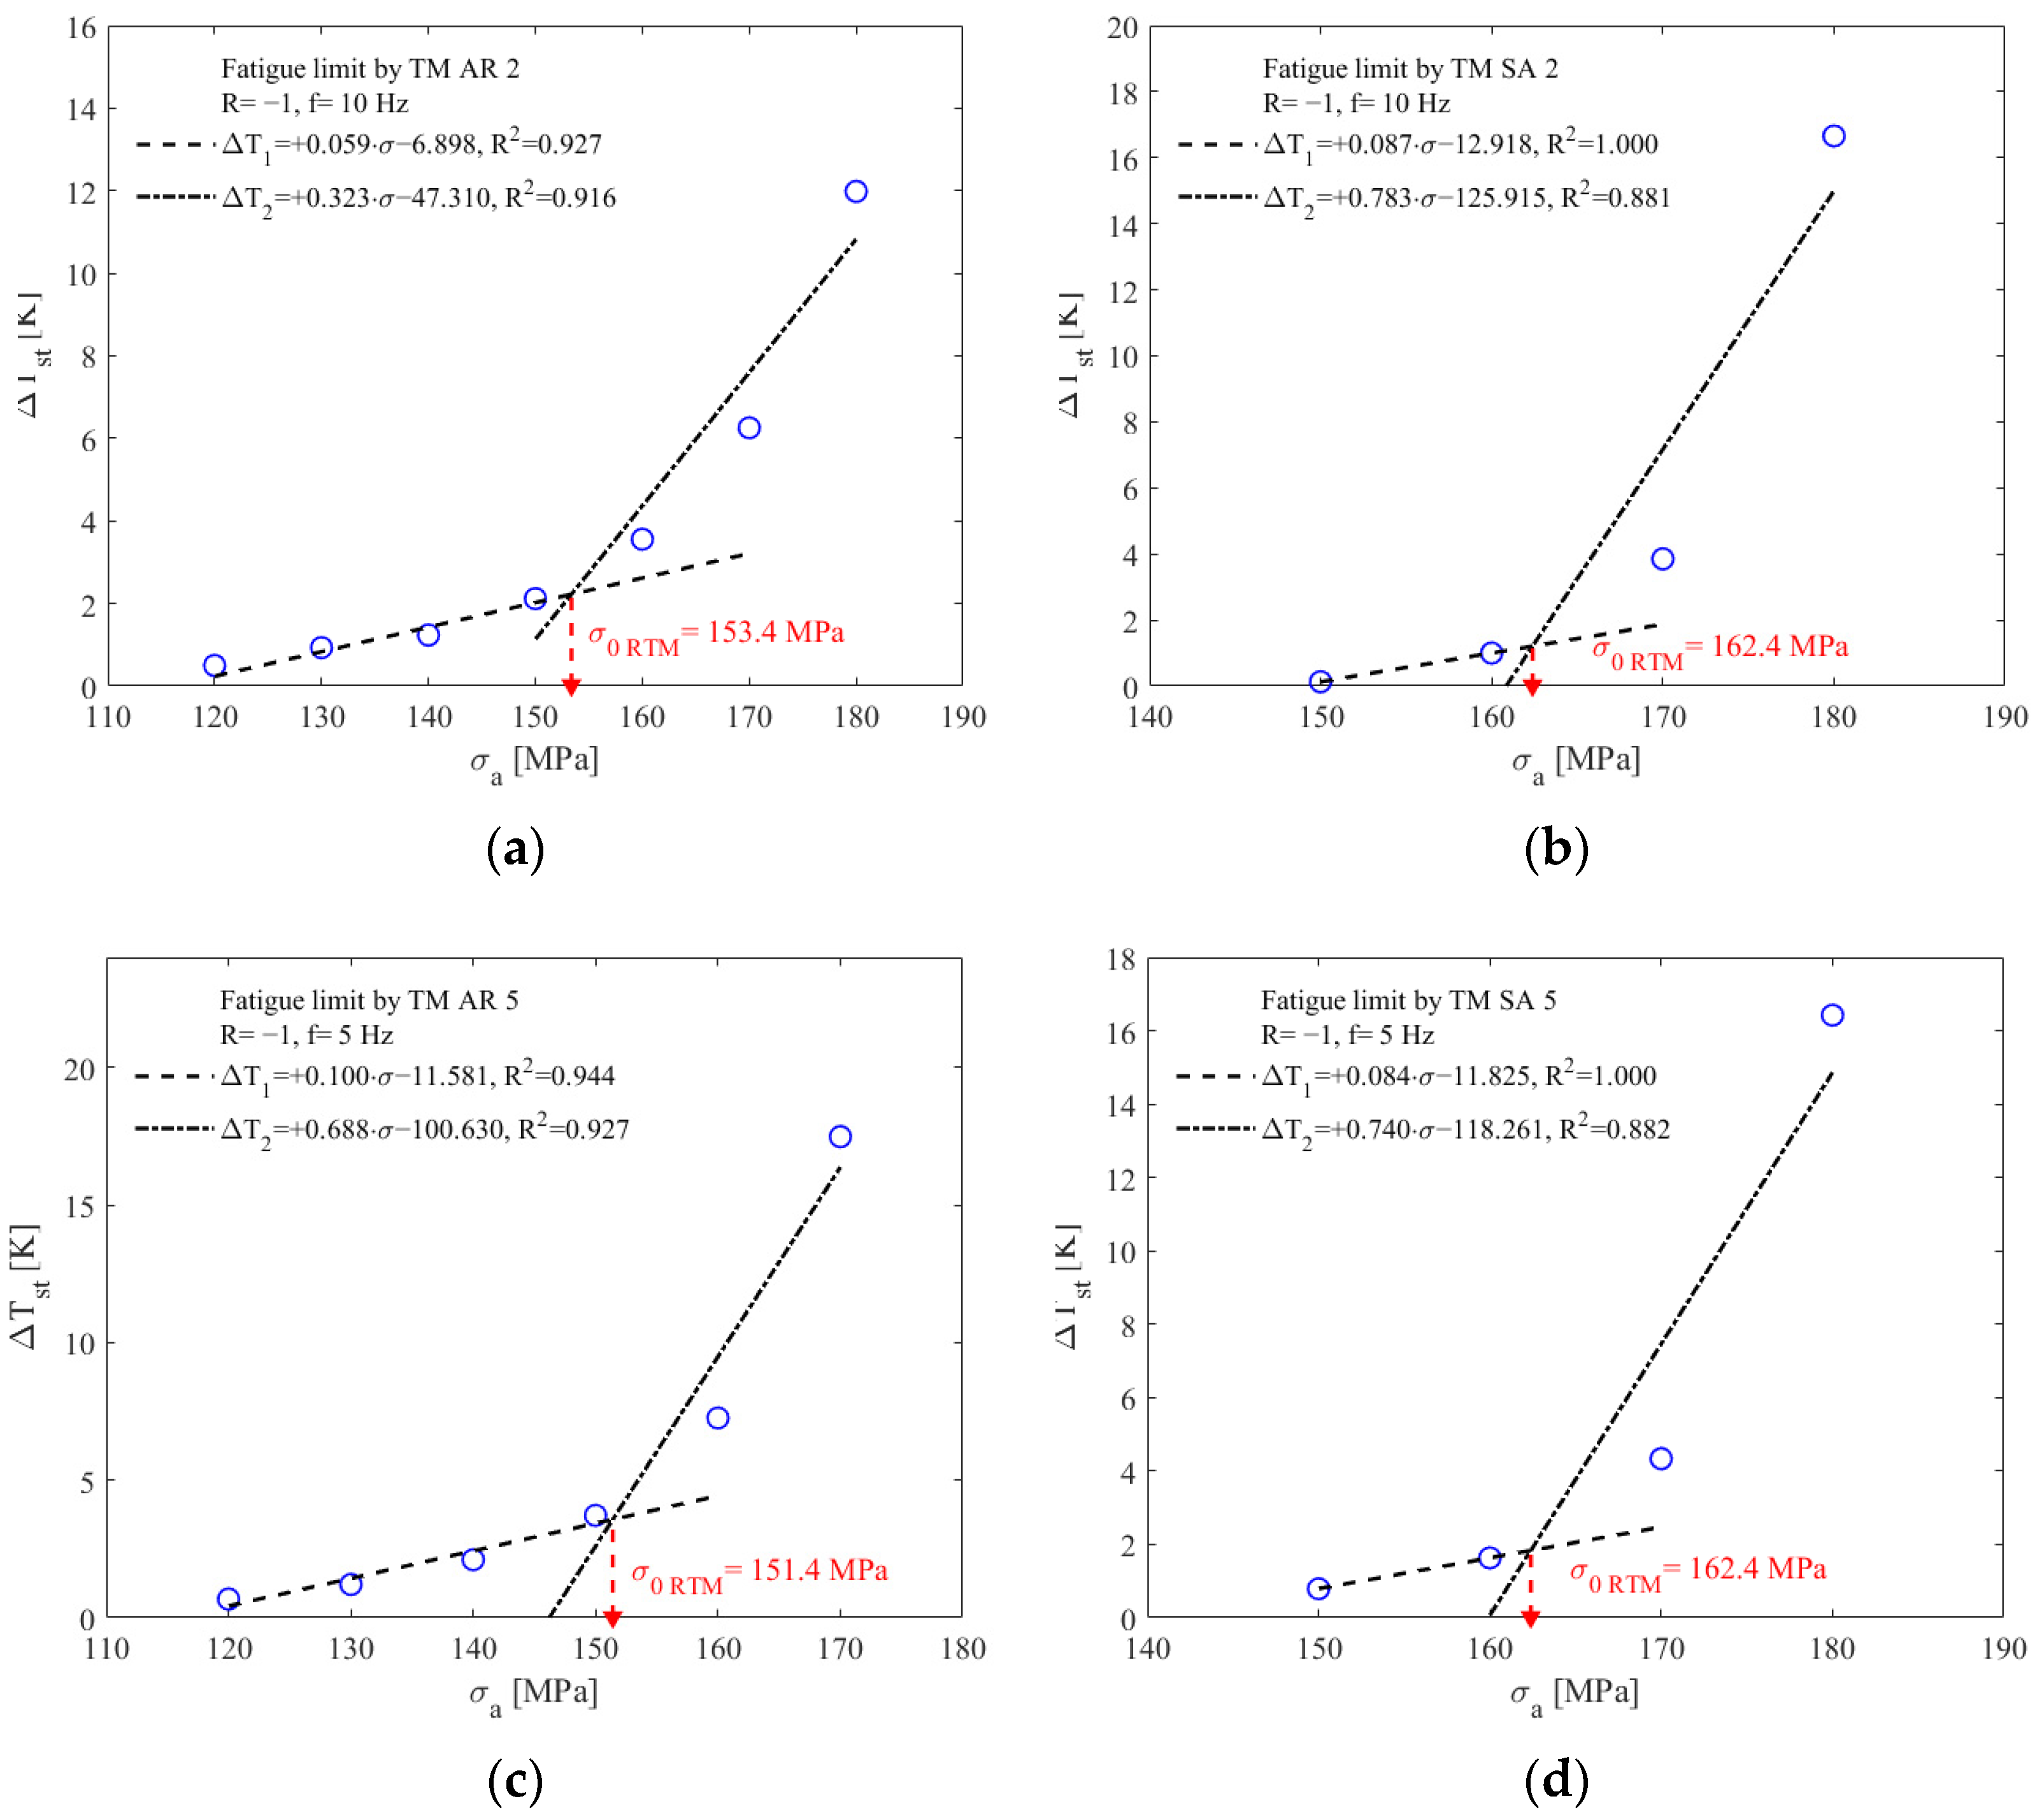
By plotting the stabilization temperatures for each load level, respectively, it was possible to estimate the fatigue limit of the materials. Figure 10 shows the fatigue limit estimations performed using the Risitano Thermographic Method for the stepwise tests shown previously.
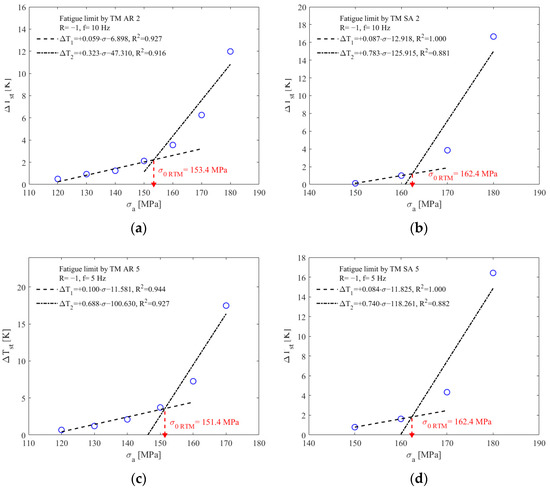
Figure 10.
Fatigue limit estimation according to RTM for AISI304L specimens: (a) AR, 10 Hz; (b) AR, 5 HZ; (c) SA, 10 Hz; (d) SA, 5 Hz.
The legends of the graphs show the R2 coefficient, which estimates how closely the data and the straight lines used are correlated. Due to the presence of few points for the SA specimens, a minimum value of 0.88 is reached, which is nevertheless acceptable.
A summary of all stepwise fatigue tests conducted for AR and SA specimens and their corresponding estimated fatigue limit values determined using the Risitano Thermographic Method is provided in Table 2.
Table 2.
Stepwise fatigue test results.
The fatigue limit for the AR specimens was σ0 R-1 = 152 ± 1 MPa, while for the SA specimens, it was σ0 R-1 = 163 ± 6 MPa. The higher standard deviation in the fatigue limit estimation for the SA specimens is due to the lack of points present for the linear regressions and thus this results in a more inaccurate estimation of the value.
4. Conclusions
The energetic release of two microstructural states of AISI 304L stainless steel was evaluated during fatigue tests. No influence of loading history or frequency was found on the results.
From the energy point of view, SA specimens are characterized by having a more sudden energy release to failure compared with AR specimens that show a more gradual thermal release at the same load history. The application of RTM for the rapid estimation of the fatigue limit showed an improvement in fatigue life with solution annealing treatment.
From a microstructural point of view, the solution annealing contributed to the dissolution of δ-ferrite and grain coarsening. The heterogeneity of the SA material, due to the grain growth impeding effect of the retained δ-ferrite strings, seems to allow for a better tolerance to fatigue damage and increased HCF life.
Author Contributions
D.C.: Conceptualization, methodology, software, validation, supervision, investigation, writing—original draft preparation and editing. M.J.: Conceptualization, methodology, validation, supervision. M.Š.: Conceptualization, methodology, validation, supervision. D.S.: Conceptualization, methodology, software, validation, supervision, investigation, writing—original draft preparation and editing. G.R.: Conceptualization, methodology, software, validation, supervision, investigation, writing—original draft preparation and editing. All authors have read and agreed to the published version of the manuscript.
Funding
This research received no external funding. The authors declare that they have no known competing financial interests or personal relationships that could have appeared to influence the work reported in this paper.
Institutional Review Board Statement
Not applicable.
Informed Consent Statement
Not applicable.
Data Availability Statement
The data presented in this study are available on request from the corresponding author.
Conflicts of Interest
The authors declare no conflicts of interest.
References
- Lima, A.S.; Nascimento, A.M.; Abreu, H.F.G.; De Lima-Neto, P. Sensitization Evaluation of the Austenitic Stainless Steel AISI 304L, 316L, 321 and 347. J. Mater. Sci. 2005, 40, 139–144. [Google Scholar] [CrossRef]
- Ningshen, S.; Sakairi, M. Corrosion Degradation of AISI Type 304L Stainless Steel for Application in Nuclear Reprocessing Plant. J. Solid State Electrochem. 2015, 19, 3533–3542. [Google Scholar] [CrossRef]
- Kumar, R.R.; Babu, J.M. Investigation and Joint Effect Analysis of Ti-6AL-4V & SS-304L in Aerospace Applications. INCAS Bull. 2020, 12, 195–201. [Google Scholar] [CrossRef]
- Flinn, J.E.; McVay, G.L.; Walters, L.C. In-Reactor Deformation of Solution Annealed Type 304L Stainless Steel. In Measurement of Irradiation-Enhanced Creep in Nuclear Materials; Elsevier: Amsterdam, The Netherlands, 1977; pp. 210–223. [Google Scholar] [CrossRef]
- Jambor, M.; Vojtek, T.; Pokorný, P.; Šmíd, M. Effect of Solution Annealing on Fatigue Crack Propagation in the AISI 304L TRIP Steel. Materials 2021, 14, 1331. [Google Scholar] [CrossRef] [PubMed]
- Šmíd, M.; Kuběna, I.; Jambor, M.; Fintová, S. Effect of Solution Annealing on Low Cycle Fatigue of 304L Stainless Steel. Mater. Sci. Eng. A 2021, 824, 141807. [Google Scholar] [CrossRef]
- Yang, F.; Zhu, D.; Jiang, M.; Liu, H.; Guo, S.; Wang, Q.; Wang, H.; Zhang, K.; Huang, A.; Hou, J. Effect of Heat Treatment on the Microstructure, Mechanical Properties and Corrosion Resistance of Selective Laser Melted 304L Stainless Steel. Acta Metall. Sin. (Engl. Lett.) 2022, 35, 1688–1702. [Google Scholar] [CrossRef]
- Jovičević-Klug, P.; Jovičević-Klug, M.; Rohwerder, M.; Godec, M.; Podgornik, B. Complex Interdependency of Microstructure, Mechanical Properties, Fatigue Resistance, and Residual Stress of Austenitic Stainless Steels AISI 304L. Materials 2023, 16, 2638. [Google Scholar] [CrossRef] [PubMed]
- Chen, X.; Li, J.; Cheng, X.; Wang, H.; Huang, Z. Effect of Heat Treatment on Microstructure, Mechanical and Corrosion Properties of Austenitic Stainless Steel 316L Using Arc Additive Manufacturing. Mater. Sci. Eng. A 2018, 715, 307–314. [Google Scholar] [CrossRef]
- Yadollahi, A.; Shamsaei, N.; Thompson, S.M.; Seely, D.W. Effects of Process Time Interval and Heat Treatment on the Mechanical and Microstructural Properties of Direct Laser Deposited 316L Stainless Steel. Mater. Sci. Eng. A 2015, 644, 171–183. [Google Scholar] [CrossRef]
- Sabooni, S.; Rashtchi, H.; Eslami, A.; Karimzadeh, F.; Enayati, M.H.; Raeissi, K.; Ngan, A.H.W.; Imani, R.F. Dependence of Corrosion Properties of AISI 304L Stainless Steel on the Austenite Grain Size. Int. J. Mater. Res. 2017, 108, 552–559. [Google Scholar] [CrossRef]
- Li, Y.; Aubin, V.; Rey, C.; Bompard, P. Microstructural Modeling of Fatigue Crack Initiation in Austenitic Steel 304L. Procedia Eng. 2012, 31, 541–549. [Google Scholar] [CrossRef]
- Hedayati, A.; Najafizadeh, A.; Kermanpur, A.; Forouzan, F. The Effect of Cold Rolling Regime on Microstructure and Mechanical Properties of AISI 304L Stainless Steel. J. Mater. Process. Technol. 2010, 210, 1017–1022. [Google Scholar] [CrossRef]
- Colin, J.; Fatemi, A.; Taheri, S. Cyclic Hardening and Fatigue Behavior of Stainless Steel 304L. J. Mater. Sci. 2011, 46, 145–154. [Google Scholar] [CrossRef]
- D’Andrea, D.; Risitano, G.; Guglielmino, E.; Piperopoulos, E.; Santonocito, D. Correlation between Mechanical Behaviour and Microstructural Features of AISI 316L Produced by SLM. Procedia Struct. Integr. 2022, 41, 199–207. [Google Scholar] [CrossRef]
- Crisafulli, D.; Fintová, S.; Santonocito, D.; D’Andrea, D. Microstructural Characterization and Mechanical Behaviour of Laser Powder Bed Fusion Stainless Steel 316L. Theor. Appl. Fract. Mech. 2024, 131, 104343. [Google Scholar] [CrossRef]
- La Rosa, G.; Risitano, A. Thermographic Methodology for Rapid Determination of the Fatigue Limit of Materials and Mechanical Components. Int. J. Fatigue 2000, 22, 65–73. [Google Scholar] [CrossRef]
- Luong, M.P. Fatigue Limit Evaluation of Metals Using an Infrared Thermographic Technique. Mech. Mater. 1998, 28, 155–163. [Google Scholar] [CrossRef]
- Luong, M.P. Infrared Thermography of Fatigue in Metals. In Proceedings of the Thermosense XIV: An Intl Conf on Thermal Sensing and Imaging Diagnostic Applications, Orlando, FL, USA, 20 April 1992; Volume 1682, pp. 222–233. [Google Scholar] [CrossRef]
- Luong, M.P. Infrared Thermographic Scanning of Fatigue in Metals. Nucl. Eng. Des. 1995, 158, 363–376. [Google Scholar] [CrossRef]
- Curà, F.; Curti, G.; Sesana, R. A New Iteration Method for the Thermographic Determination of Fatigue Limit in Steels. Int. J. Fatigue 2005, 27, 453–459. [Google Scholar] [CrossRef]
Disclaimer/Publisher’s Note: The statements, opinions and data contained in all publications are solely those of the individual author(s) and contributor(s) and not of MDPI and/or the editor(s). MDPI and/or the editor(s) disclaim responsibility for any injury to people or property resulting from any ideas, methods, instructions or products referred to in the content. |
© 2025 by the authors. Licensee MDPI, Basel, Switzerland. This article is an open access article distributed under the terms and conditions of the Creative Commons Attribution (CC BY) license (https://creativecommons.org/licenses/by/4.0/).