1. Introduction
The study of high-cycle fatigue in materials, particularly metals, has been a focal point of research for many years. Traditionally, this research has centered around the analysis of the classical fatigue curve (S-N curve), which is closely tied to the study of dissipative phenomena in materials subjected to cyclic loadings and the corresponding variation in physical parameters such as energy dissipation [
1]. While low-cycle fatigue is characterized by damaging phenomena that involve the entire volume of the material, making it easier to model and measure, in high-cycle fatigue, microplastic and microcracking phenomena are activated stochastically [
2]. To analyze these phenomena, thermographic approaches have proven to be reliable for studying the damage evolution.
In recent decades, the focus has shifted towards multiscale approaches, which the aim of connecting macroscopic damage in materials subjected to cyclic loading with irreversible mechanisms at the microstructural scale. These mechanisms, associated with the gliding of dislocations and the formation of slip bands, cause variations in dissipative parameters [
3,
4]. These mechanisms are often neglected when the material is loaded within its elastic range, as dislocation phenomena occur locally rather than throughout the entire volume.
Intrinsic dissipation, expressed in terms of heat generation during cyclic loading, provides a suitable indicator of the microstructural state of a material [
5,
6]. This dissipation can be experimentally measured and compared with analytical predictions to assess material fatigue performance [
7,
8,
9,
10,
11]. Recent studies have demonstrated that intrinsic dissipation is a powerful tool for characterizing fatigue damage, especially in the context of high-cycle fatigue.
To further enhance fatigue testing efficiency, an iterative algorithm based on the Two Curves Method (TCM) [
12] has been developed. The TCM identifies differences in thermal emission trends between specimens tested above and below the fatigue limit, which can be correlated with different damage mechanisms [
13]. This method provides insights into how intrinsic dissipation varies with applied stress, offering a reliable means of estimating the fatigue limit by analyzing the thermal response of a material under cyclic loading.
The current research extends this concept by applying an iterative algorithm to optimize the fatigue limit estimation process. By iteratively partitioning experimental data into stress regions above and below a hypothesized fatigue limit, the algorithm fits curves to the thermal data and minimizes errors between the experimental and fitted results. This approach ensures smooth transitions at the fatigue limit and enables rapid fatigue limit estimation using fewer test specimens.
This method is particularly useful for additive manufacturing (AM) materials, such as the one studied in this work, the AISI 316L stainless steel produced via Powder Bed Fusion (PBF-LB/M), where complex microstructures and imperfections like pores and weld pools can significantly affect fatigue behavior. Traditional fatigue testing methods are costly and time-consuming, requiring a large number of specimens to characterize fatigue performance under different conditions. The iterative method introduced here offers a cost-effective and time-efficient alternative, significantly reducing the number of tests required to estimate the fatigue limit.
The primary aim of this study is to validate this iterative method for rapidly estimating the fatigue limit of AM materials, using intrinsic dissipation as a damage indicator. This approach promises to streamline the testing process, reducing both time and cost, while also providing deeper insights into the fatigue behavior of AM materials.
2. Methodology
This section presents the methodology employed for estimating the fatigue limit of additively manufactured AISI 316L stainless steel specimens, produced by Powder Bed Fusion (PBF-LB/M), using an iterative approach. The primary goal is to determine the fatigue limit by analyzing the surface temperature increments during cyclic loading, which are linked to intrinsic dissipation. The methodology combines both Step Loading (SL) and Constant Amplitude Loading (CAL) tests to assess the fatigue performance.
2.1. Iterative Method for Fatigue Limit Estimation
The key feature of this study is an iterative process designed to estimate the fatigue limit. The method works by partitioning the experimental dataset based on stress levels and fitting curves to the thermal data, aiming to minimize the error between the experimental and theoretical values.
The iterative process begins with defining an initial search range for the fatigue limit, denoted as . At each iteration, the dataset is divided into two regions:
- Below the fatigue limit:
This subset contains all the data points where the applied stress amplitude is below
and where
R is the exclusion radius that accounts for experimental variability. The exclusion radius is chosen as
. The choice derives from the technical literature [
14], where it is seen that the transition between microplastic effects happens in almost 20 MPa.
- Above the fatigue limit:
This subset contains all the data points where the stress amplitude exceeds .
At each iteration, curves are fitted to both the below and above subsets. To ensure continuity, both curves must intersect at without any discontinuity. This ensures that the fatigue limit is accurately captured by the model.
2.2. Fitting Models for Thermal Data
To model the relationship between stress amplitude and surface temperature increment-stabilized , two different curve types are applied for data above and below the fatigue limit.
The fitting model below the fatigue limit is described by a quadratic equation:
where
is the applied stress amplitude,
is the surface temperature increment below the fatigue limit, and
a is a fitting parameter.
For the region above the fatigue limit, the thermal data are modeled by a power law:
where
b and
n are fitting parameters, and
is the estimated fatigue limit.
The goal of the iterative process is to minimize the total fitting error
E, which is defined as follows:
where
and
The method iterates the fatigue limit over a search space, starting from the minimum up to the maximum value of stress amplitudes used during the tests. After having performed the curve fitting for all the values of within the search space, the that minimizes the error E is then chosen.
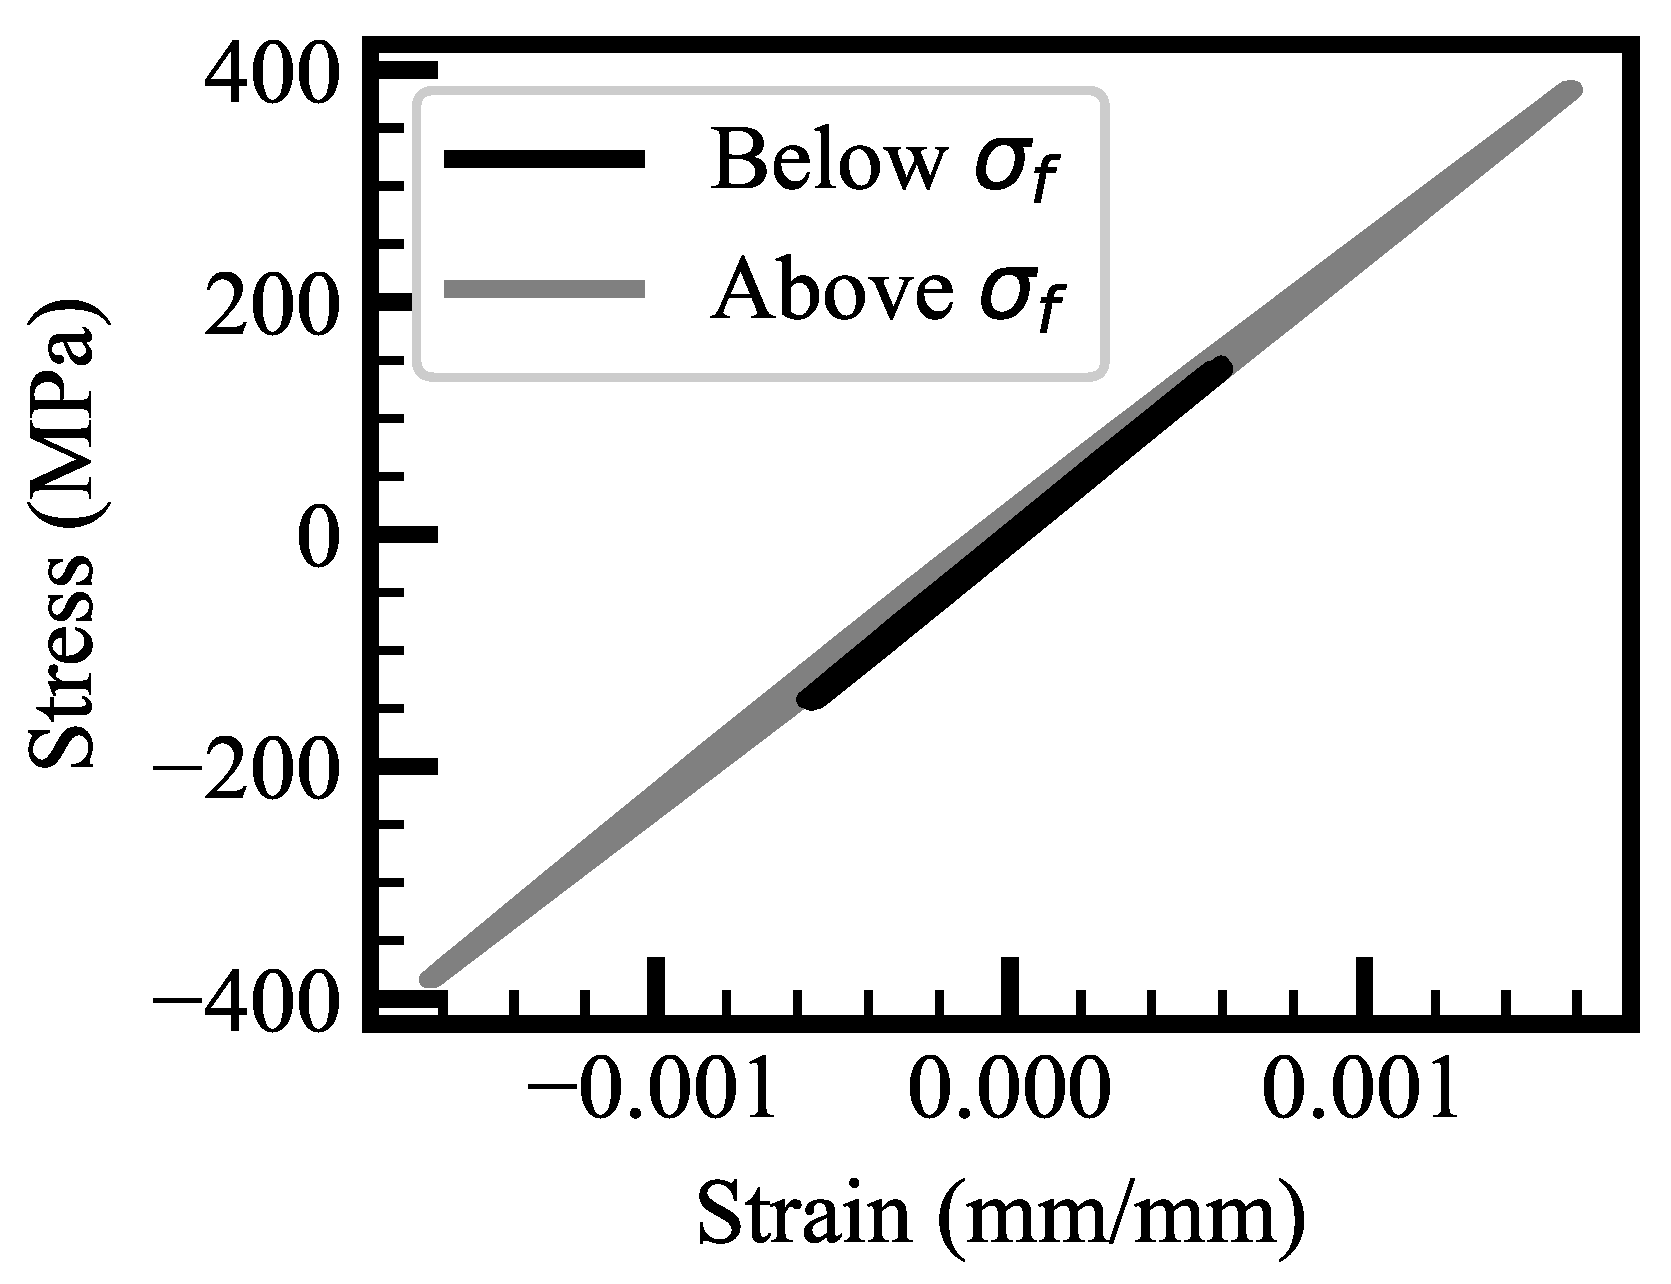
2.3. Thermal Behavior Below and Above the Fatigue Limit
The surface temperature increment, , during cyclic loading correlates with intrinsic dissipation and follows different expressions depending on whether the applied stress is below or above the fatigue limit.
Below the Fatigue Limit
For stress amplitudes below the fatigue limit, the thermal behavior is predominantly due to anelastic phenomena. The surface temperature increment is described by
where
is the thermal time constant,
is the material density,
c is the specific heat capacity,
is the phase angle between stress and strain,
f is the loading frequency,
E is the Young’s modulus, and
is the applied stress amplitude.
Above the Fatigue Limit
For stress amplitudes above the fatigue limit, the thermal behavior is dominated by microplasticization and dislocation motion. The surface temperature increment is as follows:
where
m is a material-dependent parameter,
h is the hardening modulus, and
is a scale parameter related to the material’s microstructural properties.
These equations are used to fit the experimental thermographic data, allowing for the accurate estimation of the fatigue limit through the iterative algorithm.
In
Figure 1, the differences in hysteresis cycle area when above or below fatigue limit are clearly visible.
2.4. Experimental Setup
To validate the iterative algorithm, both Step Loading (SL) and Constant Amplitude Loading (CAL) tests were performed. The tests were conducted using an Instron 8800 (Norwood, USA) testing frame with a dynamic load capacity of ±100 kN. Flat and cylindrical specimens were tested at different frequencies. Surface temperature was measured using a PI-400 infrared (IR) camera (Washington, USA), and all specimens were painted black to ensure accurate emissivity readings (set to 0.95).
The tests were carried out under push–pull loading conditions () and frequencies ranging from 10 Hz to 45 Hz. In the CAL tests, the stress amplitude started from 80 MPa and increased in steps of 20 MPa up to 300 MPa. The SL tests involved incrementally increasing the stress amplitude within a single test. Special attention was given to the variation in the testing frequency to study its impact on the thermal response.
3. Results
This section presents the results of the experimental campaign, focusing on the application of the iterative methodology for fatigue limit estimation based on thermographic data.
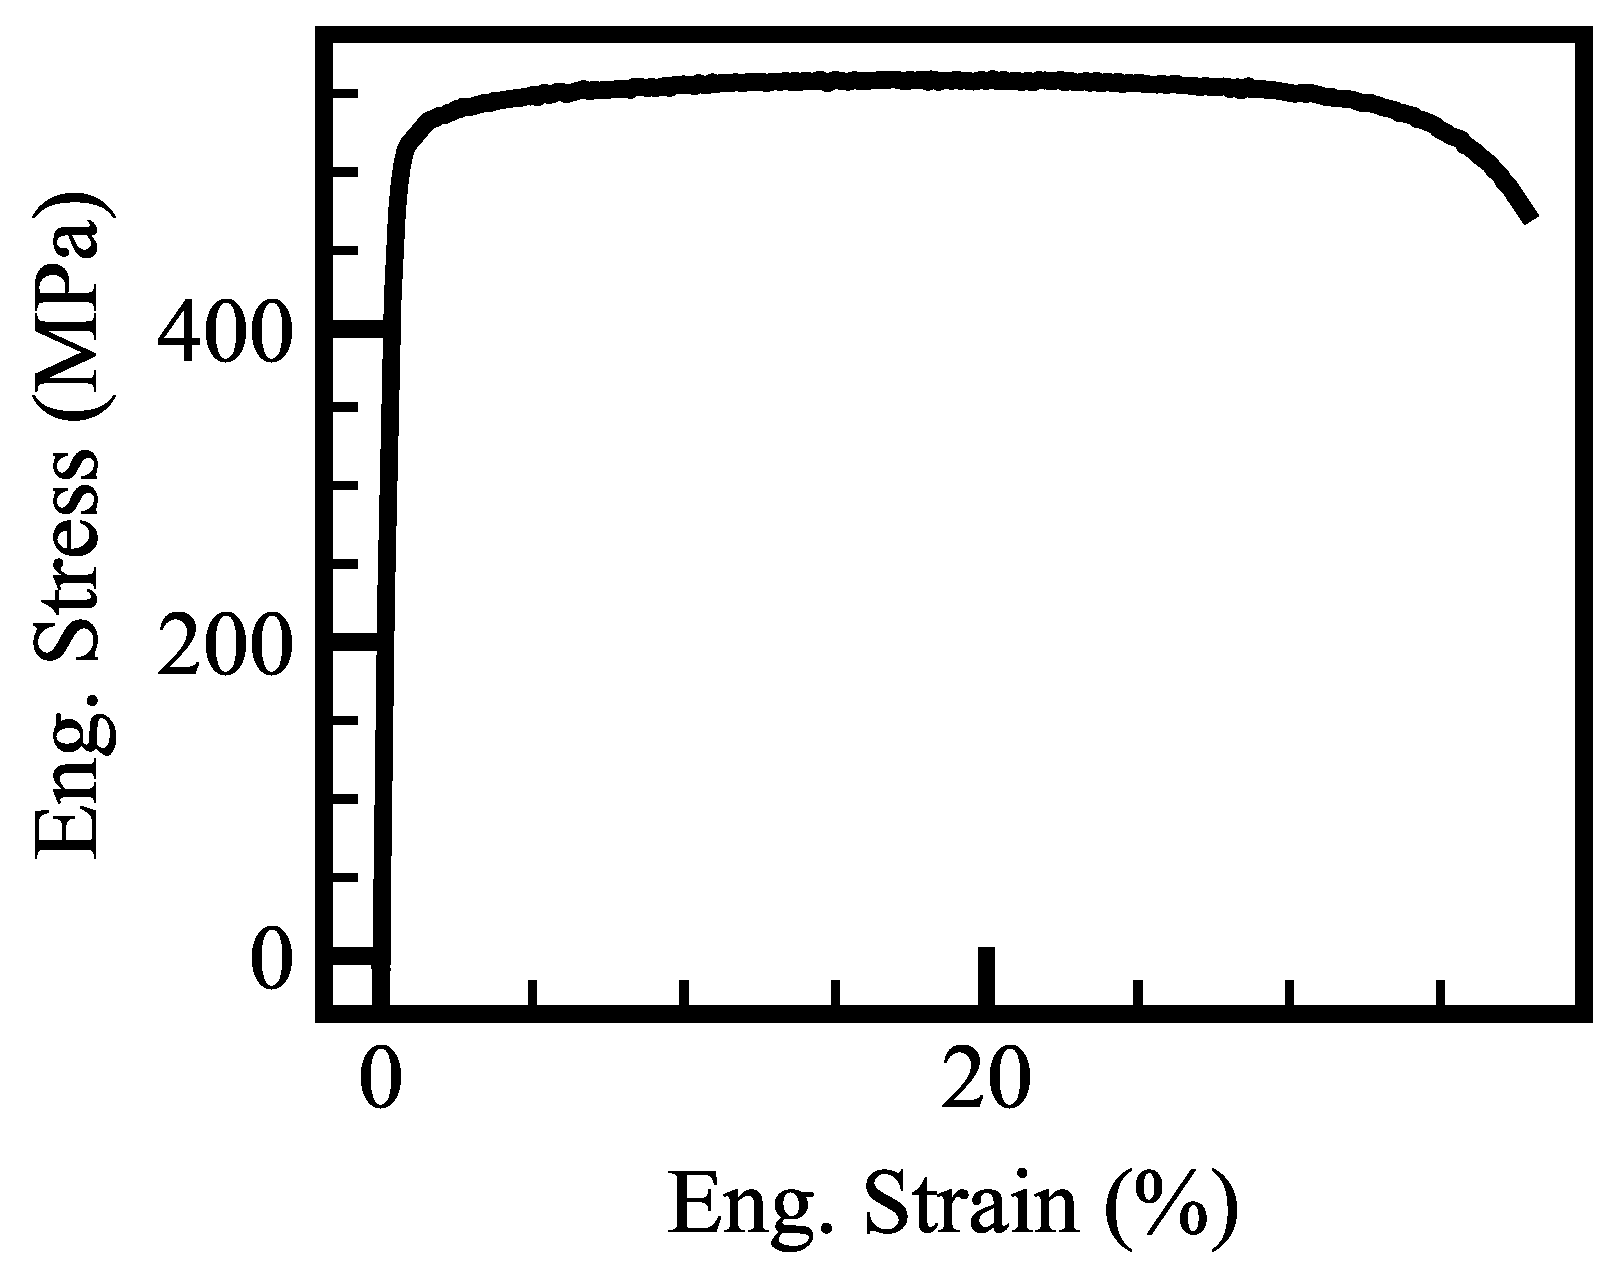
3.1. Mechanical Testing
The results of the tensile tests, illustrated in
Figure 2, show a yield point of approximately 520 MPa for flat specimens produced via PBF-LB/M. The cylindrical specimens reported in [
15] exhibit a lower yield stress of 471 MPa. Both specimen types demonstrated significant ductility, with elongation to rupture exceeding 30%. This confirms the material’s high strength and ductile behavior.
3.2. Fatigue Testing Results
The fatigue testing campaign, performed on flat specimens, provides a set of stress versus cycles (S-N) data. The results, as presented in
Figure 3, show that the fatigue resistance at 1 million cycles is approximately 150 MPa. This is notably lower than the material’s yield stress, with the fatigue limit being more than three times lower than the yield strength.
3.3. Iterative Fatigue Limit Estimation Using Thermographic Data
The iterative methodology was applied to both Constant Amplitude Loading (CAL) and Step Loading (SL) tests. The aim was to estimate the fatigue limit by fitting thermal data based on surface temperature increments.
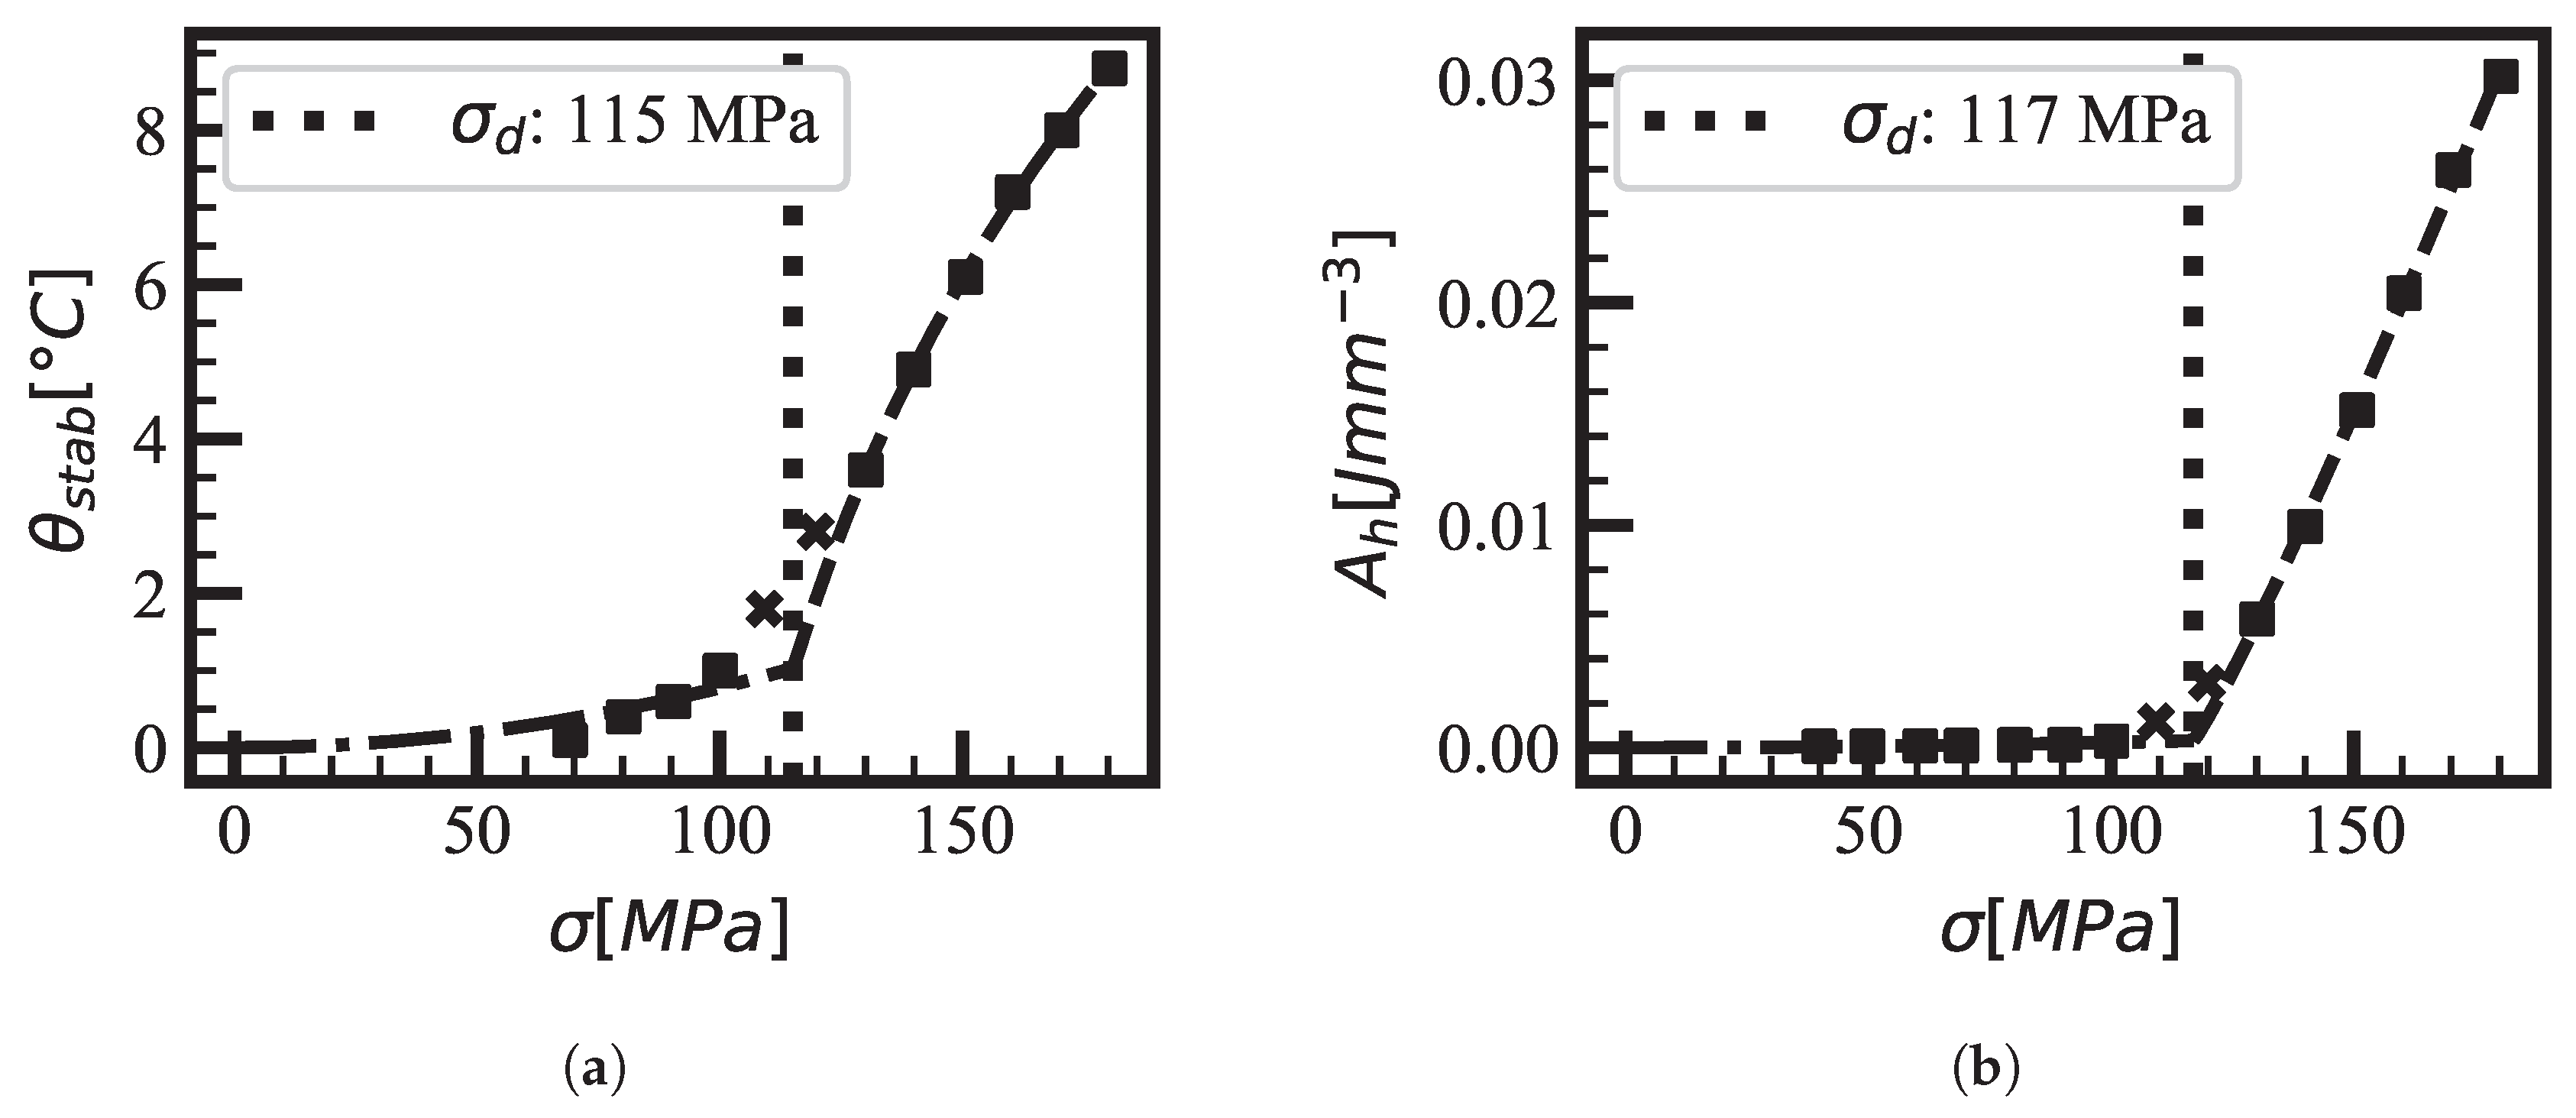
3.3.1. Thermographic Analysis for CAL Tests
Figure 4a presents the stabilized surface temperature increment
versus stress amplitude for the CAL series. The fitted curve shows a clear bi-power law behavior, particularly for stresses below the fatigue limit. This behavior is consistent with expectations for bulk materials and aligns with observations in the literature [
16,
17].
The hysteresis area analysis in
Figure 4b follows a similar bi-power law behavior, although some deviation is noted at the 15 Hz testing frequency due to insufficient heat generation. The iterative algorithm was able to estimate the fatigue limit with reasonable accuracy, despite the minor discrepancies in thermal behavior at low frequencies.
3.3.2. Thermographic Analysis for SL Tests
SL tests provided a more direct assessment of the fatigue limit, as shown in
Figure 5a. The iterative method applied to SL test data at 15 Hz identified a noticeable knee in the curve around 150 MPa, consistent with the fatigue limit observed in the CAL tests.
At 45 Hz (
Figure 5b), the surface temperature increments were more pronounced, providing clearer results with fewer steps. The iterative method effectively identified the fatigue limit, confirming the methodology’s robustness at higher frequencies.
3.4. Round Specimen Testing
Testing on round specimens, as shown in
Figure 6a, identified a fatigue limit around 100 MPa. Despite variability in the stress range between 80 MPa and 120 MPa, the iterative method was able to track the surface temperature evolution and estimate the fatigue limit with reasonable accuracy.
4. Conclusions
The iterative method applied in this study has proven effective in estimating the fatigue limit of additively manufactured AISI 316L specimens. By utilizing thermographic data, specifically surface temperature increments, the method offers a more efficient approach to fatigue testing, reducing the number of tests required.
Key findings from this research include the following:
The iterative methodology successfully estimated the fatigue limit using both CAL and SL tests, with minimal errors in curve fitting.
The application of the SL test methodology proved beneficial in rapidly estimating the fatigue limit, especially at higher frequencies, where the surface temperature increment was more pronounced.
Round specimens exhibited a fatigue limit of approximately 100 MPa, with variability in the mid-stress range. The iterative method was able to account for this variability.
This study demonstrates the potential of thermographic techniques, combined with iterative algorithms, for fatigue testing, particularly in additively manufactured materials. Future research could explore optimizing the method for different materials and test configurations to further enhance its applicability.
Author Contributions
Conceptualization, R.S.; Methodology, L.S.; Software, L.S.; writing—original draft preparation, L.S.; supervision, F.M.C. All authors have read and agreed to the published version of the manuscript.
Funding
This research received no external funding.
Data Availability Statement
The data will be shared on request.
Acknowledgments
The authors thanks Mensinger of the Technical University of Munich for manufacturing the specimens and providing the test equipment.
Conflicts of Interest
The authors declare no conflicts of interest.
References
- Lazan, B.J. Damping Studies in Materials Science and Materials Engineering. In Internal Friction, Damping, and Cyclic Plasticity; Pergamon Press: Oxford, UK, 1965; pp. 1–20. [Google Scholar] [CrossRef]
- Sesana, R.; Santoro, L. Proposal for kf effective notch factor estimation for life assessment of welded joint based on geometric parameters. Eng. Fail. Anal. 2024, 157, 107944. [Google Scholar] [CrossRef]
- Charkaluk, E.; Constantinescu, A. Dissipative aspects in high cycle fatigue. Mech. Mater. 2009, 41, 483–494. [Google Scholar] [CrossRef]
- Meneghetti, G.; Ricotta, M. The use of the specific heat loss to analyse the low- and high-cycle fatigue behaviour of plain and notched specimens made of a stainless steel. Eng. Fract. Mech. 2012, 81, 2–16. [Google Scholar] [CrossRef]
- Connesson, N.; Maquin, F.; Pierron, F. Dissipative energy as an indicator of material microstructural evolution. EPJ Web Conf. 2010, 6, 38013. [Google Scholar] [CrossRef]
- Zaeimi, M.; De Finis, R.; Palumbo, D.; Galietti, U. Fatigue limit estimation of metals based on the thermographic methods: A comprehensive review. Fatigue Fract. Eng. Mater. Struct. 2024, 47, 611–646. [Google Scholar] [CrossRef]
- Maquin, F.; Pierron, F. Heat dissipation measurements in low stress cyclic loading of metallic materials: From internal friction to micro-plasticity. Mech. Mater. 2009, 41, 928–942. [Google Scholar] [CrossRef]
- Chrysochoos, A.; Louche, H. An infrared image processing to analyse the calorific effects accompanying strain localisation. Int. J. Eng. Sci. 2000, 38, 1759–1788. [Google Scholar] [CrossRef]
- Doudard, C.; Calloch, S. Influence of hardening type on self-heating of metallic materials under cyclic loadings at low amplitude. Eur. J. Mech. A/Solids 2009, 28, 233–240. [Google Scholar] [CrossRef]
- De Finis, R.; Palumbo, D.; Galietti, U. A multianalysis thermography-based approach for fatigue and damage investigations of ASTM A182 F6NM steel at two stress ratios. Fatigue Fract. Eng. Mater. Struct. 2019, 42, 267–283. [Google Scholar]
- Palumbo, D.; Galietti, U. Characterisation of steel welded joints by infrared thermographic methods. Quant. Infrared Thermogr. 2014, 11, 29–42. [Google Scholar] [CrossRef]
- Curà, F.; Curti, G.; Sesana, R. A new iteration method for the thermographic determination of fatigue limit in steels. Int. J. Fatigue 2005, 27, 453–459. [Google Scholar] [CrossRef]
- Santoro, L.; Sesana, R.; Diller, J.; Radlbeck, C.; Mensinger, M. Dissipative and thermal aspects in cyclic loading of additive manufactured AISI 316L. Eng. Fail. Anal. 2024, 163, 108446. [Google Scholar] [CrossRef]
- Puškár, A. Internal Friction of Materials; Cambridge International Science Publishing: Cambridge, UK, 2003; p. 326. [Google Scholar]
- Diller, J.; Blankenhagen, J.; Siebert, D.; Radlbeck, C.; Mensinger, M. Combined effect of surface treatment and heat treatment on the fatigue properties of AISI 316L, manufactured by powder bed fusion of metals using a laser (PBF-LB/M). Int. J. Fatigue 2024, 178, 108025. [Google Scholar] [CrossRef]
- Curà, F.; Gallinatti, A.E.; Sesana, R. Dissipative aspects in thermographic methods. Fatigue Fract. Eng. Mater. Struct. 2012, 35, 1133–1147. [Google Scholar] [CrossRef]
- Curà, F.; Sesana, R. Mechanical and thermal parameters for high-cycle fatigue characterization in commercial steels. Fatigue Fract. Eng. Mater. Struct. 2014, 37, 883–896. [Google Scholar] [CrossRef]
| Disclaimer/Publisher’s Note: The statements, opinions and data contained in all publications are solely those of the individual author(s) and contributor(s) and not of MDPI and/or the editor(s). MDPI and/or the editor(s) disclaim responsibility for any injury to people or property resulting from any ideas, methods, instructions or products referred to in the content. |
© 2025 by the authors. Licensee MDPI, Basel, Switzerland. This article is an open access article distributed under the terms and conditions of the Creative Commons Attribution (CC BY) license (https://creativecommons.org/licenses/by/4.0/).


