1. Introduction
Mechanical metamaterials, particularly those based on triply periodic minimal surfaces, have gained significant interest in recent years due to their unique structural properties and potential applications in diverse fields, such as aerospace [
1], bioengineering [
2], and energy [
3]. Among TPMS structures, the gyroid surface is particularly notable due to its combination of mechanical strength, a lightweight nature, and complex geometry, making it ideal for stress-dissipative applications [
4]. One potential future application for gyroid-based metamaterials is in sacrificial limiters for plasma-facing components in Tokamaks [
5,
6]. Such limiters must balance competing thermal and mechanical requirements: they must exhibit high thermal conductivity during standard operation while maintaining low conductivity under transient high thermal flux events [
7], such as Vertical Displacement Events (VDEs). This work, though focused solely on the mechanical characterization of gyroid cells, forms the foundation for a broader investigation into the multi-physical behavior of these structures. The objective of the present study is to investigate the mechanical response of gyroid cells under compression. The study encompasses both experimental compression tests on 3D-printed specimens and FEM simulations, aiming to validate the numerical model with experimental results. The primary focus is on characterizing the equivalent Young’s modulus of the gyroid structures, providing a critical understanding of their mechanical behavior and setting the stage for future research into multi-physical characterizations and potential engineering applications.
2. Materials and Methods
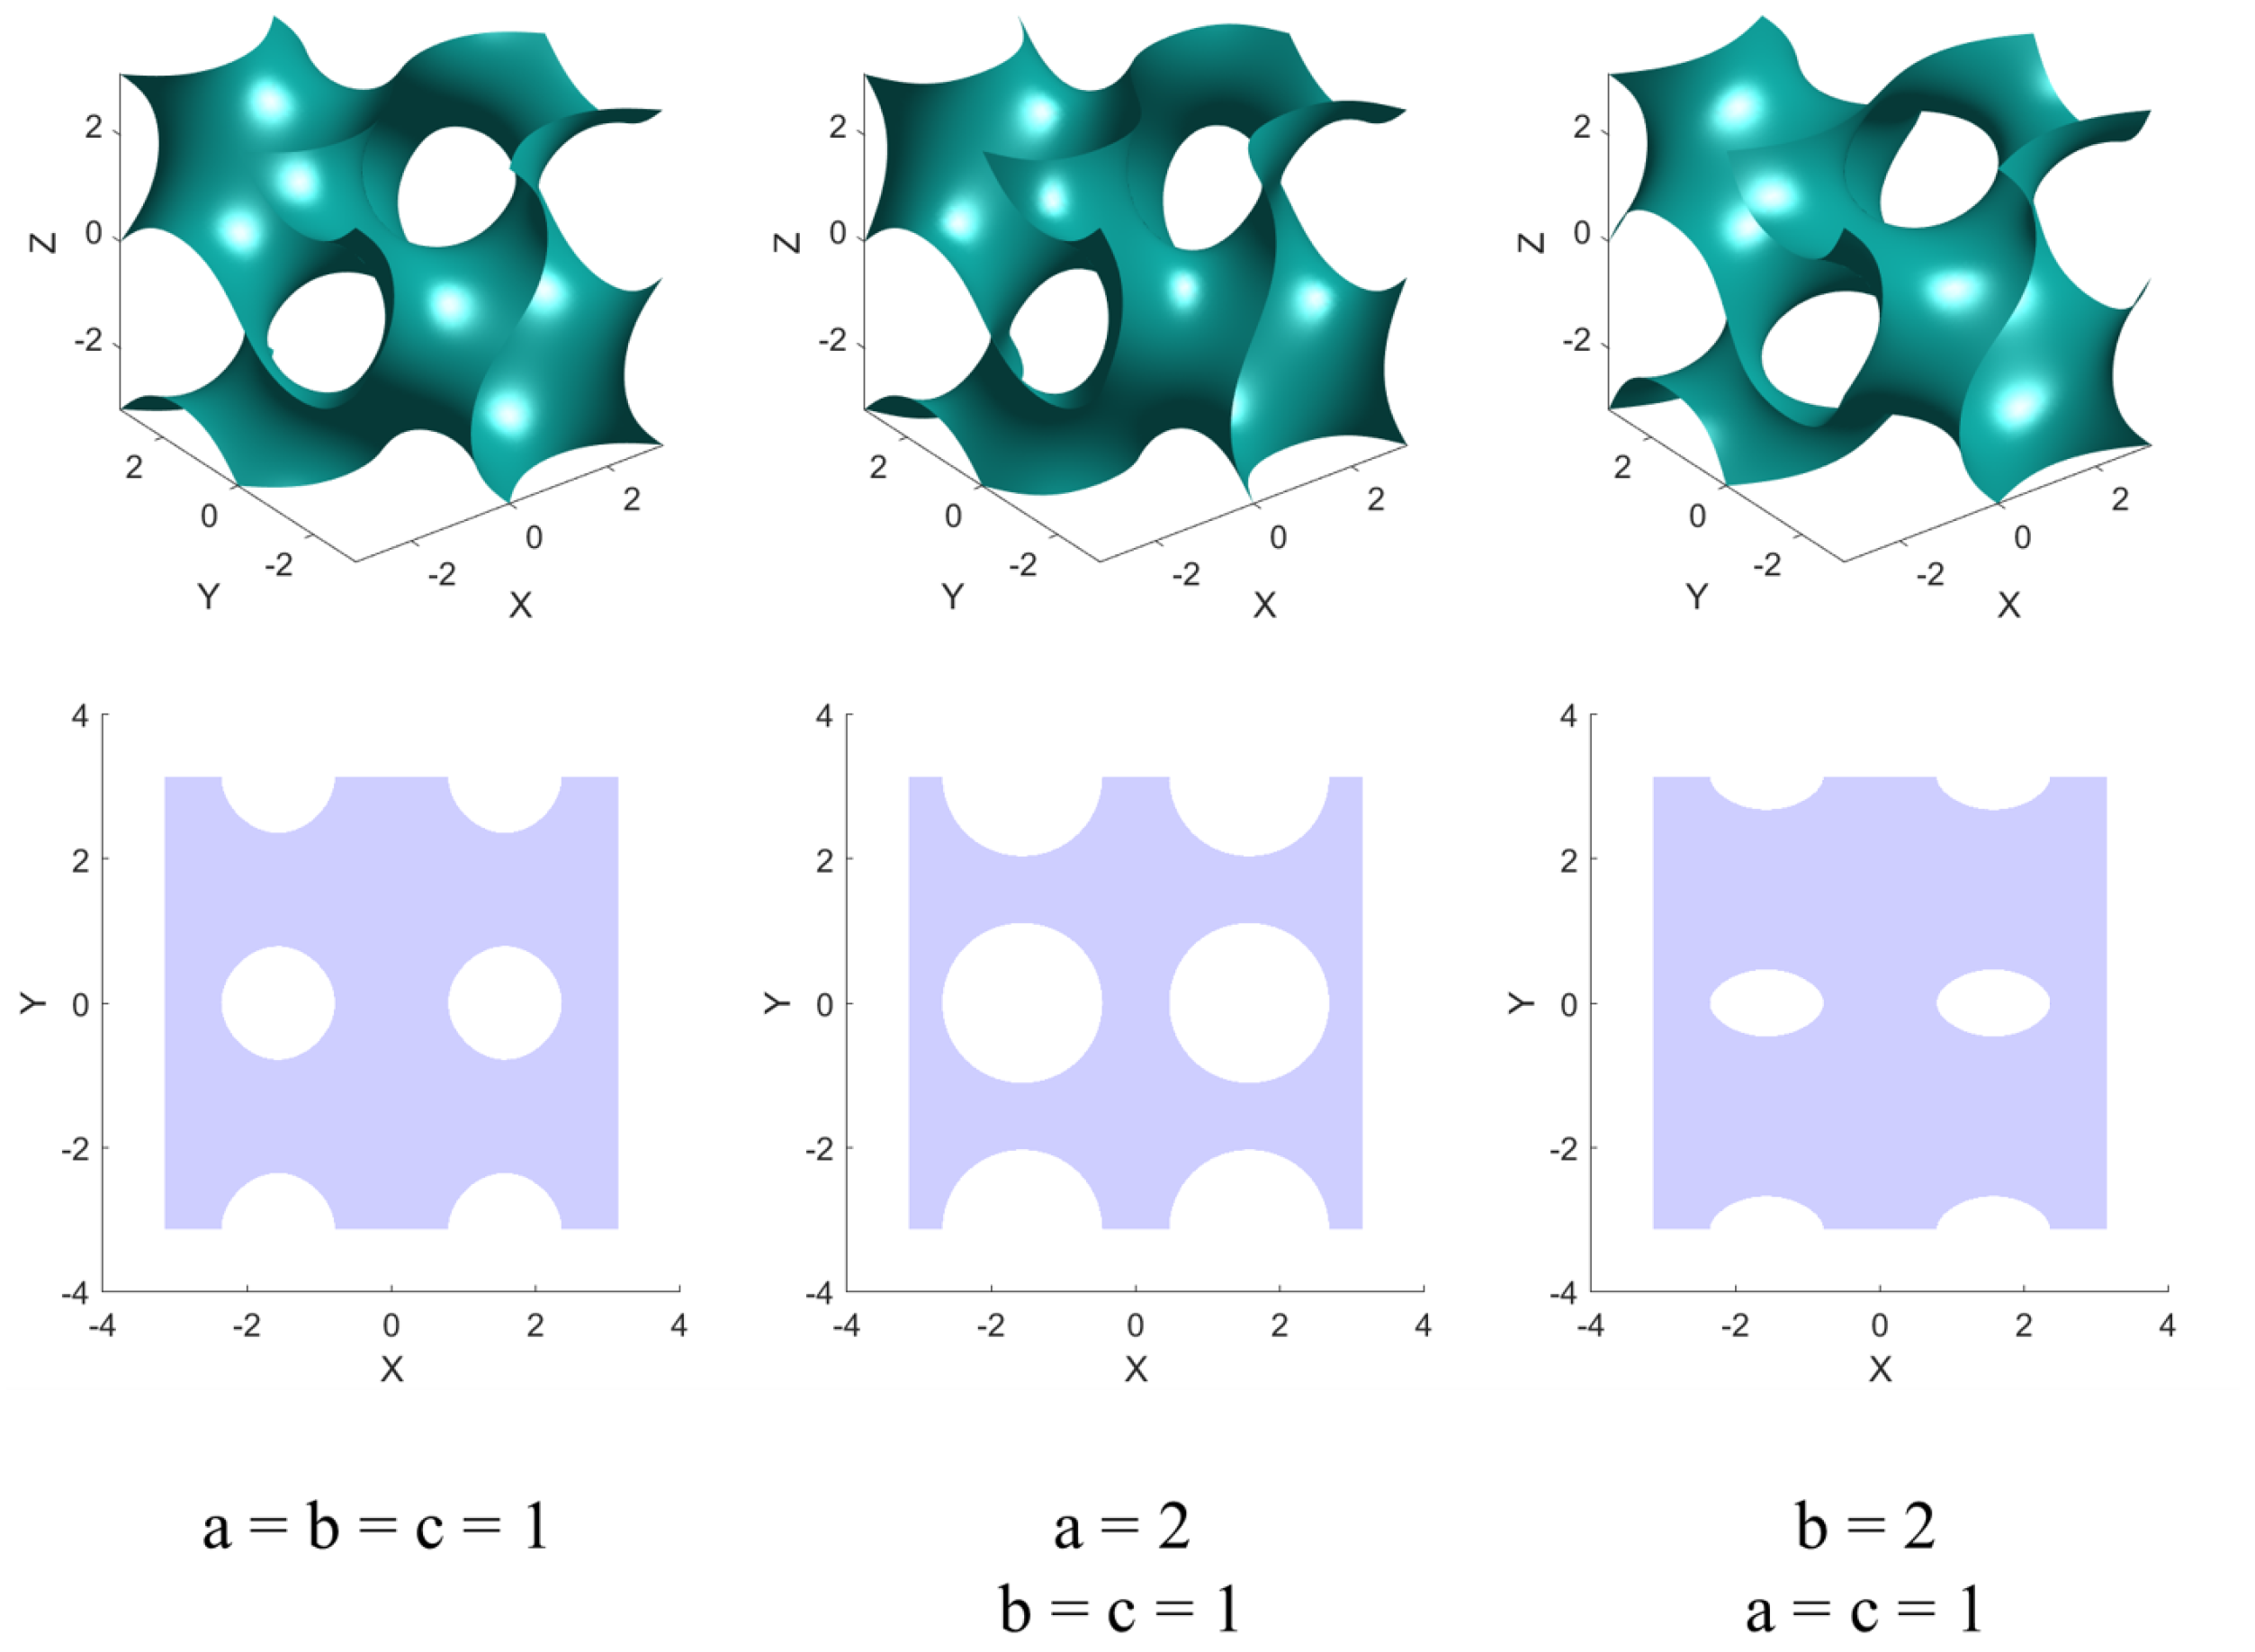
2.1. Gyroid Geometry and Parametrization
The gyroid equation has been parameterized through the introduction of multiplicative coefficients (
a,
b,
c) and a constant term (
d).
where
a,
b, and
c control the shape of the gyroid, introducing anisotropy in the cell structure (
Figure 1), and d offsets the surface along its normal (
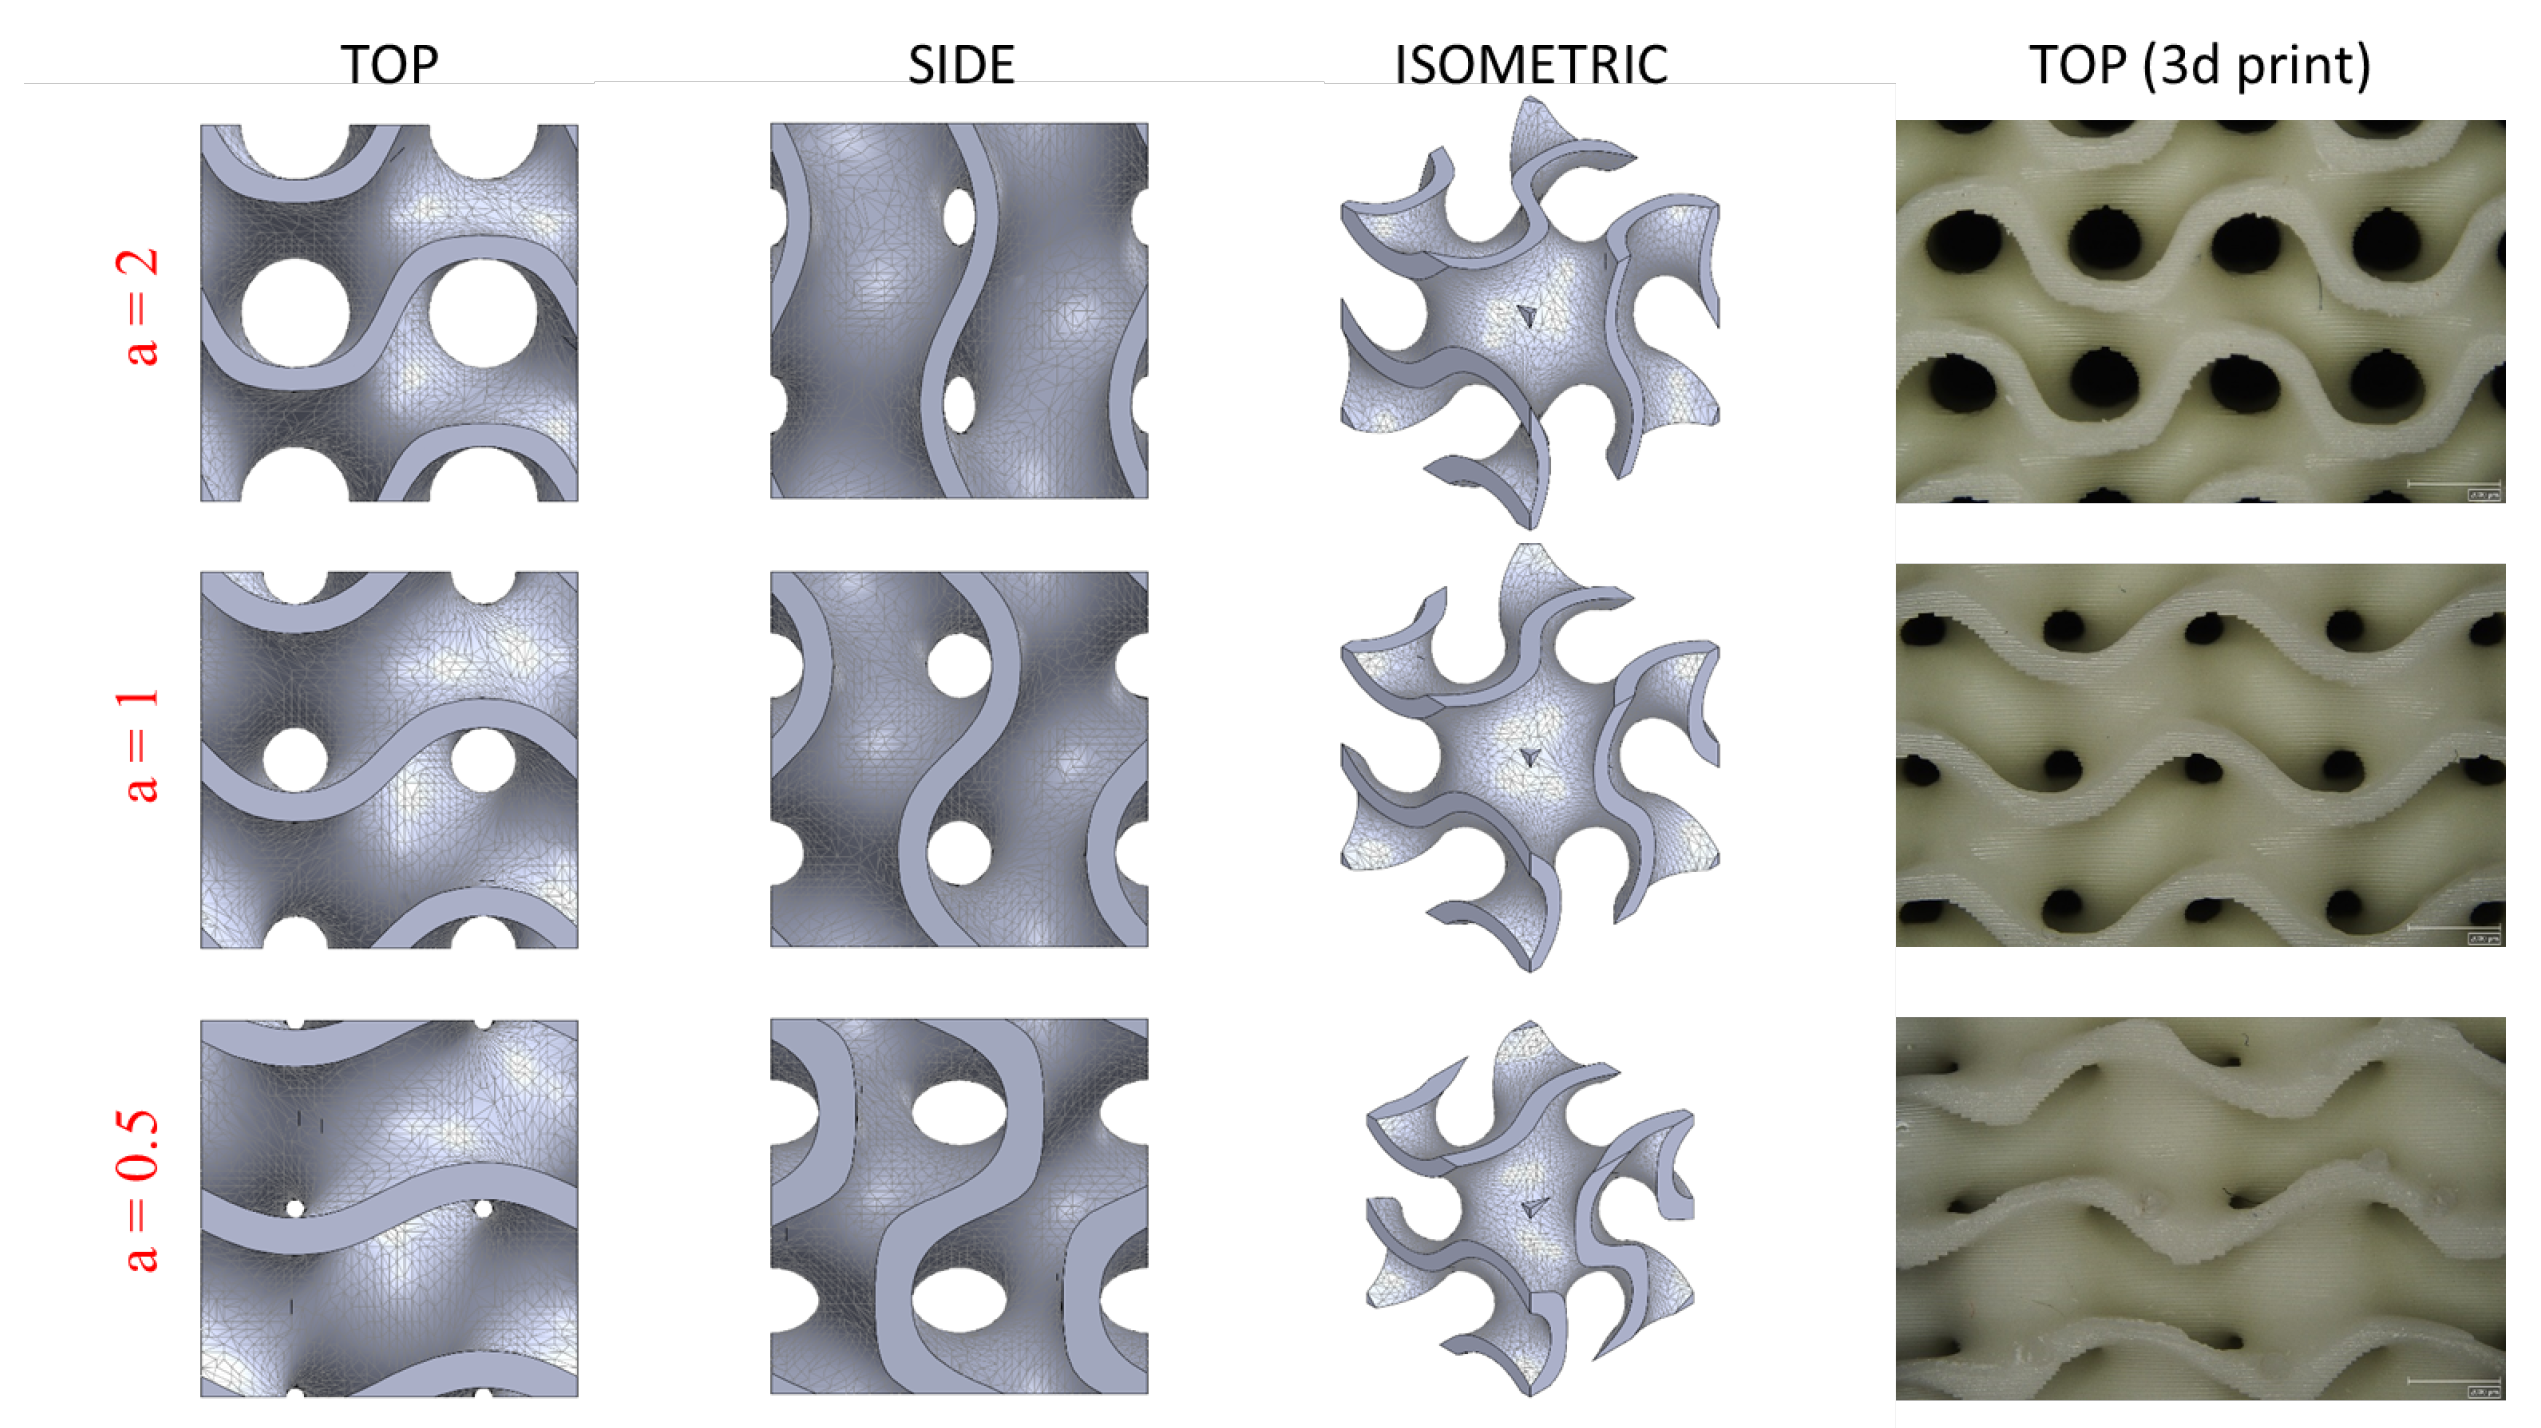
Figure 2). For this study, three different cell morphologies were generated by varying the parameter
a while keeping
,
and ensuring the same surface thickness (
Figure 3). A parametric MATLAB code was developed that can generate an STL file of each cell morphology, which can be used both for the 3D printing of the samples and for generating the FEM shell mesh.
2.2. Specimen Fabrication
Three morphologies were generated with , (isotropic cell), and , keeping the other parameters constant (). Each cell measures and has a surface thickness of 0.5 mm. These geometries were then sliced using slicer software and printed using an LCD-based 3D printer (layer thickness of 0.05 mm) with a commercial resin (FormFutura Economy LCD resin). Five specimens were printed for each morphology in a 5 × 5 × 5 cell arrangement, providing sufficient material for statistical analysis. For each morphology, one of the specimens was printed in a different batch to evaluate the influence of printing repeatability on the mechanical response.
The 3D printing procedure required support structures, whose removal left residual protrusions on the specimens. During compression testing, these residues are the first to come into contact with the compression platens, delaying full surface contact and resulting in the presence of a settling phase in the force–displacement curve unrelated to the cellular morphology’s mechanical response. Therefore, two specimens per morphology were lapped prior to testing to evaluate how surface preparation influenced the extent of the settling phase.
2.3. Compression Testing
The printed specimens were subjected to uniaxial compression tests to measure their mechanical properties with an electromechanical machine, MTS Exceed, equipped with compression platens and a 50 kN load cell. The testing parameters were as follows: a preload of 5 N, a maximum crosshead displacement of 3 mm, and a loading rate of 0.25 mm/min. From the linear region of the force–displacement (
L and
d) curve, a relationship between equivalent uniaxial stress and equivalent strain was calculated that would be characteristic of a material of identical dimensions as the specimens, but consisting of homogeneous material:
From this relationship between the stress and strain of the homogenized material, the Young’s modulus was calculated by fitting the linear region using a least-squares regression. For each morphology, an average value with relative uncertainty was obtained for the equivalent Young’s modulus
, the maximum load reached during the test
, and the displacement relative to the point of maximum load
.
2.4. Finite Element Model
Prior to meshing, the STL surfaces generated by the MATLAB code underwent a cleaning process that exploited the dedicated functions of ANSYS SpaceClaim. Specifically, the procedure involved regenerating the STL mesh with smaller triangular elements of a more uniform shape and size, allowing the fitting of multiple curved patch surfaces that accurately interpolated the entire geometry with minimal errors, which needed to be individually fixed. This process enabled to export the surfaces in STEP format, in order to be meshed in ANSA pre-processor with shell meshes consisting mainly of quad elements. Numerical simulations were conducted using ANSYS APDL. Each cell morphology was modeled with an elastic-perfectly plastic material with a yield stress of 50 MPa (based on resin datasheet) to prevent localized stress intensification beyond the material limit from resulting in a fictitious increase in strength. The Young’s modulus of the resin was measured by tensile testing of a dog bone specimen made using the same material, printer, and printing parameters of the gyroid samples. The FEM simulations were used to predict the force–displacement response under compressive loading, and the results were compared with experimental data. Similar to how an equivalent Young’s modulus was calculated for the experimental tests, a simulated equivalent Young’s modulus was also calculated from the results of the FEM analysis by reporting the force–displacement relationship in terms of stress-strain of the homogenized material.
3. Results
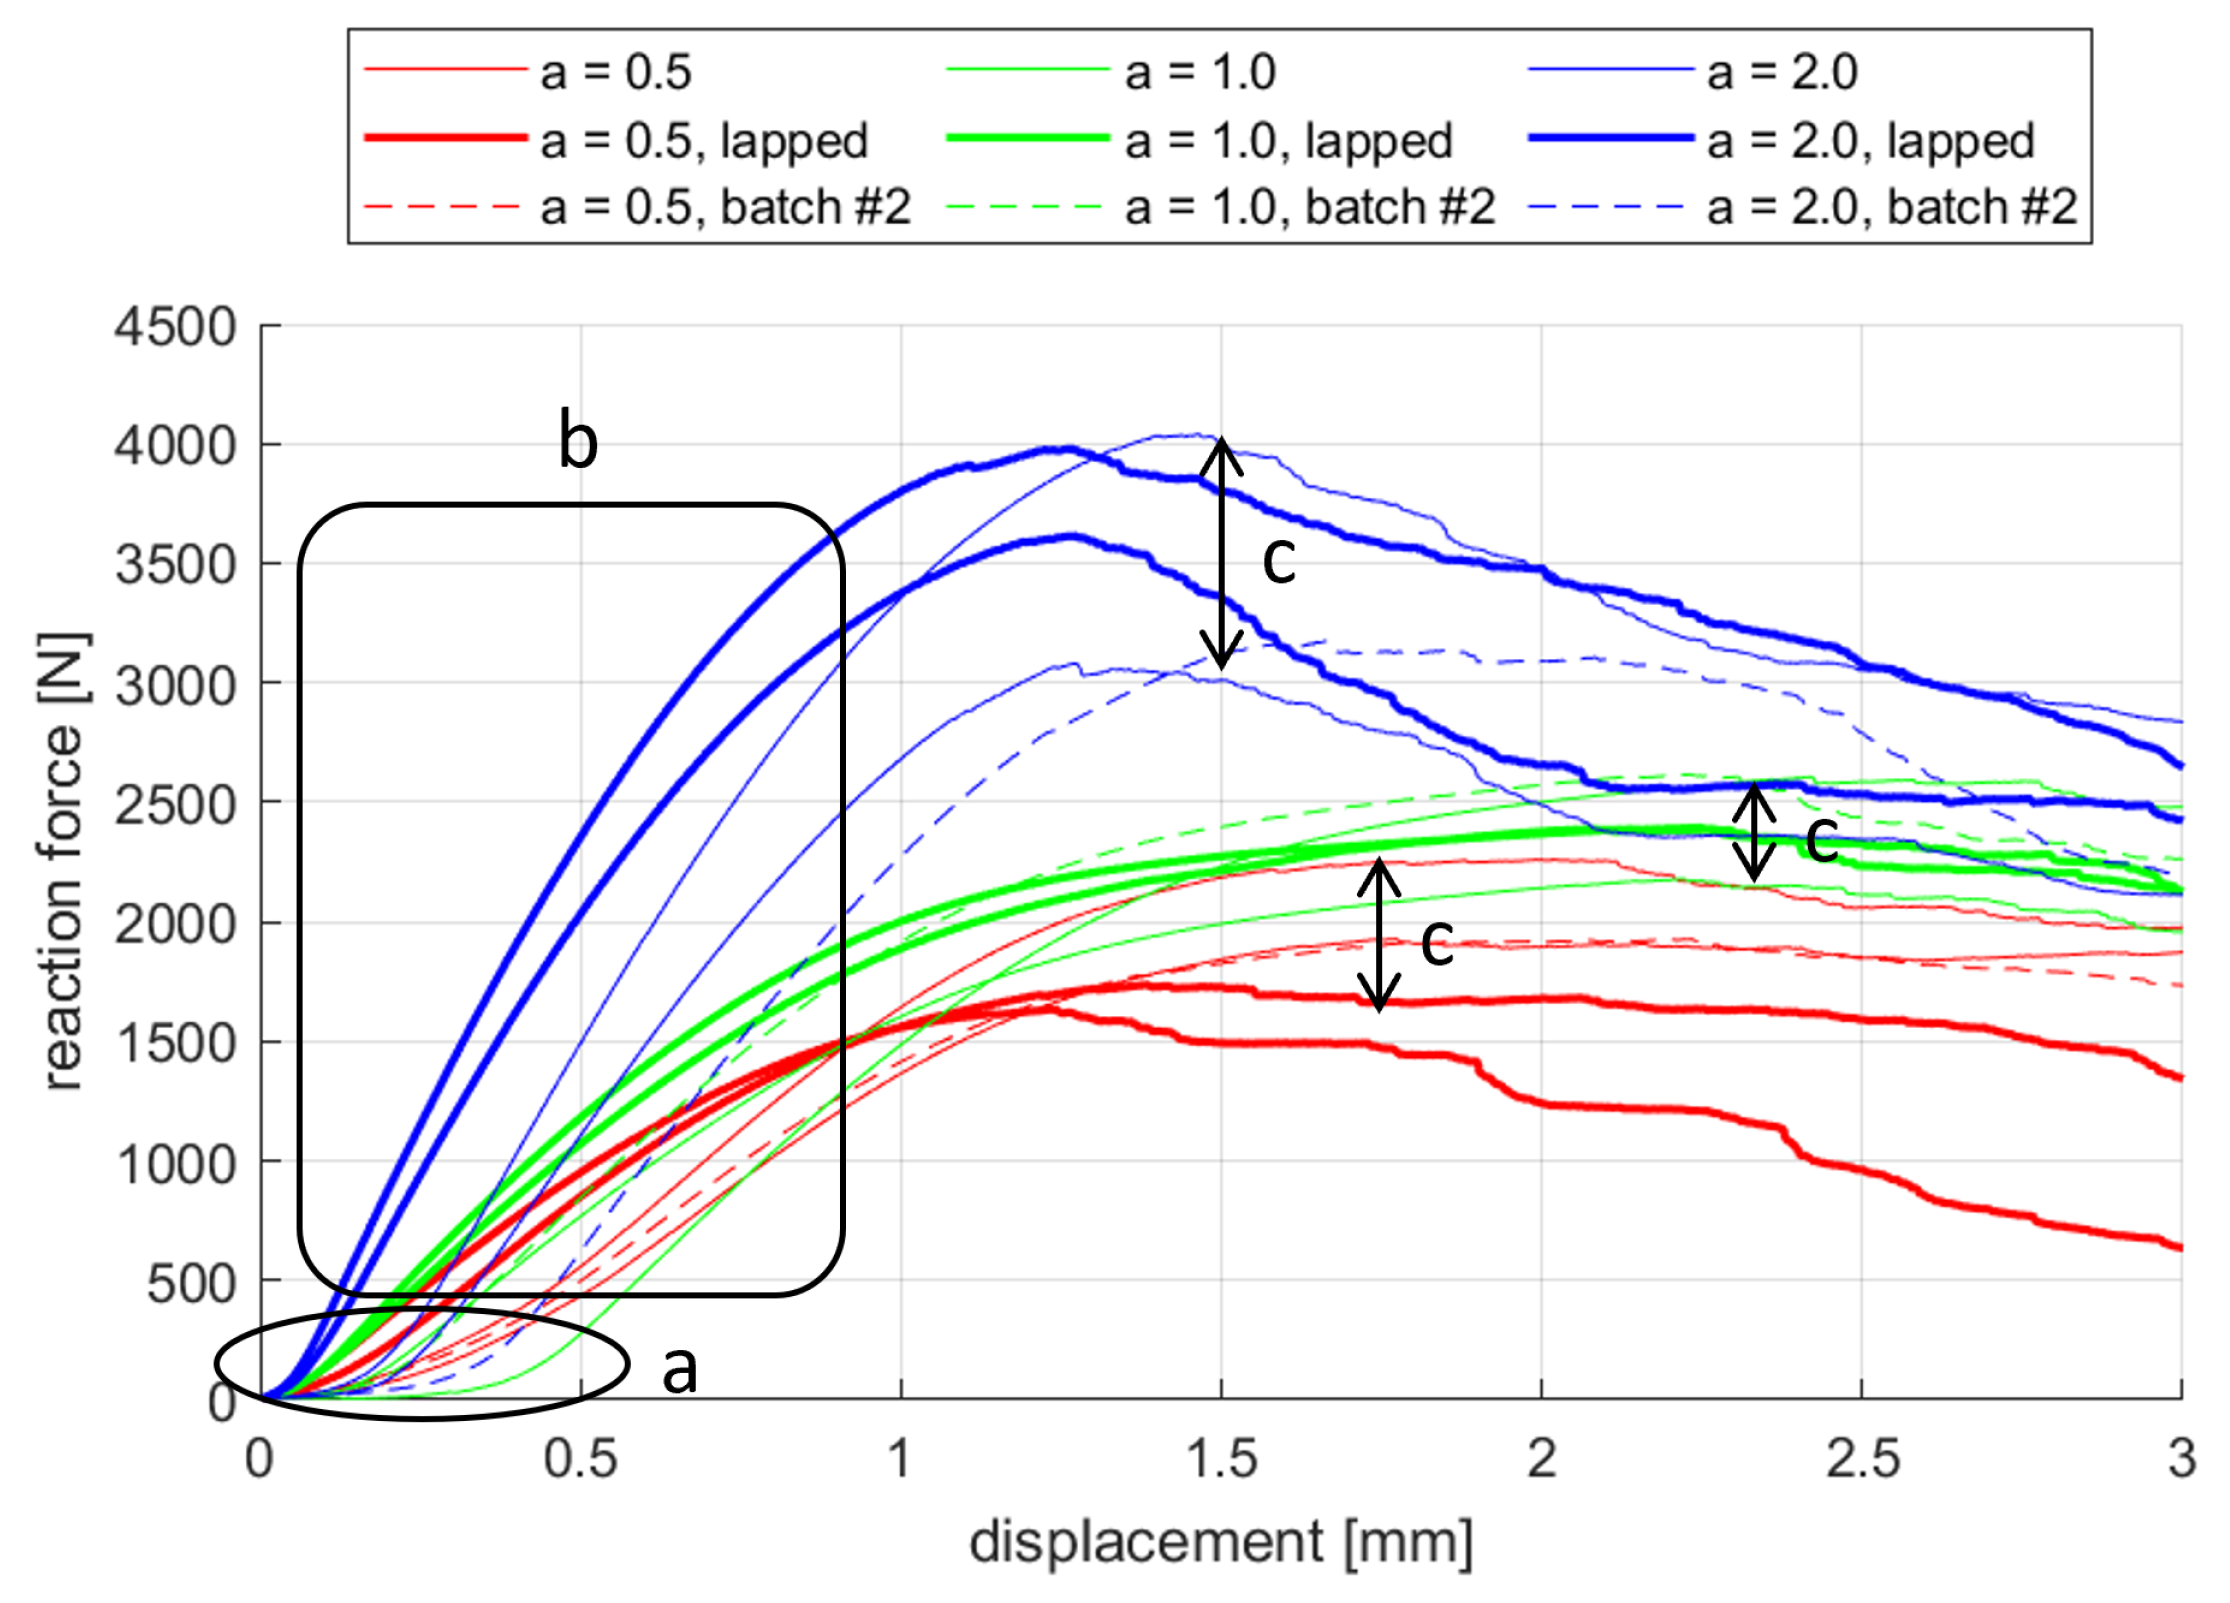
All force–displacement curves obtained from experimental testing exhibit a similar trend (
Figure 4): an initial settling stage, followed by a linear elastic region, and culminating in non-linear deformation leading to failure. Remarks should be made regarding the entire set of results, with reference to
Figure 4.
- a
The presence of a settling phase indicates that the 5 N preload assumed for compression tests is not sufficient, and for future experimental campaigns a preload on the order of 100 N would be more suitable. Alternatively, lower preload is admissible provided the specimens are lapped according to the force–displacement curves associated with the lapped specimens, as this operation homogenizes the contact surface with the plates of the compression machine and reduces the settlement phase as discussed in
Section 2.2.
- b
A different mechanical behavior among the three cell morphologies in the linear region is tangible.
- c
There is a rather wide variability in the maximum load achieved by specimens of each cell type.
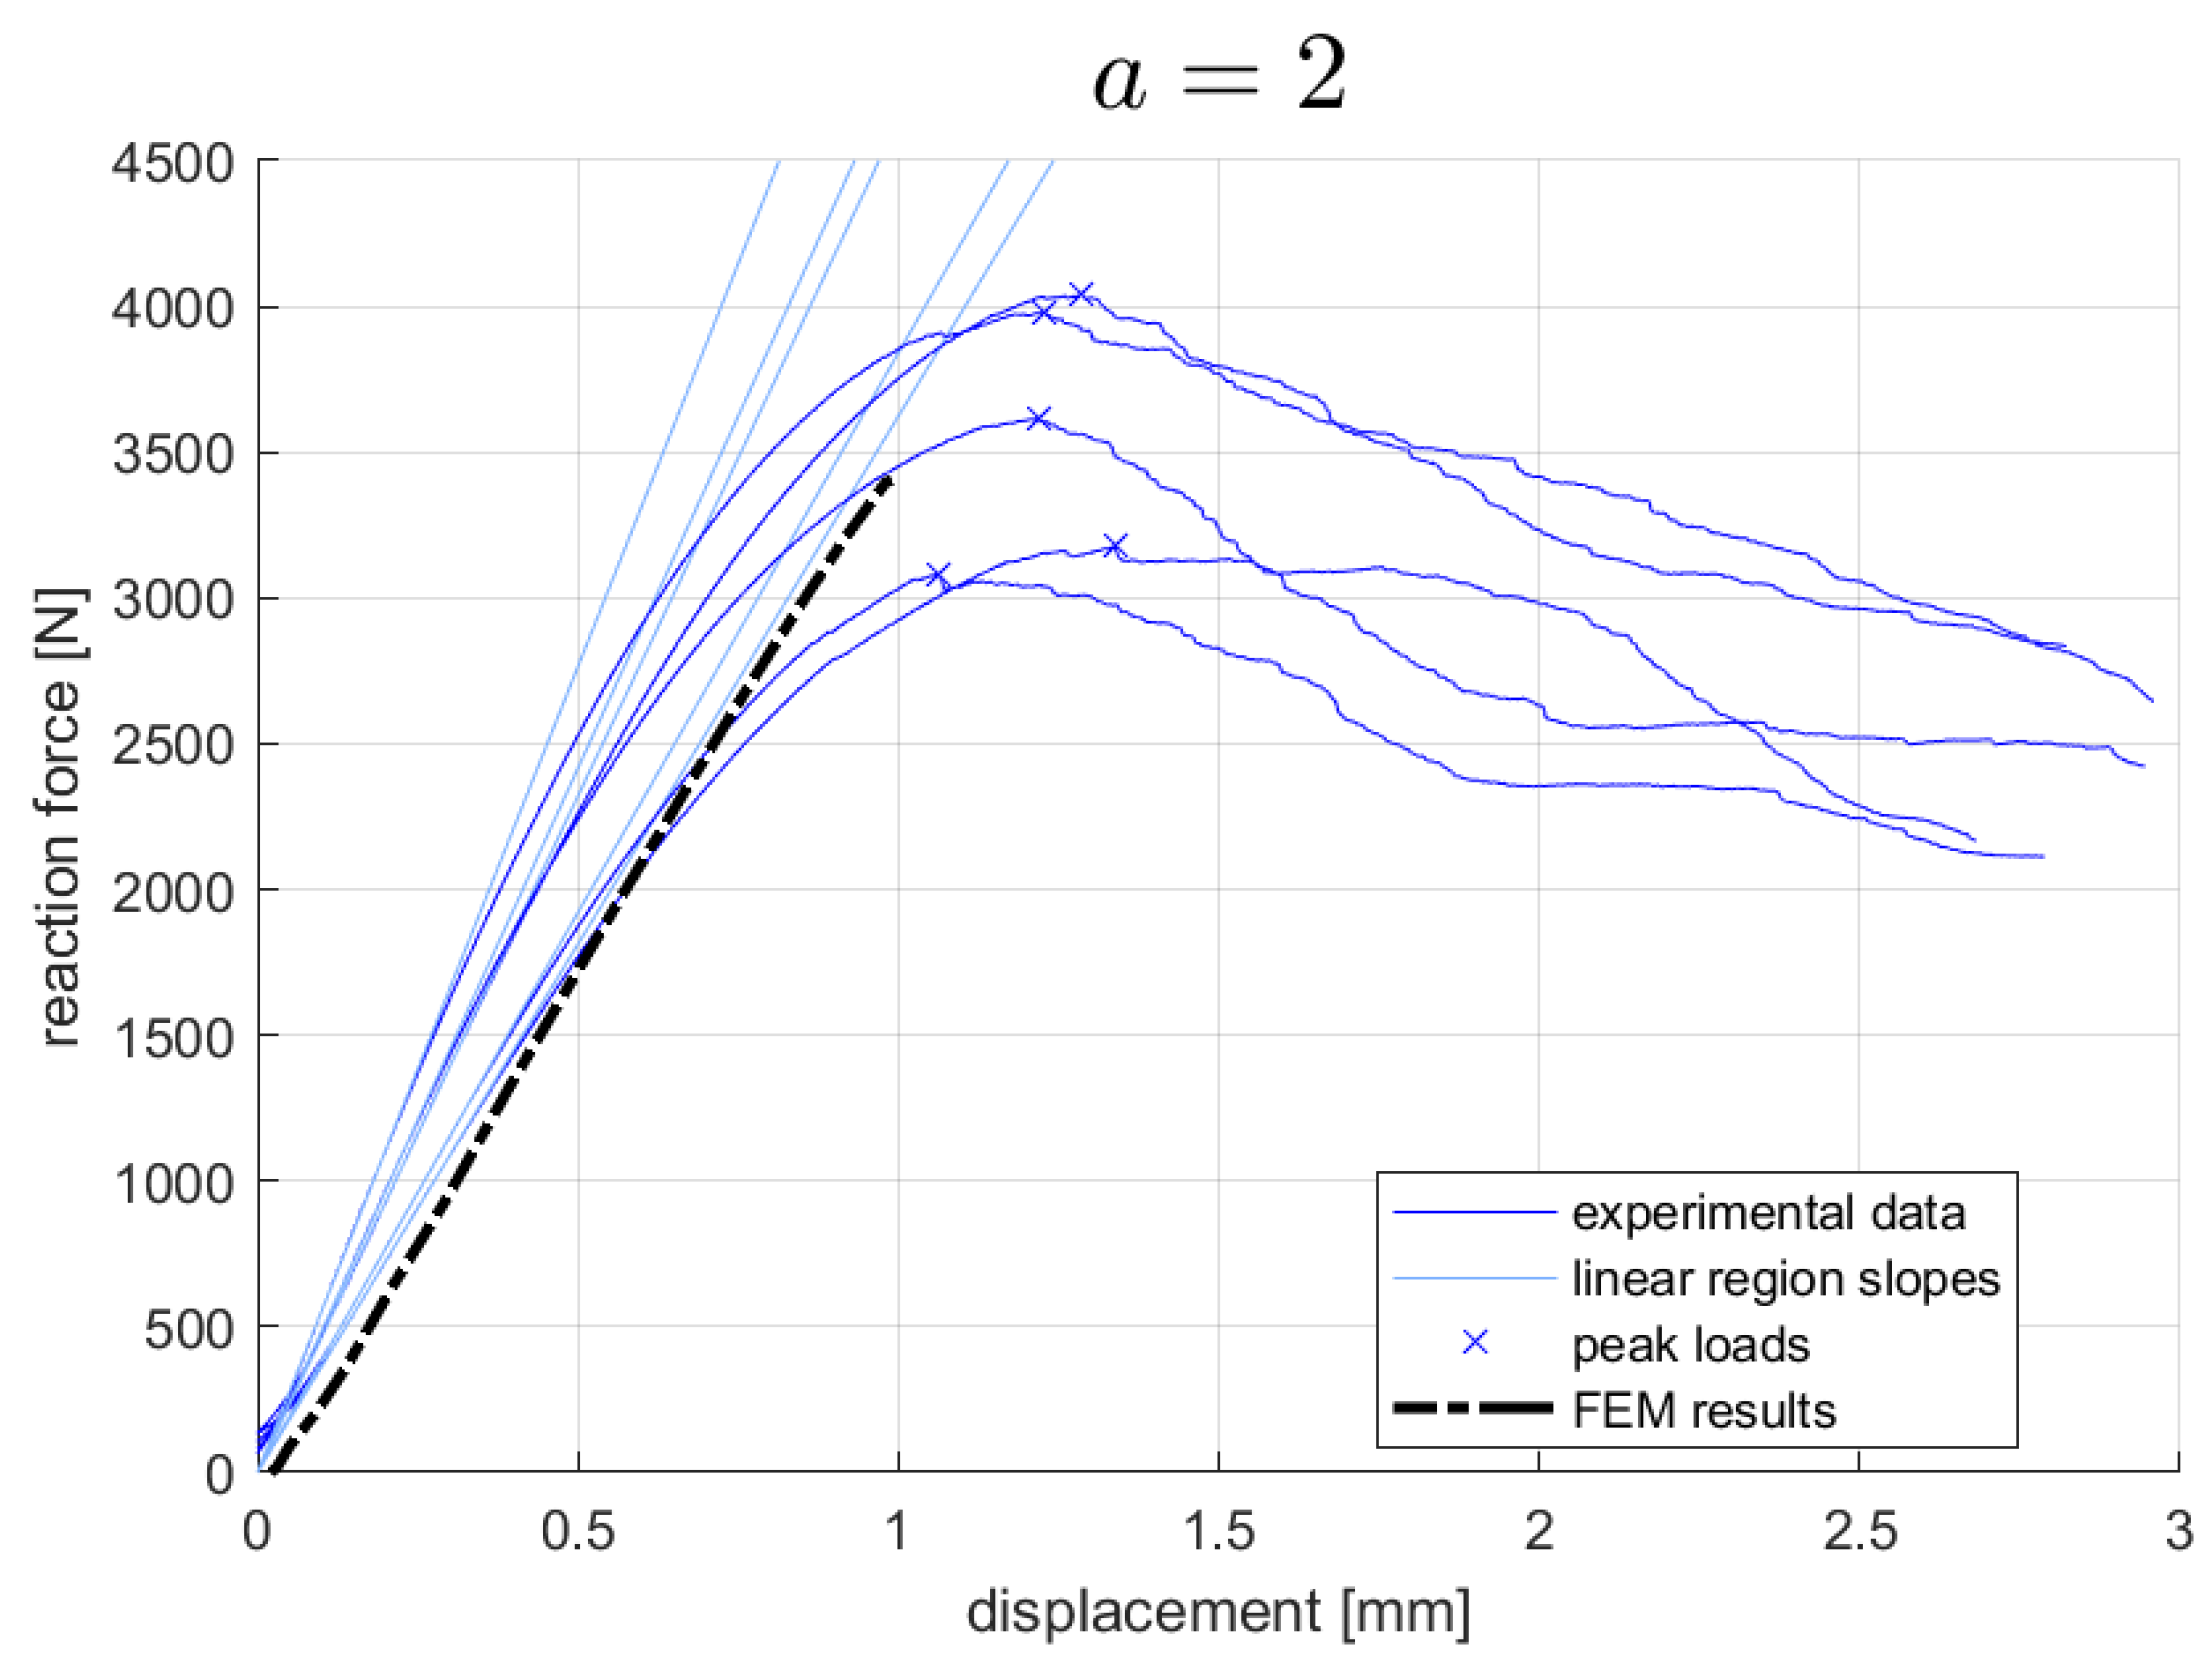
The force–displacement curves were divided by cell type and shifted along the abscissa to exclude the displacement associated with the initial settling phase (
Figure 5,
Figure 6 and
Figure 7). The experimental results were compared with the numerical results in terms of the force–displacement curve and equivalent Young’s modulus (
Table 1).
The numerical model successfully reproduced the experimental behavior in the linear elastic region for all three morphologies. This confirms that the FEM approach is capable of accurately capturing the initial mechanical response of parametrized gyroid structures.
The experimental data revealed clear trends of how cell parameters influence the metamaterial properties (
Figure 8): as the
a parameter increase, both the equivalent Young’s modulus and the maximum compressive strength also increase. The isotropic cell with
exhibited the highest strain tolerance before failure, while the anisotropic cells with
showed higher stiffness but lower strain capacity.
4. Discussion
The experimental and numerical results indicate that varying the gyroid’s geometric parameters can significantly alter its mechanical properties. Specifically, the increase in the a parameter led to higher stiffness and compressive strength but reduced strain tolerance. These findings are consistent with prior studies on cellular metamaterials, which highlight the trade-off between stiffness and flexibility in TPMS structures.
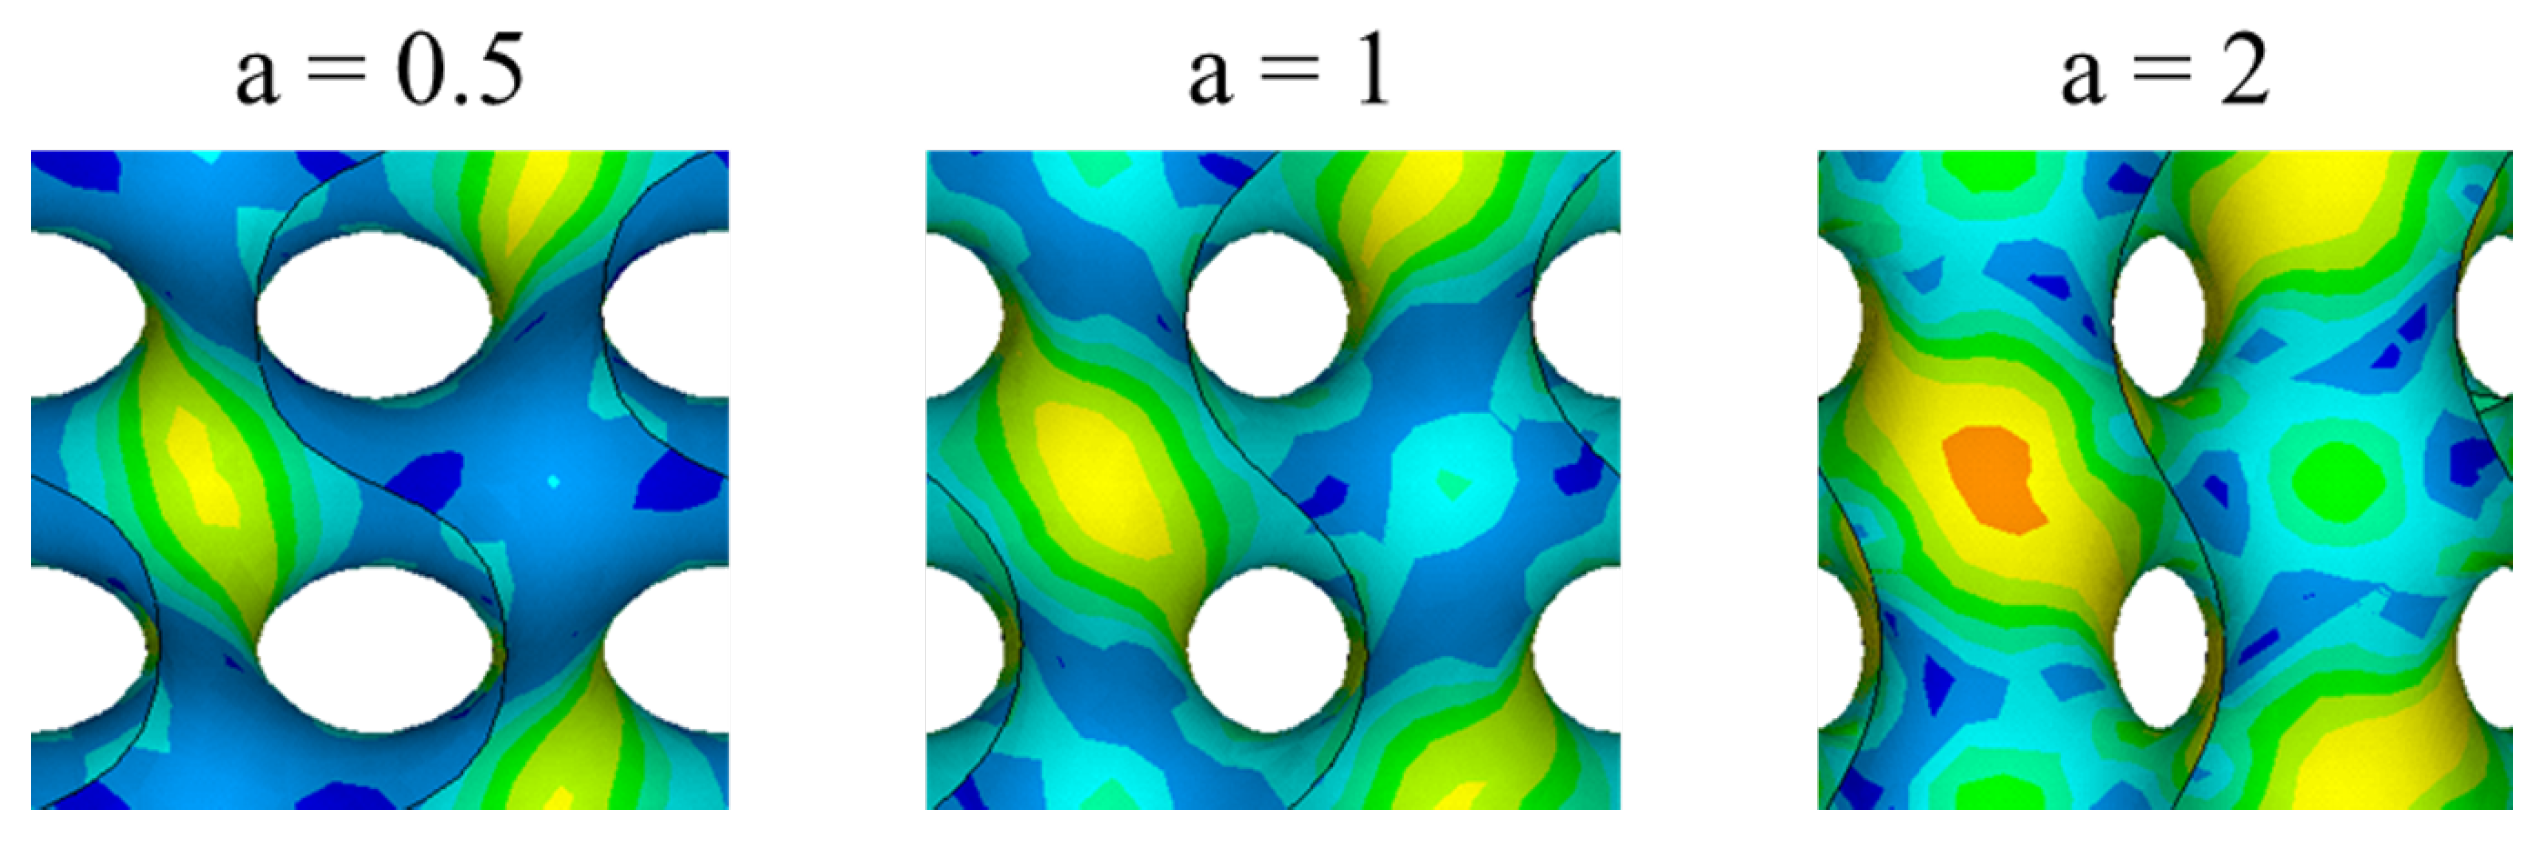
The FEM model provided valuable insights into the internal stress distribution within the gyroid structures (
Figure 9). The increased stress homogeneity observed in the anisotropic morphologies (with higher
a values) supports the hypothesis that a larger portion of the material is engaged in resisting mechanical loads. This enhanced load-sharing capacity likely contributes to the observed increase in stiffness.
Furthermore, the lower stress peaks in the isotropic cell () correlates with its higher deformation capacity, as stress concentrations are known to initiate local failure in 3D-printed metamaterials.
The significant variability in the peak load achieved by specimens with identical morphology, relative to their absolute values, may be attributed to the influence that the process of 3D printing, the cleaning of excess resin and printing supports, and UV/thermal curing exerts on surface roughness, the faithful reproduction of the original shape, the introduction of imperfections, and ultimately on the mechanical properties of the printed samples.
The potential to fine-tune the mechanical properties of gyroid structures by manipulating their geometric parameters offers exciting possibilities for designing materials with tailored mechanical responses.
5. Conclusions
This study demonstrates the feasibility of using FEM models to predict the mechanical behavior of gyroid-based metamaterials under compressive loading. The experimental results validate the FEM simulations, particularly in the linear elastic region, highlighting the potential for computational models to guide the design of TPMS-based structures. The influence of geometric parameters on the equivalent Young’s modulus and compressive strength provides valuable insights into the tunability of gyroid structures for specific applications.
Future work will expand the investigation to other TPMS geometries, different loading conditions (e.g., tensile and dynamic testing), and the use of alternative resin materials. The ultimate goal is to create a comprehensive database that maps the mechanical properties of various TPMS morphologies to their geometric parameters, enabling the development of optimized metamaterials for diverse applications, including sacrificial limiters in plasma-facing components of Tokamak reactors.
Author Contributions
Conceptualization, A.C. and P.F.; methodology, A.C.; software, A.C.; validation, A.C. and G.R.; formal analysis, A.C.; investigation, A.C. and G.R; resources, A.C., G.R. and P.F.; data curation, A.C.; writing—original draft preparation, A.C.; writing—review and editing, A.C., G.R. and P.F.; visualization, A.C.; supervision, A.C., G.R. and P.F.; project administration, A.C. and P.F.; funding acquisition, P.F. All authors have read and agreed to the published version of the manuscript.
Funding
This research received no external funding.
Institutional Review Board Statement
Not applicable.
Informed Consent Statement
Not applicable.
Data Availability Statement
The data presented in this study are available on request from the corresponding author.
Conflicts of Interest
The authors declare no conflicts of interest.
References
- Kurup, M.; Pitchaimani, J. Aeroelastic flutter of triply periodic minimal surface (TPMS) beams. Compos. Part C Open Access 2023, 10, 100349. [Google Scholar] [CrossRef]
- Cao, E.; Dong, Z.; Zhang, X.; Zhao, Z.; Zhao, X.; Huang, H. Mechanical properties and failure analysis of 3D-printing micron-scale ceramic-based triply periodic minimal surface scaffolds under quasi-static-compression and low-speed impact loads. Compos. Sci. Technol. 2023, 243, 110248. [Google Scholar] [CrossRef]
- Chen, W.; Tang, X.; Chu, X.; Yang, Y.; Xu, W.; Fu, D.; Li, X.; Zhou, W. Impact of catalyst carrier with TPMS structures on hydrogen production by methanol reforming. Int. J. Hydrogen Energy 2024, 58, 1177–1189. [Google Scholar] [CrossRef]
- Shevchenko, V.Y.; Sychev, M.M.; Lapshin, A.E.; Lebedev, L.A. Ceramic Materials with the Triply Periodic Minimal Surface for Constructions Functioning under Conditions of Extreme Loads. Glass Phys. Chem. 2017, 43, 605–607. [Google Scholar] [CrossRef]
- Paoletti, D.; Fanelli, P.; De Luca, R.; Stefanini, C.; Vivio, F.; Belardi, V.G.; Trupiano, S.; Calabrò, G.; You, J.H.; Neu, R. Thermomechanical Analysis of a PFC Integrating W Lattice Armour in Response to Different Plasma Scenarios Predicted in the EU-DEMO Tokamak. J. Nucl. Eng. 2022, 4, 421–434. [Google Scholar] [CrossRef]
- De Luca, R.; Fanelli, P.; Paoletti, D.; Stefanini, C.; von Müller, A.; Feichtmayer, A.; Vivio, F.; Belardi, V.G.; Dose, G.; De Sano, G.; et al. Pre-conceptual design of a PFC equipped with a W lattice armour for first wall limiters in the EU-DEMO fusion reactor. Fusion Eng. Des. 2023, 191, 113742. [Google Scholar] [CrossRef]
- Stefanini, C.; Fanelli, P.; De Luca, R.; Paoletti, D.; Vivio, F.; Belardi, V.G.; Trupiano, S.; Calabrò, G.; You, J.H.; Neu, R. Parametric FE model for the thermal and hydraulic optimization of a Plasma Facing Component equipped with sacrificial lattice armours for First Wall limiter application in EU-DEMO fusion reactor. Fusion Eng. Des. 2023, 192, 113604. [Google Scholar] [CrossRef]
| Disclaimer/Publisher’s Note: The statements, opinions and data contained in all publications are solely those of the individual author(s) and contributor(s) and not of MDPI and/or the editor(s). MDPI and/or the editor(s) disclaim responsibility for any injury to people or property resulting from any ideas, methods, instructions or products referred to in the content. |
© 2025 by the authors. Licensee MDPI, Basel, Switzerland. This article is an open access article distributed under the terms and conditions of the Creative Commons Attribution (CC BY) license (https://creativecommons.org/licenses/by/4.0/).


