1. Introduction
Quality means the degree to which something is good or bad, the quality, level, or degree of something [
1]. Quality can also be interpreted as a characteristic that a product or service must have. Nowadays, quality has become one of the determining factors for consumers when choosing products and services [
2]. With the development of palm oil mills today, the competition between mills has become more intense [
3]. This causes mills to try to maximize the quality of the CPO produced. The quality of palm oil can be determined from several factors such as FFAs, moisture content, impurities, and losses. PT. XYZ has its own CPO standard, which is displayed in
Table 1.
One of the most crucial chemical laboratory test techniques used in the food industry to assess food quality and resistance to potential spoiling is moisture content. Substances that do not dissolve in oil are called dirt [
4]. The failure or loss of the quantity of oil that ought to have been recovered as a result of a process is known as oil loss [
5]. When fats hydrolyze, acids known as fatty acids are released.
A frequent issue in CPO mills is the deterioration of CPO quality brought on by a rise in the quantity of FFAs. Excessive amounts of FFAs cause the oil to alter in color and taste; and become rancid [
6]. The amount of FFAs in palm oil indicates its quality. The content of desirable FFAs derived from palm oil is low [
7]. PT. XYZ has set the FFA level at 3.50%. In order to achieve the desired oil quality, businesses typically deal with oil conditions that have large quantities of FFA, which means that the fruit selection procedure is more stringent. For palm oil to maintain its worth and price, its quality is crucial.
A rise in FFA levels leads to a decline in CPO quality, which is a common issue in CPO mills. One of the key elements in assessing CPO quality and protecting it from contaminants that could lower the quality of palm oil is how it is stored. In order to ascertain the causes of the rise in FFA levels in CPO and the quality characteristics present in CPO at PT. XYZ, an analysis was conducted. Investigations were conducted into the FFA content of the yield quality metrics for CPO and FFBs.
2. Research Methods
2.1. Crude Palm Oil
Crude palm oil (CPO) is crude oil that still has juice and contaminants, such as undesirable odors and impurities [
8]. One of the vegetable oil varieties with a wide range of applications is palm oil. The mesocarp of oil palm fruits is frequently used to extract palm oil, which is then separated and purified. Because it is inexpensive, readily available, and has high oxidative stability, palm oil is utilized extensively. In addition to being a common dietary ingredient, palm oil can also be included in cosmetics [
9].
2.2. Failure Mode and Effect Analysis Assessment
By examining the cause-and-effect correlations of defects and identifying solutions with the right actions, FMEA is a useful analysis technique that businesses use to avoid and remove flaws that arise. FMEA is carried out to assist with risk assessment studies and potential hazard identification [
10].
By assessing severity (effect), occurrence (probability of errors occurring), and detection (the degree to which it can be detected), the degree of risk is assessed using FMEA. Respondents are given a questionnaire to complete in order to gather data. The severity, occurrence, and detection numbers are multiplied using(RPN = S × O × D) to determine the Risk Priority Number [
11].
Severity
Severity is measured 1 to 10 (the severity increases with the severity number).
Table 2 is the severity assessment table.
Occurence
Occurrence is measured on a scale of 1 to 10 (the likelihood of process failure increases with the number of occurrences).
Table 3 is the assessment table.
Detection
Detection is measured on a scale of 1 to 10 (the higher the detection number, the less reliable the process failure detection).
Table 4 is the detection assessment table [
12].
2.3. Fishbone Diagram
A graphical technique for depicting a phenomenon’s cause and consequences is the fishbone diagram [
13]. An analytical tool that offers a methodical approach to examining impacts and the factors that contribute to or affect them is a fishbone diagram. Because of its characteristics, a fishbone diagram is often known as a cause-effect diagram [
14].
Liliana (2016) [
15], summarizes four steps when using a fishbone diagram.
Identify the problem
The first step in solving a problem is to observe, understand, and identify the cause of the problem to be solved. This phase is crucial in the problem-solving process as an effective solution cannot be found without clear knowledge of the problem.
Determine the important elements at play
In order to concentrate on the crucial elements that need attention, the goal of this stage is to comprehend the main components contributing to the issue. This is essential for finding an appropriate and effective solution.
Identify the possible causes
Determine and examine the problem’s potential causes. The purpose of this step is to understand why the problem is occurring and to ensure that the chosen solution adequately addresses the cause of the problem and not just the symptoms.
Analyze the diagram
Analyze charts to understand information and patterns that are visually displayed. The goal is to identify hidden relationships, patterns, and trends so that you can gain relevant insights for decision-making and problem-solving [
16].
3. Result and Discussion
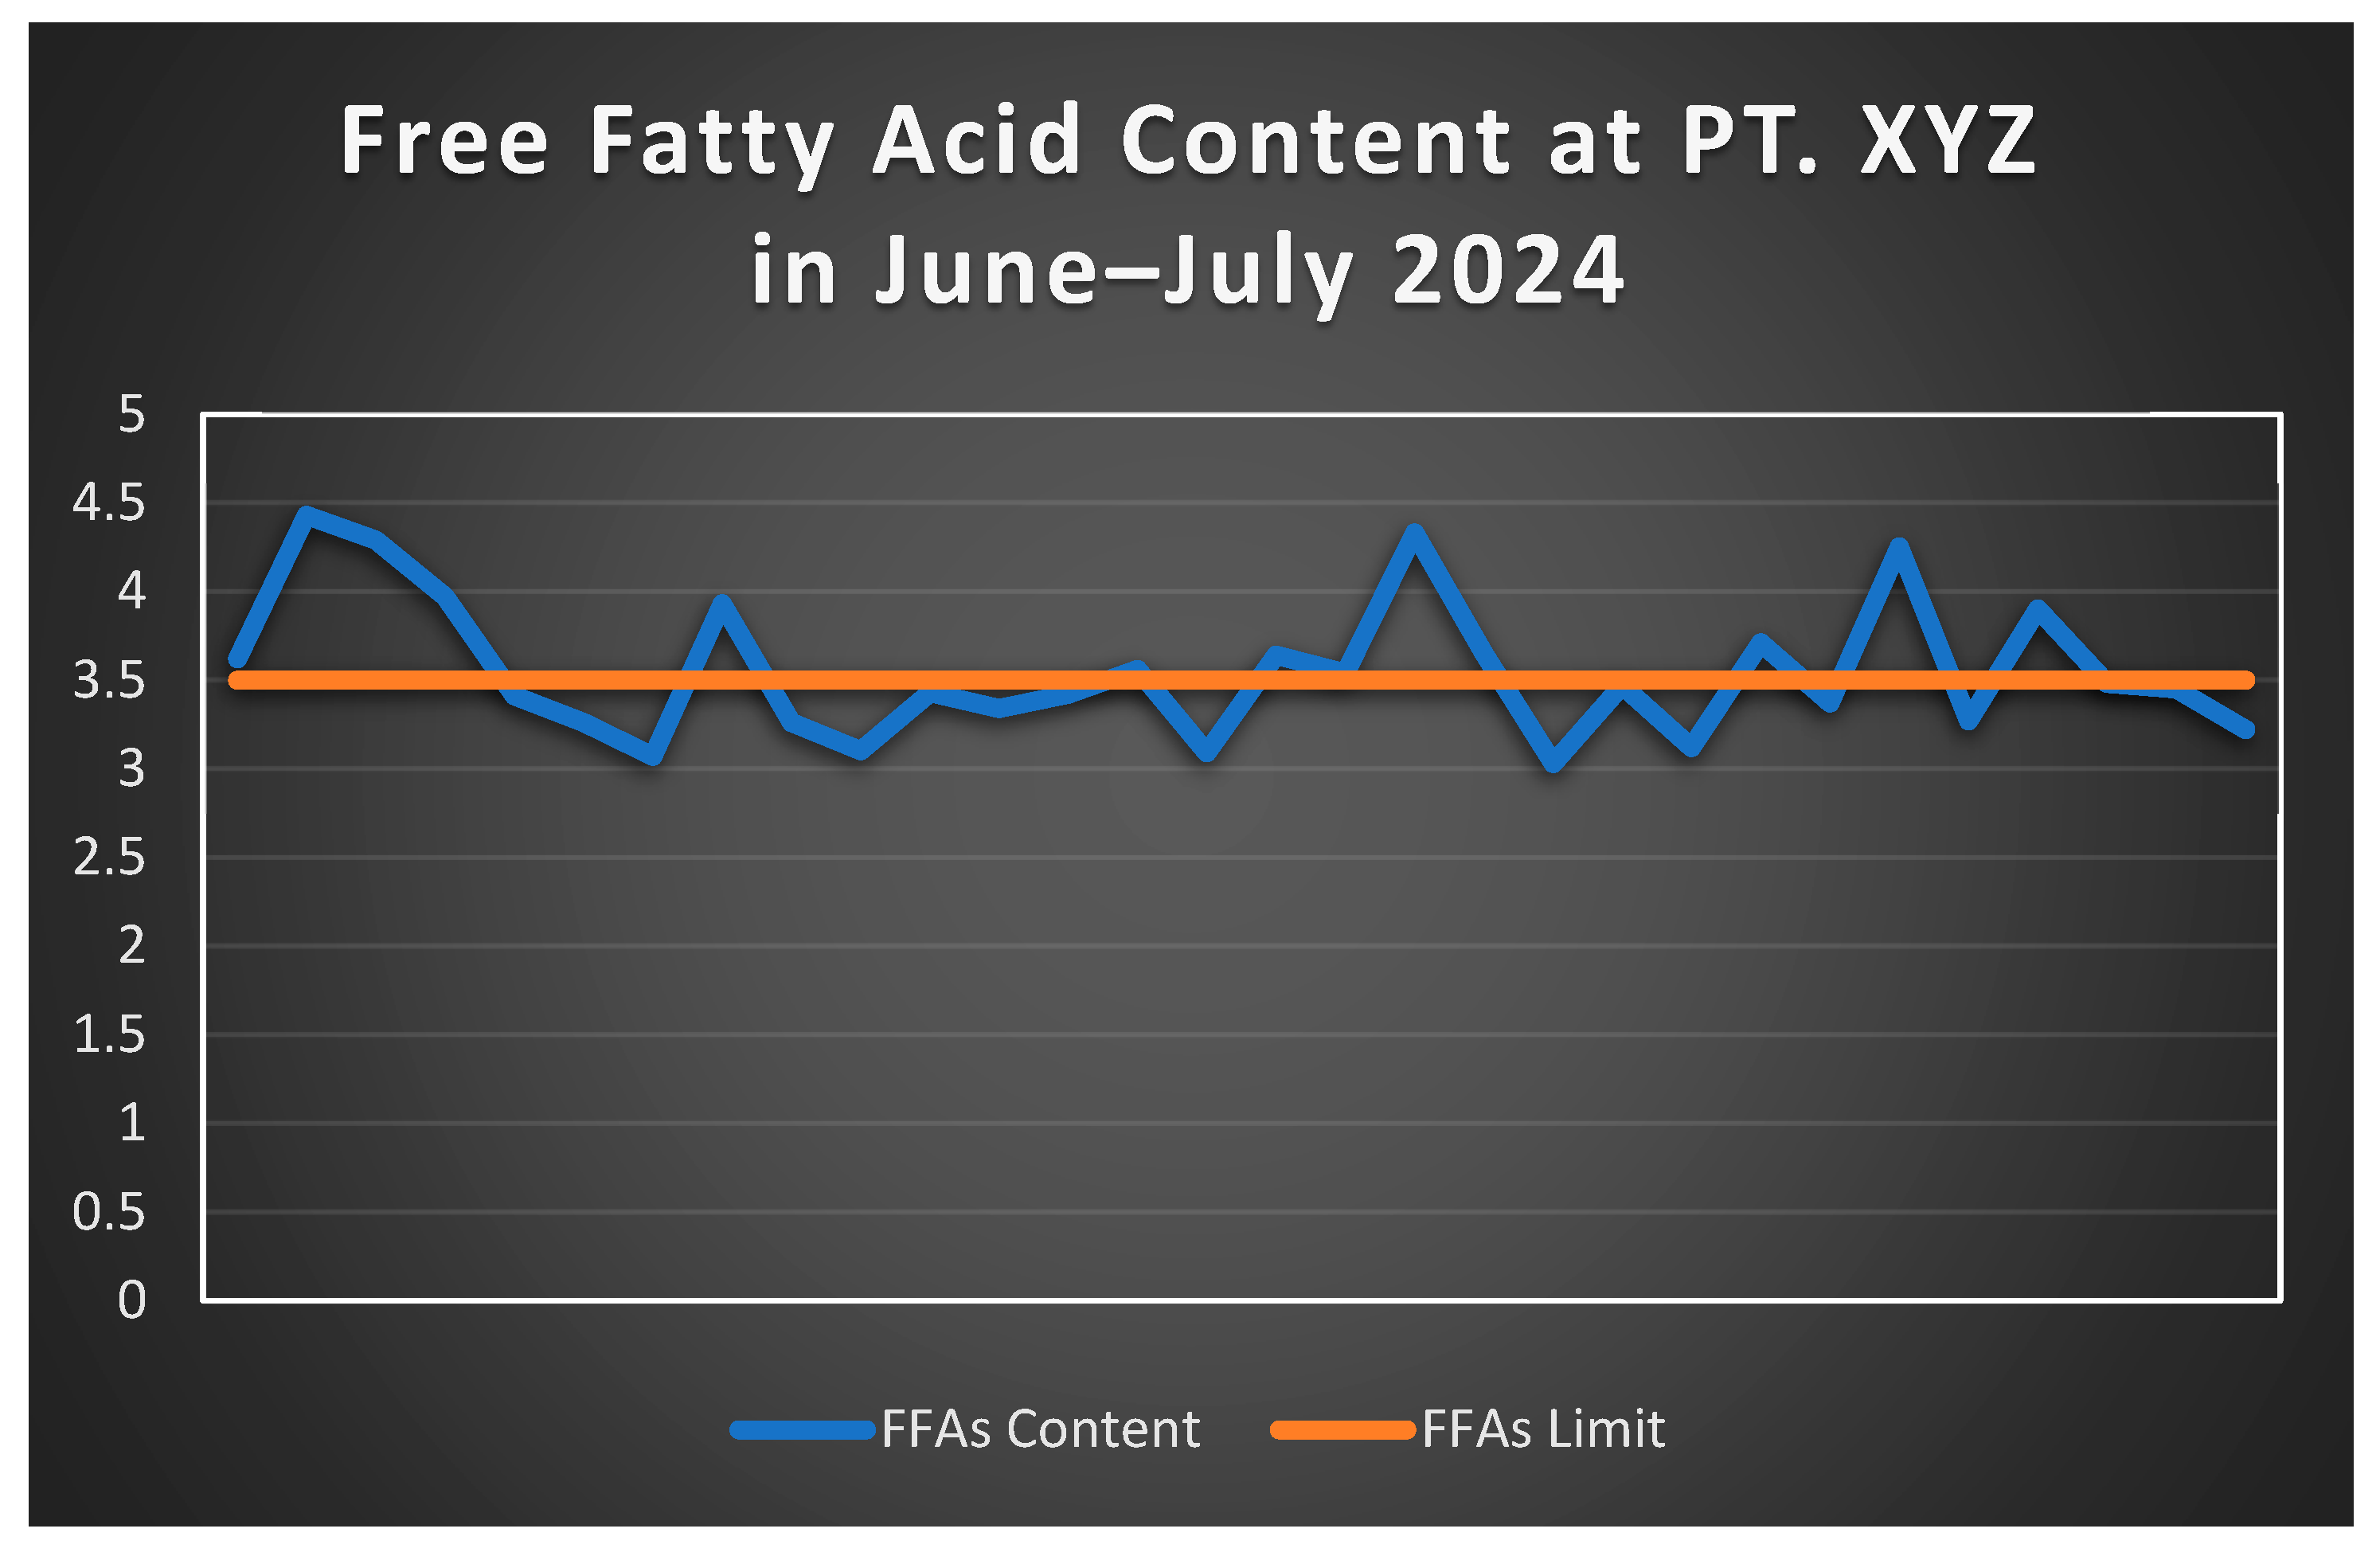
For palm oil to maintain its worth and price, its quality is crucial. One way to assess if CPO is of high quality is to look at the test results of its FFA content. The following
Table 5 displays the findings from a month’s worth of FFA testing conducted from 23 June to 22 July 2024.
The FFA content data in the table were entered into a graph to see on what date the data are still in accordance with the standard or have exceeded the standard limit. The graph of FFA and water content at PT. XYZ can be seen in
Figure 1.
Based on the graph above, by applying the existing standards where the lower limit is 0% and the upper limit is 3.50%, there are still data that do not meet the standards, so they are outside the control limits (out of control). The increase in FFA levels in CPO can be caused by several factors, including raw materials or FFBs experiencing damage before processing such as maturity not according to fractions and overnight storage in the loading ramp area, then water content and lipase enzyme activity, and CPO in storage having precipitated, meaning that it thickens and cools.
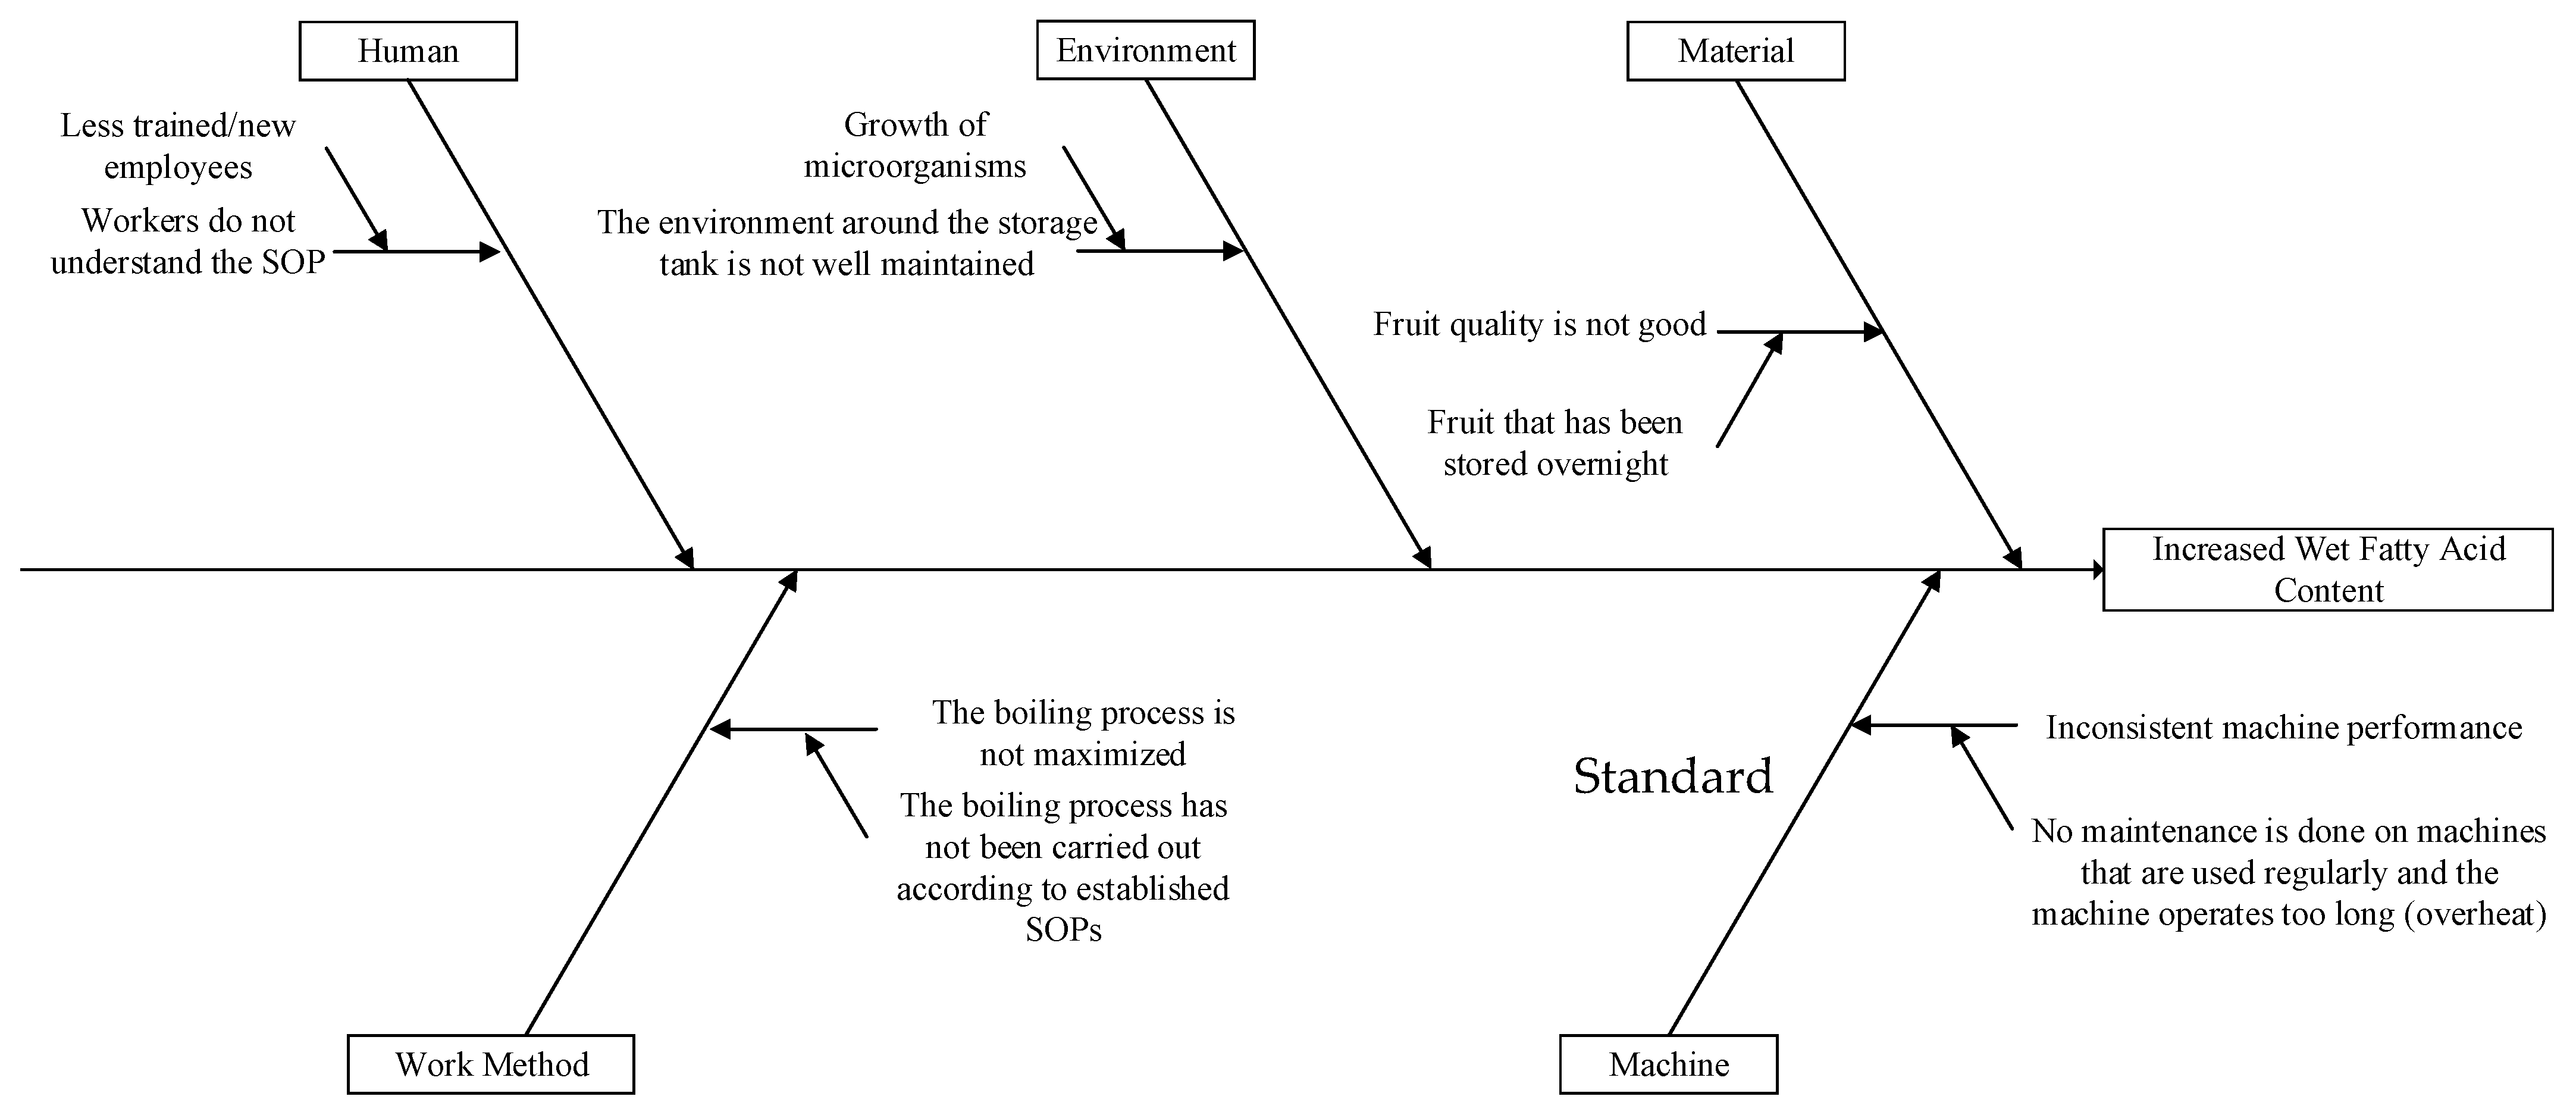
3.1. Fishbone Diagram
The method used is a cause-effect diagram to analyze which factors cause the increase in FFA levels in CPO. The factors causing the increase in FFA are as follows:
Human
At PT. XYZ, humans are a very important factor because some production activities are still carried out manually with human labor. In particular, employees who are less experienced are less skilled and do not understand the existing procedures, which impacts the quality of FFBs for the resulting CPO.
Environmental
The environment is a factor that affects the quality of fresh fruit bunches. A poorly maintained environment is a potential breeding ground for microorganisms that contaminate the fresh fruit bunches, leading to increased FFA levels in the oil.
Material
The cause of the increase in FFAs is fresh fruit bunches that are left overnight at the loading ramp, meaning that their quality decreases. In addition, fresh fruit bunches that are not at the appropriate ripeness fraction are caused by poor sorting, resulting in unripe and overripe FFBs that increase the amount of FFAs in the fresh fruit bunches.
Work Method
The factor causing the increase in FFAs in CPO is the work method in the production process, especially at the boiling station. Boiling that is not maximized causes high levels of FFAs, and water and heat content are important factors in boiling. Boiling that is not according to standards, for example too long, is also the cause of high FFA levels. In the work method, the quality of CPO produced is influenced by how the raw material enters, the production process, and oil storage.
Machine
Another factor is the machinery used in the production process. Lack of maintenance of the machines used and that have been operating for a long period of time (overheating) can make the machine experience a decrease in performance and productivity.
The diagram of the cause and effect of increasing FFA levels in CPO can be seen in
Figure 2.
Based on the causal diagram, the factors that cause the increase in FFA levels in oil come from human factors, the environment, raw materials, methods, and machines. Therefore the proposed improvements needed to lessen the high levels of FFAs are as follows
Human
The expertise and understanding of employees, operators, and other workers at PT. XYZ can be improved by holding certified training or training for employees and conducting performance-related evaluations every month, with assertiveness in understanding the applicable procedures or SOPs.
Environmental
A well-maintained and clean environment is required, especially at the oil storage tank station so that FFBs remain in good condition and are not contaminated with bacteria before distribution. Environmental cleanliness can be chieved by cleaning every time before starting production and also after finishing production.
Material
The FFBs that are sorted must be in accordance with the maturity level or fraction that has been determineds and sanctions are also placed if the FFBs sent do not meet the predetermined standards. Then, to maintain the quality of raw materials after FFBs arrives at the mill, they must be processed immediately to prevent damage and mechanical injuries to the fruit and loose fruits.
Method
The work method carried out during the entry of FFBs must be scheduled so that there is no hoarding of FFBs at the loading ramp so that they can be processed immediately. In the production process, especially boiling, the SOP must be applied with a maximum boiling time of 75 min. In addition, it is also necessary to focus on the temperature and water content during the boiling process so that the level of FFAs does not increase.
Machine
Every machine used on the production floor should undergo routine maintenance so that it does not interfere with the production process, while also maintaining machine productivity and gradually replacinge old machine spare parts with new machine spare parts. In storage, it is necessary to pay attention to the temperature so that the CPO does not thicken and cool before being tested and distributed.
3.2. Failure Mode and Effect Analysis
The RPN value is calculated at the start of the data processing stage. By determining the RPN value of each work accident risk, data processing is performed to evaluate the degree of risk of work accidents using the FMEA approach. The S (severity), O (occurence), and D (detection) numbers are multiplied to obtain the RPN value.
Based on the increased levels of FFAs in the largest CPO that has been analyzed, the effects that can be caused can be seen in
Table 6.
Based on the assessment criteria with FMEA by providing severity, occurence, detection, and RPN values based on interviews conducted with laboratory assistants and processing assistants and with analysis based on the reasons for scoring, the result is displayed in
Table 7 below.
4. Conclusions
Based on the RPN assessment above, the cause of failure that increase FFA levels in CPO at PT. XYZ are influenced by several factors, namely humans, the environment, raw materials, work methods, and machines during the production process, where the results of the RPN calculation for each factor are 80, 112, 192, 96, and 140. From the results of the RPN assessment, it can be seen that the highest RPN assessment is for raw materials, namely 192.
In this way, it is necessary to improve the raw materials used to make CPO. The main issue is that the raw materials used are left overnight, which causes a decrease in the quality of the CPO itself. The proposal that can be given is to supervise the fresh fruit bunches during the processing process, both during inspection and during sorting at the loading ramp station, and also; by sanctioning the suppliers of PT. XYZ if the fresh fruit bunches delivered are not in accordance with the agreed standards.
Author Contributions
Conceptualization, N.P. and J.A.L.; methodology, N.P., J.A.L., N.K.S. and M.Z.F.; validation, N.P.; formal analysis N.P. and M.Z.F.; data analysis, N.P. and M.Z.F.; supervision, N.P.; writing—original draft preparation, M.Z.F.; writing—review and editing, M.Z.F. and J.A.L.; visualization, N.P.; project administration, N.P., M.Z.F., J.A.L. and N.K.S. All authors have read and agreed to the published version of the manuscript.
Funding
This research received no external funding.
Institutional Review Board Statement
Not applicable.
Informed Consent Statement
Not applicable.
Data Availability Statement
No new data were created or analyzed in this study. Data sharing is not applicable to this article.
Conflicts of Interest
The authors declare no conflict of interest.
References
- Nasution, F.P.; Nazaruddin; Nur, M.; Umam, M.I.H.; Suherman. Analisis Pengendalian Kualitas Pada Produksi Cpo Menggunakan Metode Six Sigma Dmaic. February 2025. Available online: https://ejournal.unisi.ac.id/index.php/jupel/article/view/3761/1831 (accessed on 17 June 2024).
- Marselina’, S.; Ode, S.L.; Safar, A.; Gunawan, S. Analisis Pengendalian Kualitas Crude Palm Oil (CPO) Menggunakan Metode Six Sigma (Studi Kasus PT. XYZ). JATRI-Jurnal Teknik Industri 2025, 3, 1–11. [Google Scholar]
- Harma, B.; Farid, M.; Susriyati; Miliandini, E.P. Analisis Kualitas CPO Menggunakan Seven Tools dan Kaizen. J. Teknol. 2022, 12, 14–21. [Google Scholar] [CrossRef]
- Levia, D. Analisis Proses Produksi CPO Untuk Mengidentifikasi Faktor-Faktor Yang Mempengaruhi Kualitas Mutu CPO. J. Teknol. Dan Manaj. Ind. Terapan (JTMIT) 2023, 2, 82–89. [Google Scholar] [CrossRef]
- Prayetno, D.; Sinaga, M.D.; Sari, R.E. Sistem Pendukung Keputusan Menentukan Kadar Minyak Mentah Kelapa Sawit Dengan Metode Topsis. 2018. Available online: https://www.stmikpontianak.ac.id/ojs/index.php/sensitek/article/view/247 (accessed on 17 June 2024).
- Susanti, R.; Said Ramadhan, D.; Pangestu Arwi, P.; Siregar, M. Analisis Oil Losses Pada Stasiun Perebusan Produksi Crude Palm Oil (CPO) Menggunakan Metode Statistical Process Control (SPC). J. Teknol. Manaj. Ind. Terap. (JTMIT) 2023, 2, 98–110. [Google Scholar]
- Nurfiqih, D.; Hakim, L.; Muhammad. Pengaruh Suhu, Persentase Air, Dan Lama Penyimpanan Terhadap Persentase Kenaikan Asam Lemak Bebas (ALB) Pada Crude Palm Oil (CPO). J. Teknol. Kim. Unimal 2021, 10, 1–14. [Google Scholar] [CrossRef]
- Chandrahadinata, D.; Nurdiana, W. Analisis Pengendalian Kualitas pada Crude Palm Oil untuk Meningkatkan Kualitas di PT. Condong Garut. 2021. Available online: https://jurnal.itg.ac.id/ (accessed on 17 June 2024).
- Fajar, S. Proses Pengolahan CPO (Crude Palm Oil) menjadi RBDPO (Refined Bleached and Deodorized Palm Oil) di PT XYZ Dumai. UNITEK 2019, 12, 55–64. [Google Scholar]
- Taufik, M.; Seftiono, H. Karakteristik Fisik Dan Kimia Minyak Goreng Sawit Hasil Proses Penggorengan Dengan Metode Deep-Fat Frying. J. Teknol. 2018, 10, 123–130. [Google Scholar] [CrossRef]
- Budi Puspitasari, N.; Padma Arianie, G.; Adi Wicaksono, P. Analisis Identifikasi Masalah Dengan Menggunakan Metode Failure Mode And Effect Analysis (FMEA) Dan Risk Priority Number (RPN) Pada Sub Assembly Line (Studi Kasus: Pt. Toyota Motor Manufacturing Indonesia). 2017. Available online: https://ejournal.undip.ac.id/index.php/jgti/article/view/15232 (accessed on 17 June 2024).
- Pendekatan, D. Pengendalian Kualitas Dengan Metode Failure Mode Effect And Analysis. 2019. Available online: https://sisformik.atim.ac.id/media/filejudul/423TA%20Sijia%20Afriani%20Zal%20Zadilah%20S.-dikonversi.pdf (accessed on 17 June 2024).
- Ilie, G.; Ciocoiu, C.N. Application of Fishbone Diagram to Determine the Risk of an Event with Multiple Causes Management Research Application of Fishbone Diagram to Determine the Risk of an Event with Multiple Causes. Knowl. Manag. Res. Pract. 2010, 2, 1–20. [Google Scholar]
- Panjaitan, N.; Yuman, S.A. Analysis of Work Environment at Blow Moulding Station Using 5S Method and Fishbone Diagram. J. Eng. Manag. Ind. Syst. 2023, 11, 121–133. [Google Scholar] [CrossRef]
- Liliana, L. A new model of Ishikawa diagram for quality assessment. In IOP Conference Series: Materials Science and Engineering; IOP Publishing: Bristol, UK, 2016; Volume 161, p. 012099. [Google Scholar] [CrossRef]
- Indah, D.P. Analisis Fishbone Diagram Untuk Mengevaluasi Proses Bisnis Distribusi Air Pada Pdam Studi Kasus Pada Pdam Tirta Raya Kabupaten Kubu Raya. J. Akunt. 2020, 6, 1–16. [Google Scholar] [CrossRef]
| Disclaimer/Publisher’s Note: The statements, opinions and data contained in all publications are solely those of the individual author(s) and contributor(s) and not of MDPI and/or the editor(s). MDPI and/or the editor(s) disclaim responsibility for any injury to people or property resulting from any ideas, methods, instructions or products referred to in the content. |
© 2025 by the authors. Licensee MDPI, Basel, Switzerland. This article is an open access article distributed under the terms and conditions of the Creative Commons Attribution (CC BY) license (https://creativecommons.org/licenses/by/4.0/).


