Abstract
The characteristics of rainfall in the Siwaluh river basin are poorly understood due to a lack of data. Many rainfall data are missing and many rain gauge posts are damaged. The availability of rainfall data is necessary for the planning and management of water resources. Technological advances can utilize satellite-derived rainfall products. These offer an alternative for areas where data are limited. However, the use of satellite data must be validated with field data. Statistical analyses used for calibration and validation involve linear regression. Validation with evaluation statistics measures how good the model is. The required data is rainfall for 20 years. This study evaluates data from the Climate Hazard Group InfraRed precipitation with Station Data (CHIRPS) satellite with rainfall station data. Satellite rainfall data were compared with three field rainfall stations. This coding was used for one Siwaluh watershed. The results show that the calibration of CHIPRS satellite data produced a correction factor in the form of a linear regression equation. The validation stage corrected the values of NSE = 0.8, RSR = 0.5, and KR = 3.95% and gave an interpretation of a very good value. This research shows that the CHRIPS data are consistent with the rain station data. These findings provide the potential for satellite data to be used to assist decision-making in areas where rainfall data are limited.
1. Introduction
Indonesia has two seasons: the rainy season and the dry season. The dry season causes drought, and the rainy season causes inundation and flooding [1]. Rainfall is one of the important meteorological parameters from several perspectives, such as hydrology, agriculture, and disaster prevention [2]. Rainfall data are important data for hydrological calculations in the planning of water buildings as a part of a conservation effort [3]. Flood discharge calculations in waterworks planning require complete and up-to-date rainfall data for optimal planning. Information on rainfall data is indispensable in water resources management [1,4].
However, complete and comprehensive rainfall data are still quite difficult to obtain [5,6]. Many rain data were lost and the equipment was damaged. Limited data must be modified to make it feasible to use [7,8]. Some rain station posts are located in very remote areas so they are not optimized and many areas do not have rain station posts. The level of risk for hydrological analysis is still not optimal [9]. The problems regarding rainfall stations cause the rainfall data at these stations to be unable to accurately represent the actual rainfall in field conditions [10]. Our study area is located in the Karanganyar Regency. The river passes through the Siwaluh River. The study location is in the Siwaluh basin, which has an area of 50.75 km2 and a river length of 33.3 km2. Some rain gauges are damaged, and data are lost. The data used are thus less effective. These problems can be overcome by using satellite rain data [11,12].
Some rainfall satellites that are often used as an alternative means of determining rainfall due to the availability of rain data include the CHIRPS [13], GLDAS 2.1 [14], CML [2], TRMM [15], RCM [16], JST [17], and other rainfall satellites. This research uses CHIRPS (Climate Hazard Group Infrared Precipitation with Station Data) satellite data. The reliable performance CHIRPS model has been validated. CHIRPS represents actual rainfall data and addresses the limited availability of rainfall data in basin management [18,19]. Research on the performance of the CHIRPS satellite in several regions in Indonesia and various other countries has produced quite-good values [12,20].
CHIRPS has been used to estimate rainfall data at the pixel level [4,17]. Some studies state that the CHIRPS satellite can be used as an alternative to the availability of rainfall data for water resources [4,5,21,22,23]. The larger size of the data over a wide area affects the accuracy of CHIRPS. Although many studies have been conducted with this satellite data, this study identifies the limitations of rainfall data in the Siwaluh Basin. Many rainfall stations have damaged equipment. The resulting data are incomplete. Limited data causes difficulties in hydrological analysis. Water resources management is less than optimal. Given these conditions, it is important to assess the reliability of satellite rainfall data. However, the reliability of CHIRPS in the Siwaluh Basin is still very limited. The contribution of this research is the validation of CHIRPS data with rainfall stations in the field. CHIRPS data can provide data accuracy despite the limited station data. The purpose of this research is to validate CHIRPS rainfall data with rain station post data in the Siwaluh basin. This validation is important in determining the level of accuracy of CHIRPS data and its potential use in various applications in the Siwaluh basin. High spatial and temporal differences in rainfall in Karanganyar are factors that will affect the accuracy of rainfall data. This research is expected to show that CHIRPS satellite rainfall data have a significant and reliable correlation. These data can serve as an important source of information in water resources management in areas with minimal measurements.
2. Materials and Methods
2.1. Study Area
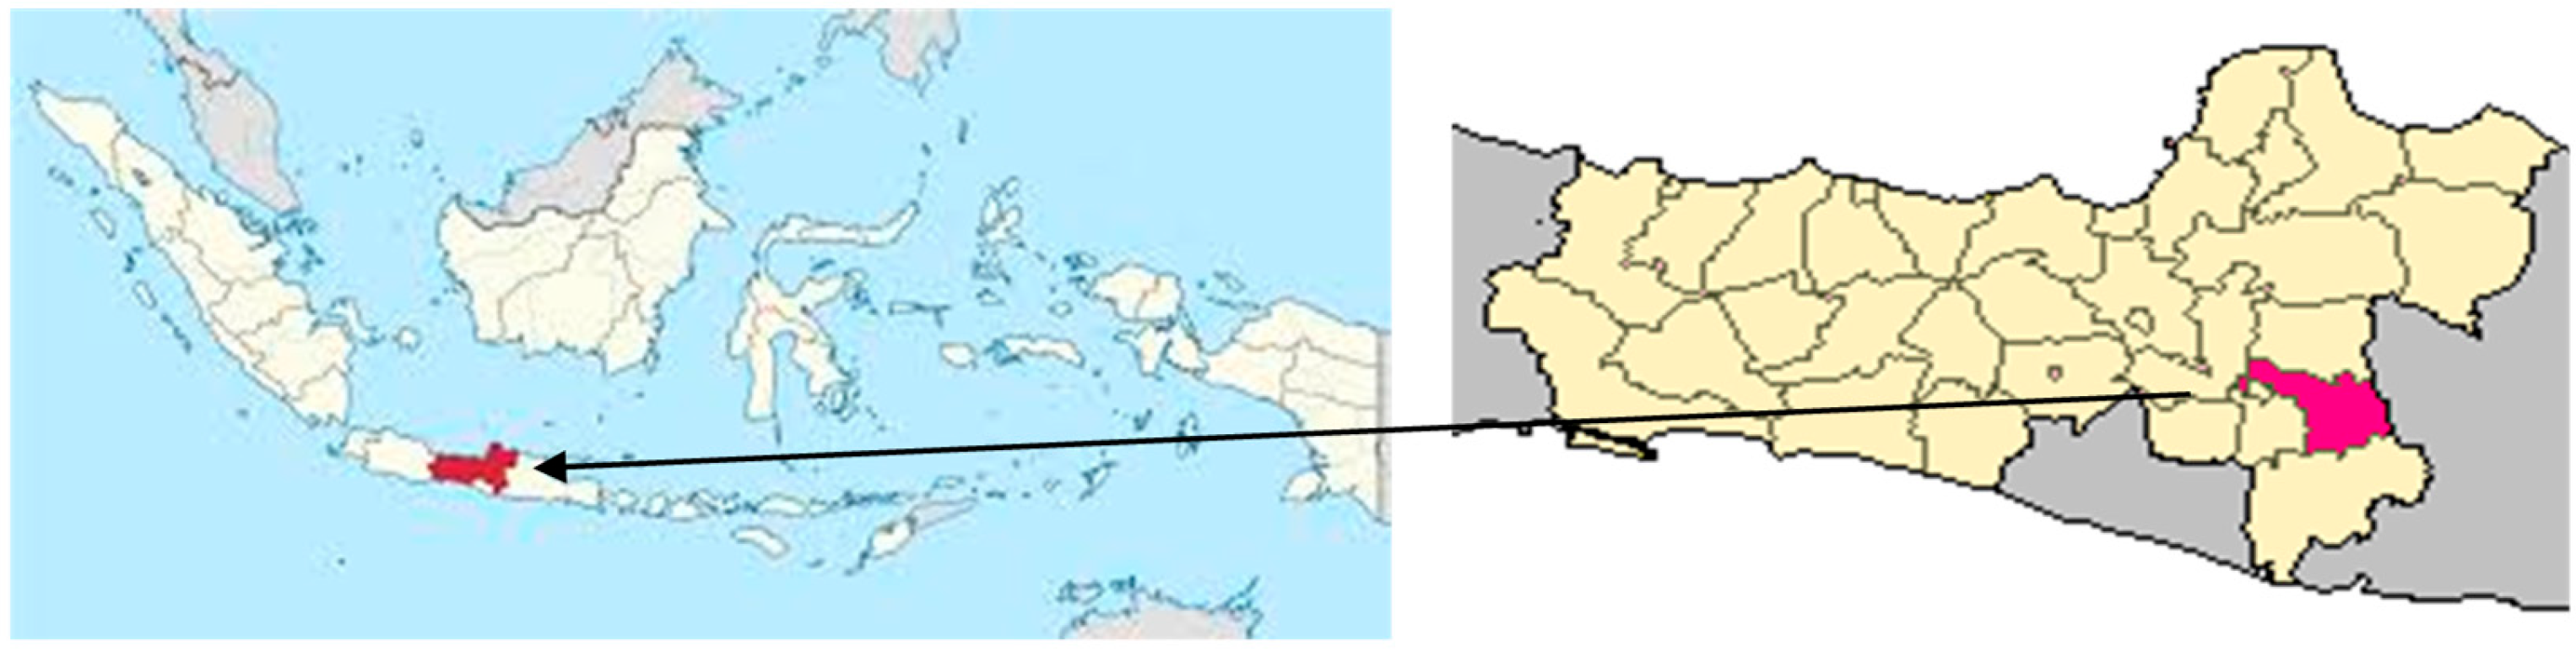
This research was conducted in Karanganyar Regency, which is located in Central Java, Indonesia. The research location can be seen in Figure 1.
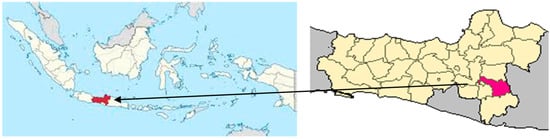
Figure 1.
Research location.
The location of this research is in Karanganyar Regency. One of the rivers that passes through is the Siwaluh River. The topography of the Siwaluh basin varies from upstream Mount Lawu and the downstream lowlands. A picture of the station location is shown in Figure 2.
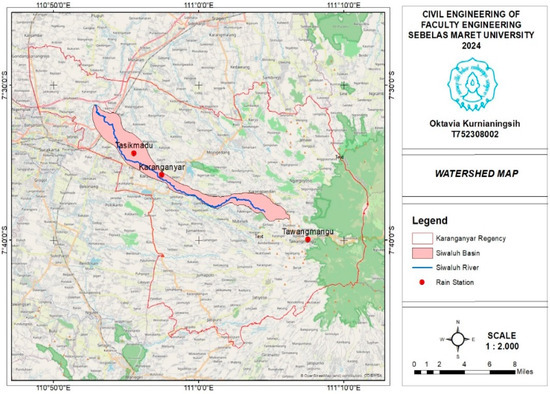
Figure 2.
Location of rainfall stations in the Siwaluh Basin.
The Siwaluh River has an area of 50.75 km2 and a river length of 33.3 km2 and empties into the Bengawan Solo River. Elevation The catchment area of the Siwaluh basin in the downstream is 500 m above sea level in the upstream is 1500 m above sea level. This difference in elevation results in variations in temperature and rainfall in the Siwaluh Basin area. The Siwaluh Basin has several soil types: latosol, regosol, andosol, and alluvial. The designation of this basin is as follows: forests (as a protected area) (40%); agriculture with various types of crops, such as rice and corn (30%); settlements in the lowlands (20%) passing through the Karanganyar sub-district, which is the economic center in Karanganyar Regency; and tourism (10%) because in the mountains, there are many tourist attractions.
The analysis method used in this study is the validation of CHIRPS satellite rainfall data via the data on 20-year rainfall stations (2004–2023). The data used from Karanganyar, Tasikmadu, and Tawangmangu rainfall stations were sorted based on data availability and distance. The data consistency test used for rainfall data comprises the double mass curve test and RAPS (rescaled adjusted partial sums), while the consistency test for CHIRPS satellite rainfall is RAPS [5]. We test the Rainfall data validation by considering the largest rainfall in one year via several stations.
This research concerns the reliability of satellite data, employing rain data on a regional basis and the observed rainfall from each rainfall station using the Thiessen polygon method. Field rainfall data and CHIRPS satellite rainfall data that have been tested for data quality and calculated regional rainfall can then be used for the next stage.
2.2. Thissen Polygon Method
The Thiessen polygon method is obtained through the creation and analysis of Arc MAP. The Thissen polygon method is used to determine rainfall stations that can represent a watershed. The coordinates of the rainfall station are entered in UTM form, as in Table 1 below.

Table 1.
Coordinates of rain stations.
This Thiessen analysis, by entering points at the train station, will be processed to obtain results from the rain station. The Thissen polygon calculation formula is as follows [24]:
where:
- A1: Area representing the observation station (km2);
- R1: Amount of rainfall for each station: 1, 2, 3 …, n (mm);
- n: Number of stations.
2.3. Calibration
Rainfall data calibration is the process of adjusting measured rainfall data to the actual conditions in the field. Calibration has the aim of increasing the accuracy of rainfall data, reducing bias and error in rainfall measurements, and improving the spatial representation of rainfall in the watershed. Rainfall data calibration methods include the correlation method, the frequency distribution method, and hydrology. This research selected the correlation method of comparing rainfall station data with CHIRPS satellite rainfall data. The selected equation is determined from the highest coefficient of determination (R2) value produced in the following equation:
where:
- R2: Coefficient of determination;
- X: Observation data;
- Y: Modeled data;
- : Average of observation data;
- : Average of modeled data;
- i: Mean of observed data;
- N: A lot of data.
From the above equation, the selected regression equation will be used in the evaluation process at the validation stage of corrected satellite rainfall data with the validation data range. The process of correcting satellite data is conducted by entering satellite rainfall data into the regression equation that was selected during the calibration stage.
2.4. Validation
Validation is a process carried out to obtain the level of uncertainty of a model in estimating or predicting a hydrological process carried out via evaluation. The validation process is carried out to determine the reliability of the CHIRPS satellite in estimating the rain that occurs via three statistical indicators, namely, Nash–Sutcliffe efficiency (NSE), RMSE–standard deviation ratio (RSR), and relative error (KR) [21].
2.4.1. Nash–Sutcliffe Efficiency (NSE)
Nash–Sutcliffe efficiency (which can be referred to as NSE) is a value that shows the accuracy of an observation value plotting result via comparisons using simulated or satellite values corresponding to the 45° line, with a range of values ∞ up to 1 [18]. The NSE value can be determined by the equation below:
where:
- X: Observation data;
- Y: Modeled data;
- i: Mean of observed data;
- N: Total data.
The criteria for the value of the Nash–Sutcliffe efficiency (NSE) parameter are shown in Table 2 below.
Table 2.
Criteria for the value of the Nash–Sutcliffe efficiency (NSE) parameter.
2.4.2. RMSE–Standard Deviation Ratio (RSR)
The RMSE–standard deviation ratio (commonly referred to as RSR) is a stage involving the standardizing of RMSE using the standard deviation of the observation data and combining error indices. Calculating the RSR value can be undertaken by using the ratio of RMSE and the standard deviation of the observation data such that the RSR value will be obtained with the provision that the smaller the RSR value, the better the performance of the simulation model. The RSR value can be determined by the equation below:
where:
- X: Observation data;
- Y: Modeled data;
- : Average of Modeled data;
- i: Mean of observed data;
- N: All data.
The value criteria of the RMSE–standard deviation ratio (RSR) parameter are shown in Table 3 below.
Table 3.
Criteria for the value of the RMSE–standard deviation ratio (RSR) parameter.
2.4.3. Relative Error (KR)
Relative error value (or KR) is a value calculated with the aim of knowing the percentage of relative error of modeled satellite rain data. The relative error can be known by comparing it with existing observation data. The relative error value (KR) can be determined by the equation below:
where:
- X: Observation data;
- Y: Modeled data;
- i: Mean of observed data;
- N: All data.
3. Results and Discussion
3.1. Regional Rainfall
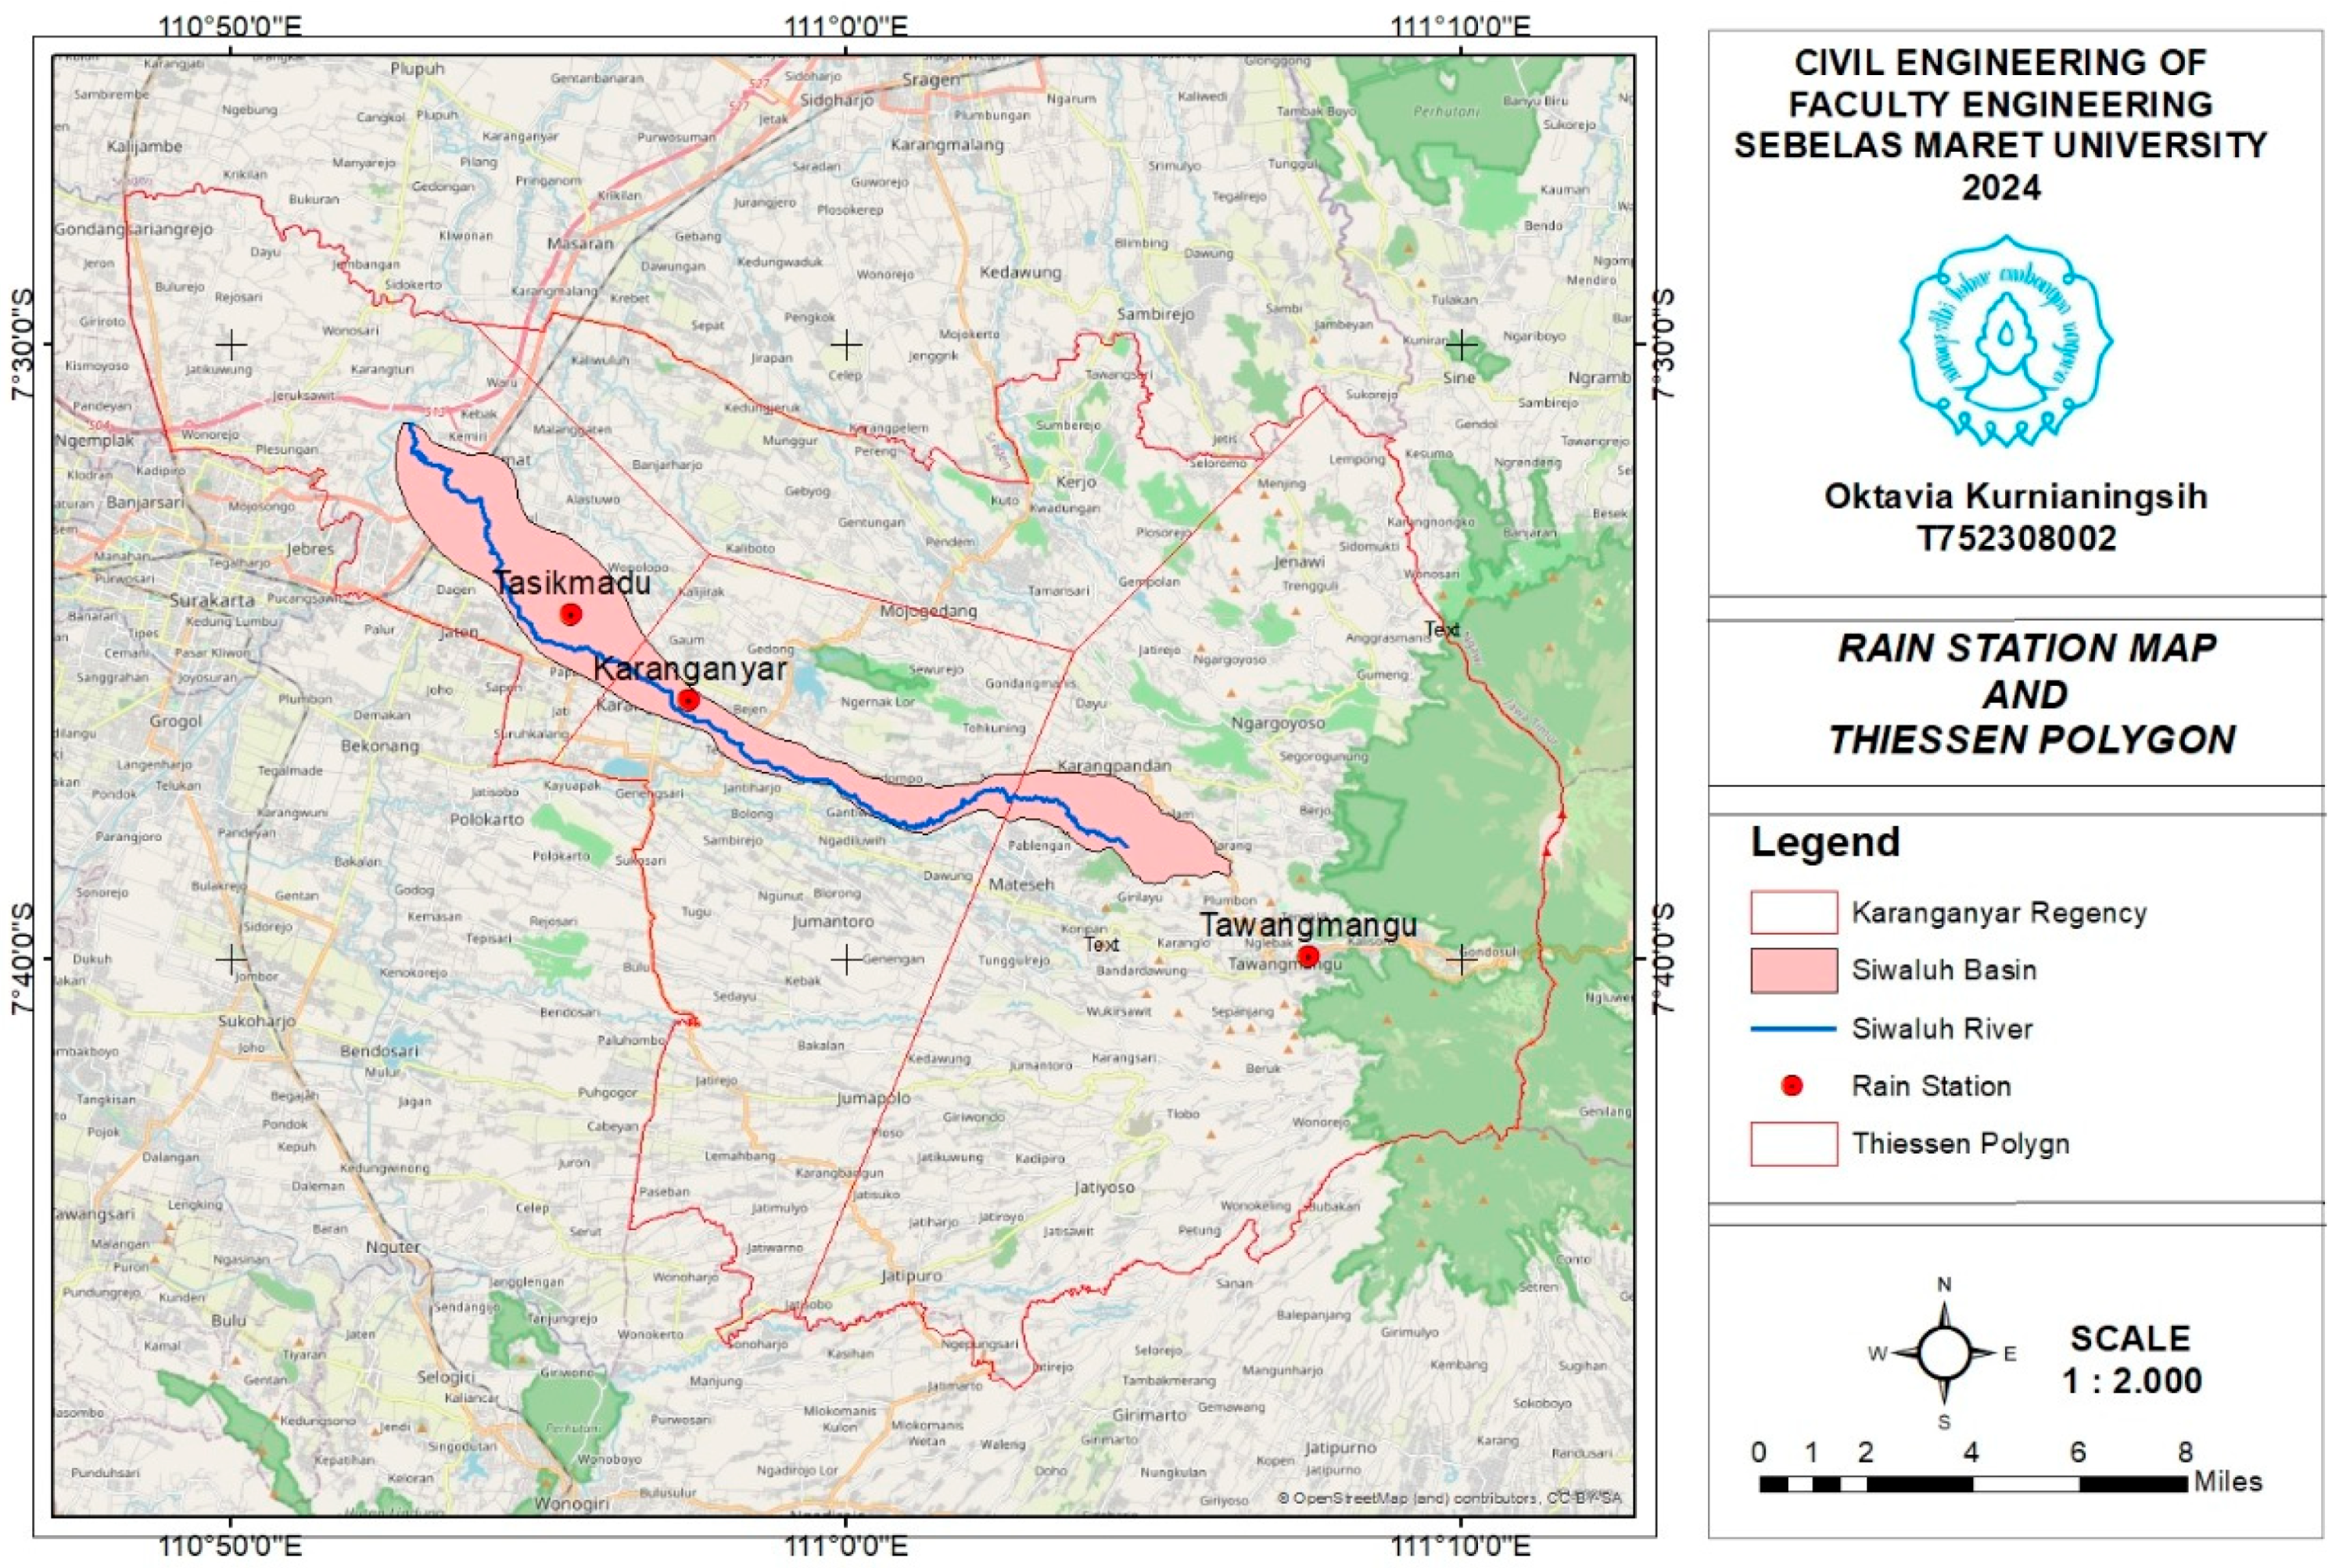
The rainfall data used for calculations using the Thiessen polygon method are the regional rainfall data obtained from the Siwaluh Watershed, Karanganyar Regency, Central Java. Calculations using the Thiessen polygon method are carried out by calculating the weight of each area that represents a rain station. The application of the Thiessen polygon method to the Siwaluh basin, Karanganyar Regency, Central Java, is shown in Figure 3 below.

Figure 3.
Thiessen polygon of Siwaluh basin, Karanganyar Regency, Central Java.
After drawing the Thiessen polygon of the Siwaluh basin, Karanganyar Regency, Central Java, the next step is to calculate the influence factor (Kr) of each rainfall station and its area of influence. The results of the calculation can be seen in Table 4 below.
Table 4.
Rain station post influence area factor value (Kr).
3.2. Validation of Uncorrected Satellite Rainfall Data
In this study, the validation of the uncorrected satellite rainfall data is carried out to determine the accuracy of the CHIRPS satellite before it is corrected, which will be used to estimate the rainfall that occurs on the Earth’s surface. At this stage, the Nash–Sutcliffe efficiency (NSE), RMSE–standard deviation ratio (RSR), and relative error (KR) values are necessary, using the rainfall station data for a period of 20 years (2004–2023). The validation of the uncorrected data is addressed in Table 5.
Table 5.
Results of uncorrected CHIRPS data validation analysis.
Table 5 presents the comparison between rainfall data and CHIRPS satellite data without correction. Data are presented for 20 years. There are differences in rainfall values obtained from measurements with satellite data. Satellite data are not fully accurate in representing the rainfall conditions in the field. Rainfall fluctuates from year to year. Differences in ground p-values are not always followed by similar changes in satellite p-values. The calculation results obtained from the validation stage of the uncorrected satellite rainfall data are, respectively, for NSE, RSR, and KR values of 0.912, 5.756, and 6.15%. Based on the values obtained, the validation of the uncorrected satellite rainfall data resulted in the interpretation being “Not Met”. The values obtained from the validation of the uncorrected satellite rainfall data will thus be further analyzed. CHIRPS satellite rainfall data without correction still require improvement before they can be treated as accurate data. Accurate data estimation requires the calibration and validation of satellite data via field data.
3.3. Calibration of Satellite Rainfall Data
The calibration of satellite rainfall data is carried out with the aim that the modeled data, with respect to the observational data, have a high level of accuracy [25]. In analyzing the data, five regression equation models are needed, namely, linear, exponential, polynomial, logarithmic, and power. The resulting values are presented in Table 6, as follows.
Table 6.
Data analysis.
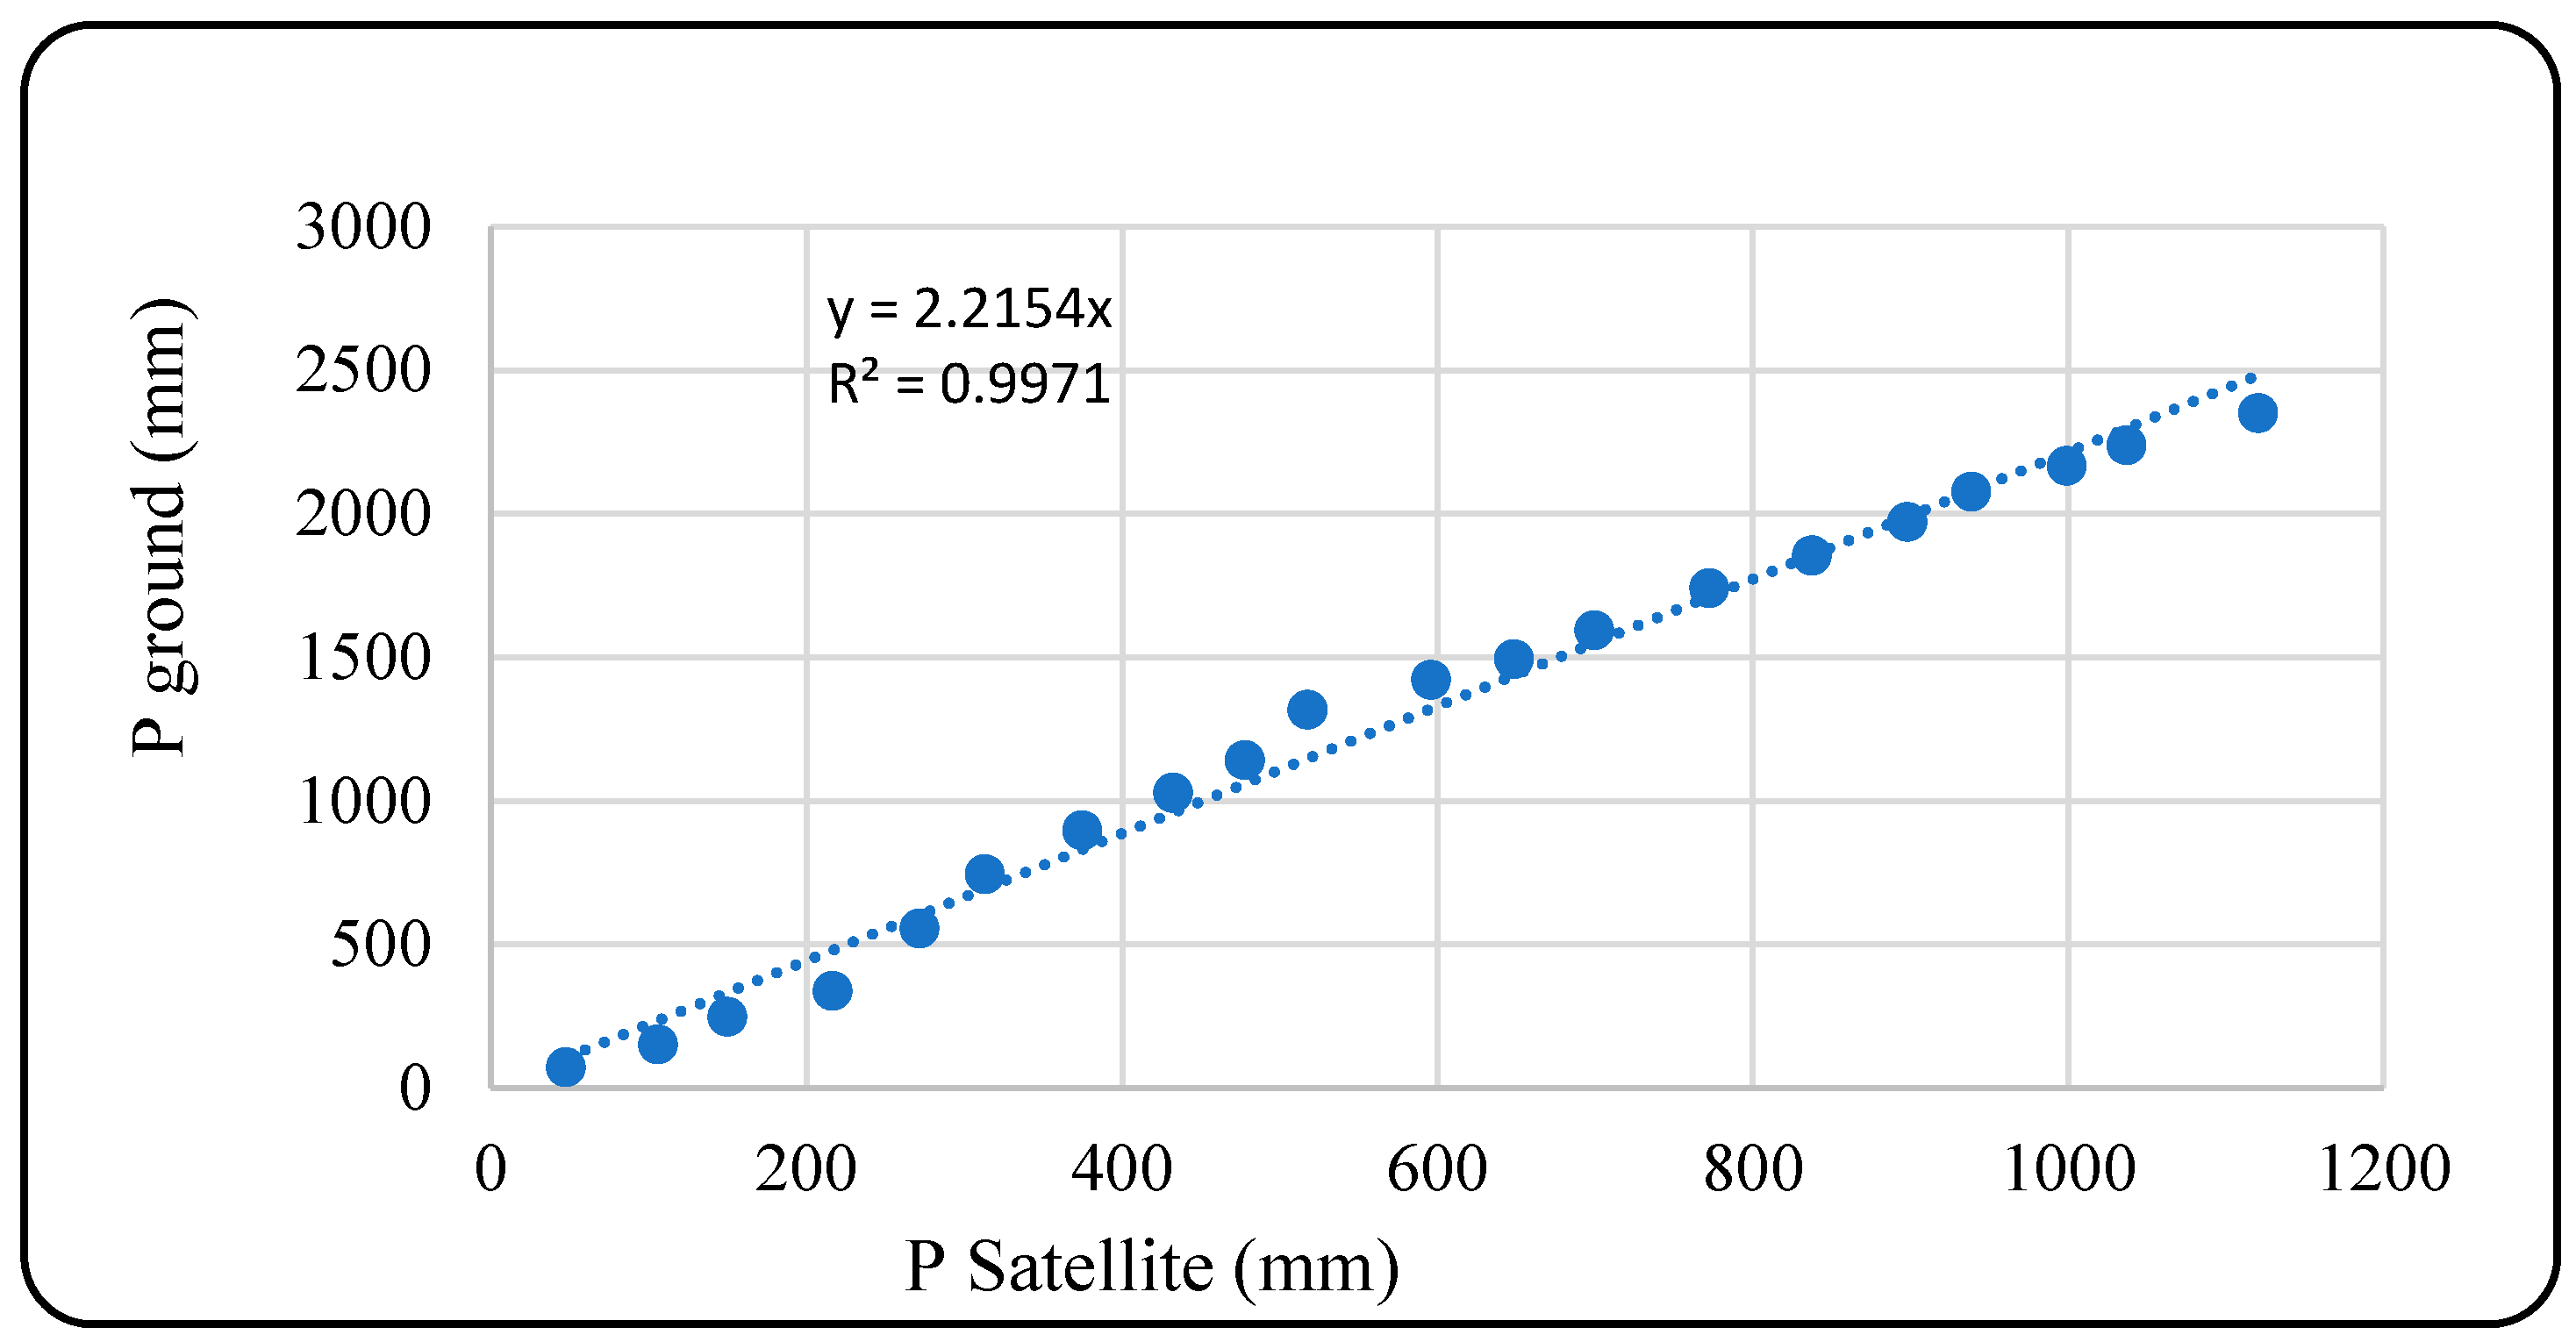
Table 6 shows the comparison of five analysis methods, namely, linear, exponential, polynomial, logarithm, and power. The linear method has the highest R2 value of 0.9971, indicating a good agreement between ground and satellite rainfall data. The linear method is used for CHIRPS data analysis with good accuracy. We need to consider further bias correction and validation before making decisions based on these data. The graphical representation of the linear method is shown in Figure 4.

Figure 4.
Linear model graph.
This graph shows the relationship between satellite p and ground p, with a positive correlation between the two. The straight line passing through the data points indicates a linear relationship between the rain station data and the satellite data. The coefficient of determination is 0.9971, indicating a very strong relationship. The graph shows that the rainfall data measured by the satellite have a close relationship with the rainfall data at the rain station. Satellite data can be used to predict rainfall based on satellite data.
3.4. Validation of Corrected Satellite Rainfall Data
The last stage of this research is the validation process for corrected satellite rainfall data, in which we compare the observation data with the corrected satellite data. The corrected satellite data are obtained from the regression equation, which was obtained at the satellite rainfall data calibration stage. At this stage, the calculation of the Nash–Sutcliffe efficiency (NSE), the RMSE–standard deviation ratio (RSR), and the relative error (KR) values is carried out using 20-year data from rainfall stations (2004–2023) that have been corrected using the regression equation selected at the calibration stage. The regression synchronization results are shown in Table 7.
Table 7.
Linear regression method.
In Table 7, rainfall data have been measured over the period 2003 to 2022. In 2003, the rainfall was 72 mm, while the uncalibrated satellite rainfall data gave a rainfall value of 47.6 mm, and after calibration it became 105.3 mm, so it changed. The satellite rainfall data are calibrated to correct discrepancies with rain station data. Satellite data calibration improves the accuracy and relevance of rainfall data. The results obtained from the validation stage for corrected satellite rainfall data are, respectively, for NSE, RSR, and KR, values of 0.80, 0.51, and 3.95%. Based on the values obtained, the validation of corrected satellite rainfall data produces a very good interpretation.
The analysis results show that CHIRPS rainfall data have an excellent performance, with an R2 value of 0.99. This value indicates that 99% of these satellite data can reliably be used for hydrological analyses. The use of satellite data provides a solution in areas where data are limited. Calibration in this study strengthens the validity of the data, as well as the effective management of water resources. The NSE value shows a very good model. The value of 0.92 changed to 0.8 after calibration. This increases the accuracy of the model describing the real field conditions. The RSR value also needs to strengthen the satellite data. The significant contribution of satellite data to the Siwaluh basin confirms the importance of satellite data in water resources management strategies.
These data can be used in hydrological modeling for flood mitigation. Rainfall data research needs to consider the suitability of the data for further analysis.
4. Conclusions
The characteristics of rainfall in the Siwaluh basin are not well known because many rainfall stations are damaged, and data are limited. The limitations in rainfall data can be overcome by using globally estimated rainfall data. In this study, the spatial variability of rainfall has been analyzed using CHIRPS data. The CHIRPS satellite data to be evaluated requires 20 years of rainfall data. From the results of the validation, the CHIRPS estimated rainfall is consistent with the station rainfall data. CHIRPS data, after going through the calibration process, show a strong correlation. The evaluation parameters were NSE, RSR, and KR. CHIRPS rainfall performs well in identifying rain.
The CHIRPS rainfall data values are as follows: NSE = 0.8, RSR = 0.51, and KR 3.95%, with a very good interception. The CHRIPS satellite can be recommended for estimating the rainfall that occurs in the Siwaluh basin area. This research shows the potential use of satellite data in water resource planning. In areas where station data are limited, satellite rainfall can serve as an effective alternative in understanding rainfall and decision-making. This research opens up possibilities for further research into the use of satellite technology in climate change adaptation, and contributes to the management of water resources in various regions.
Author Contributions
O.K.: conception, design, analysis, interpretation of data, and author of the article. R.R.H.: conception of the Siwaluh basin. B.S.: conception of CHIPRS data and article. S.: Conception of rainfall data entering the Siwaluh basin. All authors have read and agreed to the published version of the manuscript.
Funding
This research received no funding.
Data Availability Statement
We will share our research data.
Conflicts of Interest
The authors declare no conflicts of interest.
References
- Nuramalia, R.; Lasminto, U. Reliability of TRMM (Tropical Rainfall Measuring Mission) Satellite Rainfall Data against Earth Station Rainfall Data on Several Sub-watersheds in the Brantas. Watershed J. Appl. Tech. Civil 2022, 20, 207. [Google Scholar]
- Graf, M.; Chwala, C.; Chwala, C.; Polz, J.; Kunstmann, H.; Kunstmann, H. Rainfall estimation from a German-wide commercial microwave link network: Optimised processing and validation for 1 year of data. Hydrol. Earth Syst. Sci. 2020, 24, 2931–2950. [Google Scholar] [CrossRef]
- Marta, S.D.; Suhartanto, E.; Fidari, J.S. Validation of Satellite Rainfall Data with Rain Station Data in the Upper Ngasinan Watershed, Trenggalek Regency, East Java. J. Water Resour. Technol. Eng. 2023, 3, 35–45. [Google Scholar]
- Wiwoho, B.S.; Astuti, I.S.; Alfarizi, I.A.G.; Sucahyo, H.R. Validation of three daily satellite rainfall products in a humid tropic watershed, Brantas, Indonesia: Implications for land characteristics and hydrological modeling. Hydrology 2021, 8, 154. [Google Scholar] [CrossRef]
- Hastina; Harisuseno, D.; Fidari, J.S. Study of the Utilisation of CHIRPS Satellite Data for Rainfall Estimation in Abab. Sub Watershed J. Technol. Eng. Water Resour. 2023, 03, 540–549. [Google Scholar]
- Saidah, H.; Yasa, I.W.; Sulistiyono, H. Performance Measurement of Rain Chirps Data in Drought Assessment in Central Lombok. Ganec Swara 2024, 18, 523. [Google Scholar] [CrossRef]
- Prihanto, Y.; Koestoer, R.H.; Sutjiningsih, D. Re-assessing Rainwater Harvesting Volume by CHIRPS Satellite in Semarang Settlement Area. IOP Conf. Ser. Earth Environ. Sci. 2017, 98, 012004. [Google Scholar] [CrossRef]
- Arsanti Aphrodita, N.F.; Yuliara, I.M.; Yuda, I.W.A. Development Study on Filling Missing Rain Data with CHIRPS Data in Bali Region. Kappa J. 2023, 7, 193–200. [Google Scholar] [CrossRef]
- Oktaverina, D.A.R.; Suhartanto, E.; Wahyuni, S. Validation of TRMM (Tropical Rainfall Measuring Mission) Satellite Rainfall Data with Rain Station Posts in Keduang Sub Watershed of Wonogiri Regency, Central Java Province. J. Water Resour. Technol. Eng. 2022, 2, 1–276. [Google Scholar]
- Mahindraguna, R.; Dananjaya, R.H.; Chrismaningwang, G. Validation of calibrated IMERG satellite rain data with geographically weighted regression method against the station 3 rain date. Proceeding Civ. Eng. Res. 2023, 3, 149–159. [Google Scholar]
- Putri, W.P.P.; Harisuseno, D.H.; Wahyuni, S.W. Utilisation of Satellite Rain Data for the Creation of Spatial Maps of Design Rain in the Kedunggaleng Watershed. J. Technol. Eng. Water Resour. 2024, 4, 730–741. [Google Scholar]
- Atiah, W.A.; Amekudzi, L.K.; Aryee, J.N.A.; Preko, K.; Danuor, S.K. Validation of satellite and merged rainfall data over Ghana, West Africa. Atmosphere 2020, 11, 859. [Google Scholar] [CrossRef]
- Seregina, L.S.; Fink, A.H.; van der Linden, R.; Elagib, N.A.; Pinto, J.G. A new and flexible rainy season definition: Validation for the Greater Horn of Africa and application to rainfall trends. Int. J. Climatol. 2019, 39, 989–1012. [Google Scholar] [CrossRef]
- Singh, A.K.; Singh, V.; Singh, K.K.; Tripathi, J.N.; Kumar, A.; Sateesh, M.; Peshin, S.K. Validation of INSAT-3D derived rainfall estimates (HE & IMSRA), GPM (IMERG) and GLDAS 2.1 model rainfall products with IMD gridded rainfall & NMSG data over IMD’ meteorological sub-divisions during monsoon. Mausam 2018, 69, 177–192. [Google Scholar]
- Jarwanti, D.P.; Suhartanto, E.; Fidari, J.S. Validation of TRMM (Tropical Rainfall Measuring Mission) Satellite Rainfall Data with Rain Gauge Post Data in Grindulu Watershed, Pacitan Regency, East Java. J. Water Resour. Technol. Eng. 2021, 1, 772–785. [Google Scholar]
- Caroletti, G.N.; Coscarelli, R.; Caloiero, T. Validation of satellite, reanalysis and RCM data of monthly rainfall in Calabria (Southern Italy). Remote Sens. 2019, 11, 1625. [Google Scholar] [CrossRef]
- Rachidi, S.; El Mazoudi, E.H.; El Alami, J.; Jadoud, M.; Er-Raki, S. Assessment and Comparison of Satellite-Based Rainfall Products: Validation by Hydrological Modelling Using ANN in a Semi-Arid Zone. Water 2023, 15, 1997. [Google Scholar] [CrossRef]
- Auliyani, D.; Wahyuningrum, N. Rainfall variability based on the Climate Hazards Group InfraRed Precipitation with Station Data (CHIRPS) in Lesti watershed, Java Island, Indonesia. IOP Conf. Ser. Earth Environ. Sci. 2021, 874, 012003. [Google Scholar] [CrossRef]
- Tymvios, F.; Michaelides, S.; Retalis, A.; Katsanos, D.; Lelieveld, J. Increasing spatial resolution of CHIRPS rainfall datasets for Cyprus with artificial neural networks. In Proceedings of the Fourth International Conference on Remote Sensing and Geoinformation of The Environment, Paphos, Cyprus, 4–8 April 2016; Volume 9688, p. 96880G. [Google Scholar]
- Ismanto, R.D.; Prasasti, I.; Fitriana, H.L. Comparison analysis of himawari 8, chirps and gsmap data to detect rain in indonesia. J. Meteorol. Geophys. 2023, 24, 9–17. [Google Scholar] [CrossRef]
- Saragih, N.F.; Sitepu, S.; Simanungkalit, G.T.; Sinambela, M.; Rajagukguk, E.; Larosa, F.G.; Jaya, I.K. Validation of CHIRPS Rainfall Estimation Data Using Numerical Accuracy Test with Precipitation Observation Data. IOP Conf. Ser. Earth Environ. Sci. 2022, 1083, 012095. [Google Scholar] [CrossRef]
- Gerland, A.; Dengo, A.E.S.; Haryanto, Y.D. Data Validation of GPM, GSMaP, and CHIRPS Satellite Rainfall Prediction Models During the 2021 Seroja Tropical Cyclone Period in East Nusa Tenggara Province. Geogr. J. Educ. Res. Geogr. 2023, 4, 44–50. [Google Scholar]
- Novita Tri lara Atica, A.; Halik, G.; Saifurridzal. Rainfall Prediction Using CHIRPS and PERSIANN-CDR Satellite Rainfall Data in Bedadung Watershed of Jember Regency. J. Tech. Water Resour. 2022, 2, 69–80. [Google Scholar]
- Kurnianingsih, O.; Solikin, M.; Pudyastuti, P.; Sunarjono, S.; Hidayati, N. Analytical Hierarchy Process (AHP) to Determine the Sustainable Drainage System Used for Flood Management in Central Karanganyar Regency. J. Phys. Conf. Ser. 2021, 1858, 012002. [Google Scholar] [CrossRef]
- Belay, A.S.; Fenta, A.A.; Yenehun, A.; Nigate, F.; Tilahun, S.A.; Moges, M.M.; Dessie, M.; Adgo, E.; Nyssen, J.; Chen, M.; et al. Evaluation and application of multi-source satellite rainfall product CHIRPS to assess spatio-temporal rainfall variability on data-sparse western margins of Ethiopian highlands. Remote Sens. 2019, 11, 2688. [Google Scholar] [CrossRef]

Disclaimer/Publisher’s Note: The statements, opinions and data contained in all publications are solely those of the individual author(s) and contributor(s) and not of MDPI and/or the editor(s). MDPI and/or the editor(s) disclaim responsibility for any injury to people or property resulting from any ideas, methods, instructions or products referred to in the content. |
© 2025 by the authors. Licensee MDPI, Basel, Switzerland. This article is an open access article distributed under the terms and conditions of the Creative Commons Attribution (CC BY) license (https://creativecommons.org/licenses/by/4.0/).