Proceeding Paper

Lens Distortion Measurement and Correction for Stereovision Multi-Camera System †

by
Grzegorz Madejski
1,*,
Sebastian Zbytniewski
1,
Mateusz Kurowski
1,
Dawid Gradolewski
1,
Włodzimierz Kaoka
1 and
Wlodek J. Kulesza
2
1
Bioseco S. A., Budowlanych 68, 80-298 Gdansk, Poland
2
Department of Mathematics and Natural Sciences, Blekinge Institute of Technology, 371 79 Karlskrona, Sweden
*
Author to whom correspondence should be addressed.
Presented at the 11th International Electronic Conference on Sensors and Applications (ECSA-11), 26–28 November 2024; Available online: https://sciforum.net/event/ecsa-11.
Eng. Proc. 2024, 82(1), 85; https://doi.org/10.3390/ecsa-11-20457
Published: 26 November 2024

Abstract

In modern autonomous systems, measurement repeatability and precision are crucial for robust decision-making algorithms. Stereovision, which is widely used in safety applications, provides information about an object’s shape, orientation, and 3D localisation. The camera’s lens distortion is a common source of systematic measurement errors, which can be estimated and then eliminated or at least reduced using a suitable correction/calibration method. In this study, a set of cameras equipped with Basler lenses (C125-0618-5M F1.8 f6mm) and Sony IMX477R matrices are calibrated using a state-of-the-art Zhang–Duda–Frese method. The resulting distortion coefficients are used to correct the images. The calibrations are evaluated with the aid of two novel methods for lens distortion measurement. The first one is based on linear regression with images of a vertical and horizontal line pattern. Based on the evaluation tests, outlying cameras are eliminated from the test set by applying the 2 σ criterion. For the remaining cameras, the MSE was reduced up to 75.4 times, to 1.8 px−6.9 px. The second method is designed to evaluate the impact of lens distortion on stereovision applied to bird tracking around wind farms. A bird’s flight trajectory is synthetically generated to estimate changes in disparity and distance before and after calibration. The method shows that at the margins of the image, lens distortion might introduce errors into the object’s distance measurement of +17%−+20% for cameras with the same distortion and from −41% up to + for camera pairs with different lens distortions. These results highlight the importance of having well-calibrated cameras in systems that require precision, such as stereovision bird tracking in bird–turbine collision risk assessment systems.

1. Introduction

Reliable infrastructure monitoring has become a cornerstone of Industry 5.0, allowing for the autonomisation of modern industry with the use of state-of-the-art technologies [1]. There are many technologies, such as vision sensors, radar, and lidar, that enable collaboration between humans and systems [2]. Their use depends on many factors, e.g., distance, the size of the observed object, and the required robustness or accuracy. For vision-based systems, the quality of the images plays a crucial role. There are many factors that affect the image quality. One vital problem can be lens distortion, which reduces the precision of vision and distorts the viewed object’s size, shape, and localisation on the image plane. Despite them being manufactured within a range of identical specifications, the lens distortion coefficients and other intrinsic parameters of cameras often exhibit slight variations due to factors like component manufacturing inconsistencies, differences in the assembly process, environmental conditions, and prolonged use.
Therefore, for image-based monitoring systems, ensuring the precise calibration of cameras is essential for maintaining performance quality. This research focuses on the calibration of the Bird Protection System (BPS) by Bioseco [3,4], an advanced technology designed to prevent bird collisions with wind turbines and other large structures. BPS relies on multi-stereoscopic cameras to detect and track birds in real time. In this study, we address the problem of distortion calibration, which can improve stereovision-based distance measurement. The problem of variations in distortion among cameras and the possibility of using a correction method that could ensure correction consistency are analysed. We show that the calibration can significantly improve the accuracy of distance measurements. Nevertheless, we conclude that to achieve the required accuracy, each camera must be corrected separately.

2. Background Knowledge and Review of Related Works

In computer vision, the projection of a 3D point P w o r l d in the world onto a 2D image plane as a point P i m g for a pin-hole camera model is described by the following formula:
P i m g = K · [ R | t ] · P w o r l d ,
where K is the camera’s intrinsic matrix, with the internal characteristics of the camera, and [ R | t ] is the camera’s extrinsic matrix, describing how the camera is positioned in the 3D space through rotations and translations. For more details about these components and the pin-hole camera model, see [5]. Both matrices need to be correctly calculated in the intrinsic and extrinsic calibration processes, respectively. In the case of intrinsic parameter calibration, all of the elements in K need to be precisely calculated following the form
K = f x 0 c x 0 f y c y 0 0 1
where f x , f y are the focal lengths of the camera, and ( c x , c y ) is the principal point, i.e., the point where the optical axis intersects with the image. The focal lengths [px] can be derived from the focal length f [mm] of the camera, assuming we know the pixel width s x and height s y [mm], as f x = f / s x and f y = f / s y . The principal point is usually in the image centre.
In practice, the presented model does not accurately project points onto the image plane due to a non-linear disturbing factor such as lens distortion; this leads to a pincushion or barrel effect.
Typically, lens distortion is associated with two components: radial and tangential distortion. The first type affects the distance of the pixels from the centre of the image and the second one describes the misalignment of the optical axis with respect to the centre of the image.
Many mathematical models have been proposed to describe the physical process of distortion. For fisheye lenses, the Kannala–Brandt model is considered a good option [6]. For other types of lenses, the Brown–Conrady type is commonly used [7]. The Brown-Conrady model addresses both radial and tangential distortion, which are typically represented using five distortion coefficients:
D = ( k 1 , k 2 , p 1 , p 2 , k 3 ) .
where k 1 , k 2 , k 3 are the radial distortion coefficients, and p 1 , p 2 are the tangential distortion coefficients. To compute the undistorted pixel coordinates according to the Brown–Conrady model, we use the following formulas:
x u n d i s t o r t e d = x d i s t o r t e d + ( x d i s t o r t e d c x ) · ( k 1 r 2 + k 2 r 4 + k 3 r 6 )
y u n d i s t o r t e d = y d i s t o r t e d + ( y d i s t o r t e d c y ) · ( k 1 r 2 + k 2 r 4 + k 3 r 6 )
where r is the distance from the principal pixel to the distorted pixel:
r = ( x d i s t o r t e d c x ) 2 + ( y d i s t o r t e d c y ) 2 .
To find the distortion coefficients, one needs to use a calibration procedure. Zhang proposed a novel calibration technique [8] that could be used in an arbitrary setting. His method for camera calibration uses multiple images of a checkerboard pattern taken from different orientations to estimate the camera’s intrinsic parameters.
There are also alternatives to Zhang’s method, such as an algorithm using circles instead of checkerboards introduced by Heikkila [9], an algorithm developed by Rahman and Krouglicof [10], or a numerical calibration algorithm developed by Alvarez et al. [11]. Recently, even deep learning methods have been considered, e.g., by Janos and Benesova [12]. These algorithms might come in variations, e.g., the method presented by Chuang and Chen [13] supposedly improves Zhang’s algorithm by using checkerboards and principal lines. Duda and Frese proposed modified checkerboard corner detection for Zhang’s method [14].
Lens distortion can influence the correct distance or depth estimation of an object in stereovision systems [3,4]. The standard formula for the distance d between the camera image plane and the scene plane can be calculated with the aid of horizontal Δ x or vertical Δ y disparity, but we use the latter:
d = f · B Δ y · s y ,
where B is the baseline and s y is the height of a pixel.

3. Problem Statement

Although there are a variety of calibration techniques, no statistical analysis of the lens distortion effects across a set of cameras of the same type exists in the literature. Nor are there studies on the effect of differences in lens distortion in long-range object-tracking applications. This study aims to fill this gap by applying an analysis to monitoring systems using 3D localisation as a case study.
In this research, we focus on examining the effects of the lens distortion among different cameras on the 3D localisation estimation of a bird approaching a wind farm. The following research questions and hypotheses are considered.
Research Question 1: What are the effects of lens distortion on stereovision-based distance measurement, and how can they be eliminated?
Hypothesis 1.
There are two main effects of lens distortion on stereovision-based distance measurement. The first is that caused by the distortion of each camera, which deforms the pictures in different areas of the image at different levels. The second is that caused by differences in the lens distortions of various lenses. The common calibration method uses the Zhang–Duda–Frese correction method [8,14] applied to each camera.
Research Question 2: How can a lens be classified as an outlier based on the distortion level?
Hypothesis 2.
As a first classification criterion, we propose classifying lenses based on the coefficients k 1 , k 2 and k 3 and how they deviate from a lens set’s average value. As a second classification criterion, we propose applying a novel measure of the reduction in the linear curvature after the undistortion process compared to that in the original image.
Research Question 3: How can we measure the effect of the lens distortion of a camera and the consequence of the difference in the lens distortions in a stereovision camera pair on distance estimation?
Hypothesis 3.
To assess the impact of lens distortion, we simulate an ideal straight-line synthetic track of an object moving across the entire field of view of a stereovision camera pair. After applying the Zhang–Duda–Frese calibration method and the Nelder–Mead optimisation technique, the synthetic trajectories are distorted to reflect the effects of lens distortion. The constant disparity and distance for an ideal synthetic trajectory can be compared with the distance and disparity for distorted tracks to quantify the disparity and distance estimation errors. This approach allows us to evaluate the potential improvement achieved through the reverse process, which is distortion correction. This method can be applied to a stereo-camera pair where both lenses have the same or different distortions. In the latter case, the impact of the difference in the lens distortion on the distance estimation error can also be evaluated.

4. Implementation of Lens Distortion Correction

Some distortion correction methods are described in Section 2. In our study, we apply an experiment-based methodology, Zhang–Duda–Frese, which is popular and easy to use due to its implementation in the OpenCV library [15]. In this section, we describe the calibration process and its outcomes.

4.1. The Experimental Setup

This research was conducted using a batch of eleven cameras assembled using the Raspberry Pi High Quality Camera with a Sony IMX477 matrix [16] and a Basler lens C125-0618-5m-P with a focal length f = 6.0 ± 0.6 mm and an F1.8 aperture range [17].
For calibration, a checkerboard of 10 × 15 black and white squares was used. The board was printed onto a 594 mm × 841 mm A1 paper sheet and mounted into a frame for stabilisation. The side length of a single square is 52 mm. For evaluation purposes, two additional A1 posters were printed, one with vertical lines connecting the shorter sides of the poster and the other one with horizontal lines connecting the longer sides of the poster. The horizontal lines have 55 cm lengths, while the vertical lines have 81.3 cm lengths. All of the lines have a 2 mm width and a 17 mm gap between each other. Each measure has up to a 1 mm measurement error due to the measurement technique and tools used.
The calibration environment was a room with strong artificial light and weaker natural light blocked by window blinds. The cameras were installed onto a stable mono-pod rig 120 cm above the ground and sharpened using the posters, placed at a distance of 2 m. The camera sharpening was evaluated by the staff each time, and if the vision was blurry, the process was repeated.

4.2. The Calibration Process

All of the calibration images were taken at a distance of 2 m away from the camera. The camera was placed on the stable non-moving rig; one person held the checkerboard in the desired location while another person evaluated the position, corrected it if necessary, and took photographs. For every camera, a total of 30 photographs of the checkerboard were taken. This number was experimentally proven to be sufficient to estimate good calibration parameters, even when slight alterations in the checkerboard localisation in 3D space or other disturbing factors were considered.
The first nine images were taken with the checkerboard held parallel to the camera scene in different locations (left/middle/right and top/middle/bottom) such that the nine checkerboards covered most of the field of view. The middle-top location of the checkerboard can be seen in Figure 1a. Following that, the rest of the images were taken in various field-of-view locations with a modified checkerboard yaw (see Figure 1b), modified pitch (see Figure 1c), or a slightly altered roll.
Once all the pictures had been taken for each camera, the Zhang–Duda–Frese algorithm [8,14] was used to calculate the distortion coefficients of the lens. The matrix K was fixed for all cameras, with the principal point in the centre of the image as
K = 3056 0 1200 0 3054 1600 0 0 1
and the radial distortion coefficients k 1 , k 2 , and k 3 were calculated for each camera using a fixed value for K . Using the distortion coefficients, the calibration process can be applied to an image. Each pixel of the distorted image is moved by a 2D vector, defined by Formulas (4) and (5). The result of this movement is a new, corrected image.
Examples of the correction process are presented in Figure 2. The estimated distortion coefficients are used to correct the pictures of vertical and horizontal lines taken from a distance of 0.5 m, covering the entire camera view. Figure 2a,c show the images with the original lines, while Figure 2b,d show the images after correction, where the black margin parts are the measure of deformation.

4.3. Camera Evaluation Based on Distortion Coefficients

Estimation of the distortion coefficients for a set of cameras of the same type can be used to evaluate them, find cameras that can be used for stereovision, and disqualify cameras for which the outlying distortion coefficients can create a great amount of uncertainty in distance measurement. We assume that cameras whose distortion coefficients vary more than 2 σ from the average values should not be used.
In our experiment, the process for finding the distortion coefficients k 1 , k 2 , and k 3 was carried out for eleven cameras, numbered 159, 183, 218, 223, 226, 247, 304, 401, 1726, 1855, and 2182. The calculation results are presented in Table 1. The cells of the table are coloured to find outlying values, and it can be seen that the distortion coefficients of camera 1726 deviate the most, and therefore this camera should be eliminated from further experiments.
To visualise the effect of lens distortion on the pixel displacement, heatmaps for cameras 159 and 183 are presented in Figure 3. The difference in the pixel displacement between the two cameras is presented in Figure 3c and can reach around 5 px.

5. Evaluation of Lens Distortion Correction and Its Impact on Stereovision-Based Distance Measurement

We propose two methods for evaluating the performance of the image corrections. The first one applies linear regression to measure the line curvature before and after correcting the distortion. The second one uses perfect synthetic tracks, distorts them, and calculates the errors in the distance estimation.

5.1. Evaluation of the Improvement in the Line Curvature After Lens Distortion Correction

The evaluation method finds how straight vertical and horizontal lines in the template, which are distorted in the original image, are straightened using the distortion correction method. Firstly, a few pre-processing steps are undertaken. A square kernel filters the pictures to convert the images into black and white. The kernel is an experimentally found square matrix where each row is [8, 8, 4, −4, −12, −12, −12, −4, 4, 8, 8]. Only coherent lines are processed further. To simplify the process, the vertical line image is rotated by 90 degrees so that both images have a horizontal orientation.
A novel measure of the curvature of the lines before and after correction is used to assess the results of correction. The curvature is measured by the MSE value of the differences between the ideal line created using linear regression and the lines from the distorted and corrected images; see Figure 4.
Since some cameras have more lines or regression points than others, additional normalisation is applied. Due to the differences in the distortions at the image margins, images are cropped at the sides to ensure that evaluation is carried out in the same image area. After that, the 800 points most distant from the centre of the image are selected. Using these points, we measure their distances from the regression lines and compute the mean squared error, the MSE, which is used as the evaluation score.
The evaluation results for eight cameras are presented in Table 2 and Table 3 for distorted and undistorted lines, respectively. The MSE values of the distorted images vary from 182 px to 249 px for vertical lines and from 72 px to 117 px for horizontal lines. The MSE values for the corrected images vary from 1.9 px to 4.4 px for vertical lines and from 2.3 px to 6.9 px for horizontal lines. From Table 3, it can be concluded that the improvement rate, which is a ratio of the MSE before and after calibration, for vertical lines is much greater than that for horizontal ones, at 81.4 vs. 28.3. The mean improvement in specific cameras varies from 30.8 for camera 218 to 75.4 for camera 218. Such big differences in the improvement prove the effectiveness of the correction method.
Cameras 247 and 1855 were excluded from the set of test cameras because of their outlying MSE values for corrected images, at 13.02 px and 20.12 px, respectively.

5.2. Evaluation of the Lens Distortion Effect on Stereovision

This research also involves testing how the lens distortion affects the estimation of an object’s distance at long range using stereo-cameras. The proposed method uses data from camera tests and synthetically generated long-range flight paths. The cameras’ technical specifications are mentioned in Section 4.1, and the distortion coefficients are given in Table 1. The experiment used a BPS layout, with cameras mounted vertically with a baseline of B = 1 m [4]. The estimation of distance d [m] is calculated based on (7), with the height of each pixel s y = 0.006287 mm according to the camera’s technical specifications [16,17].
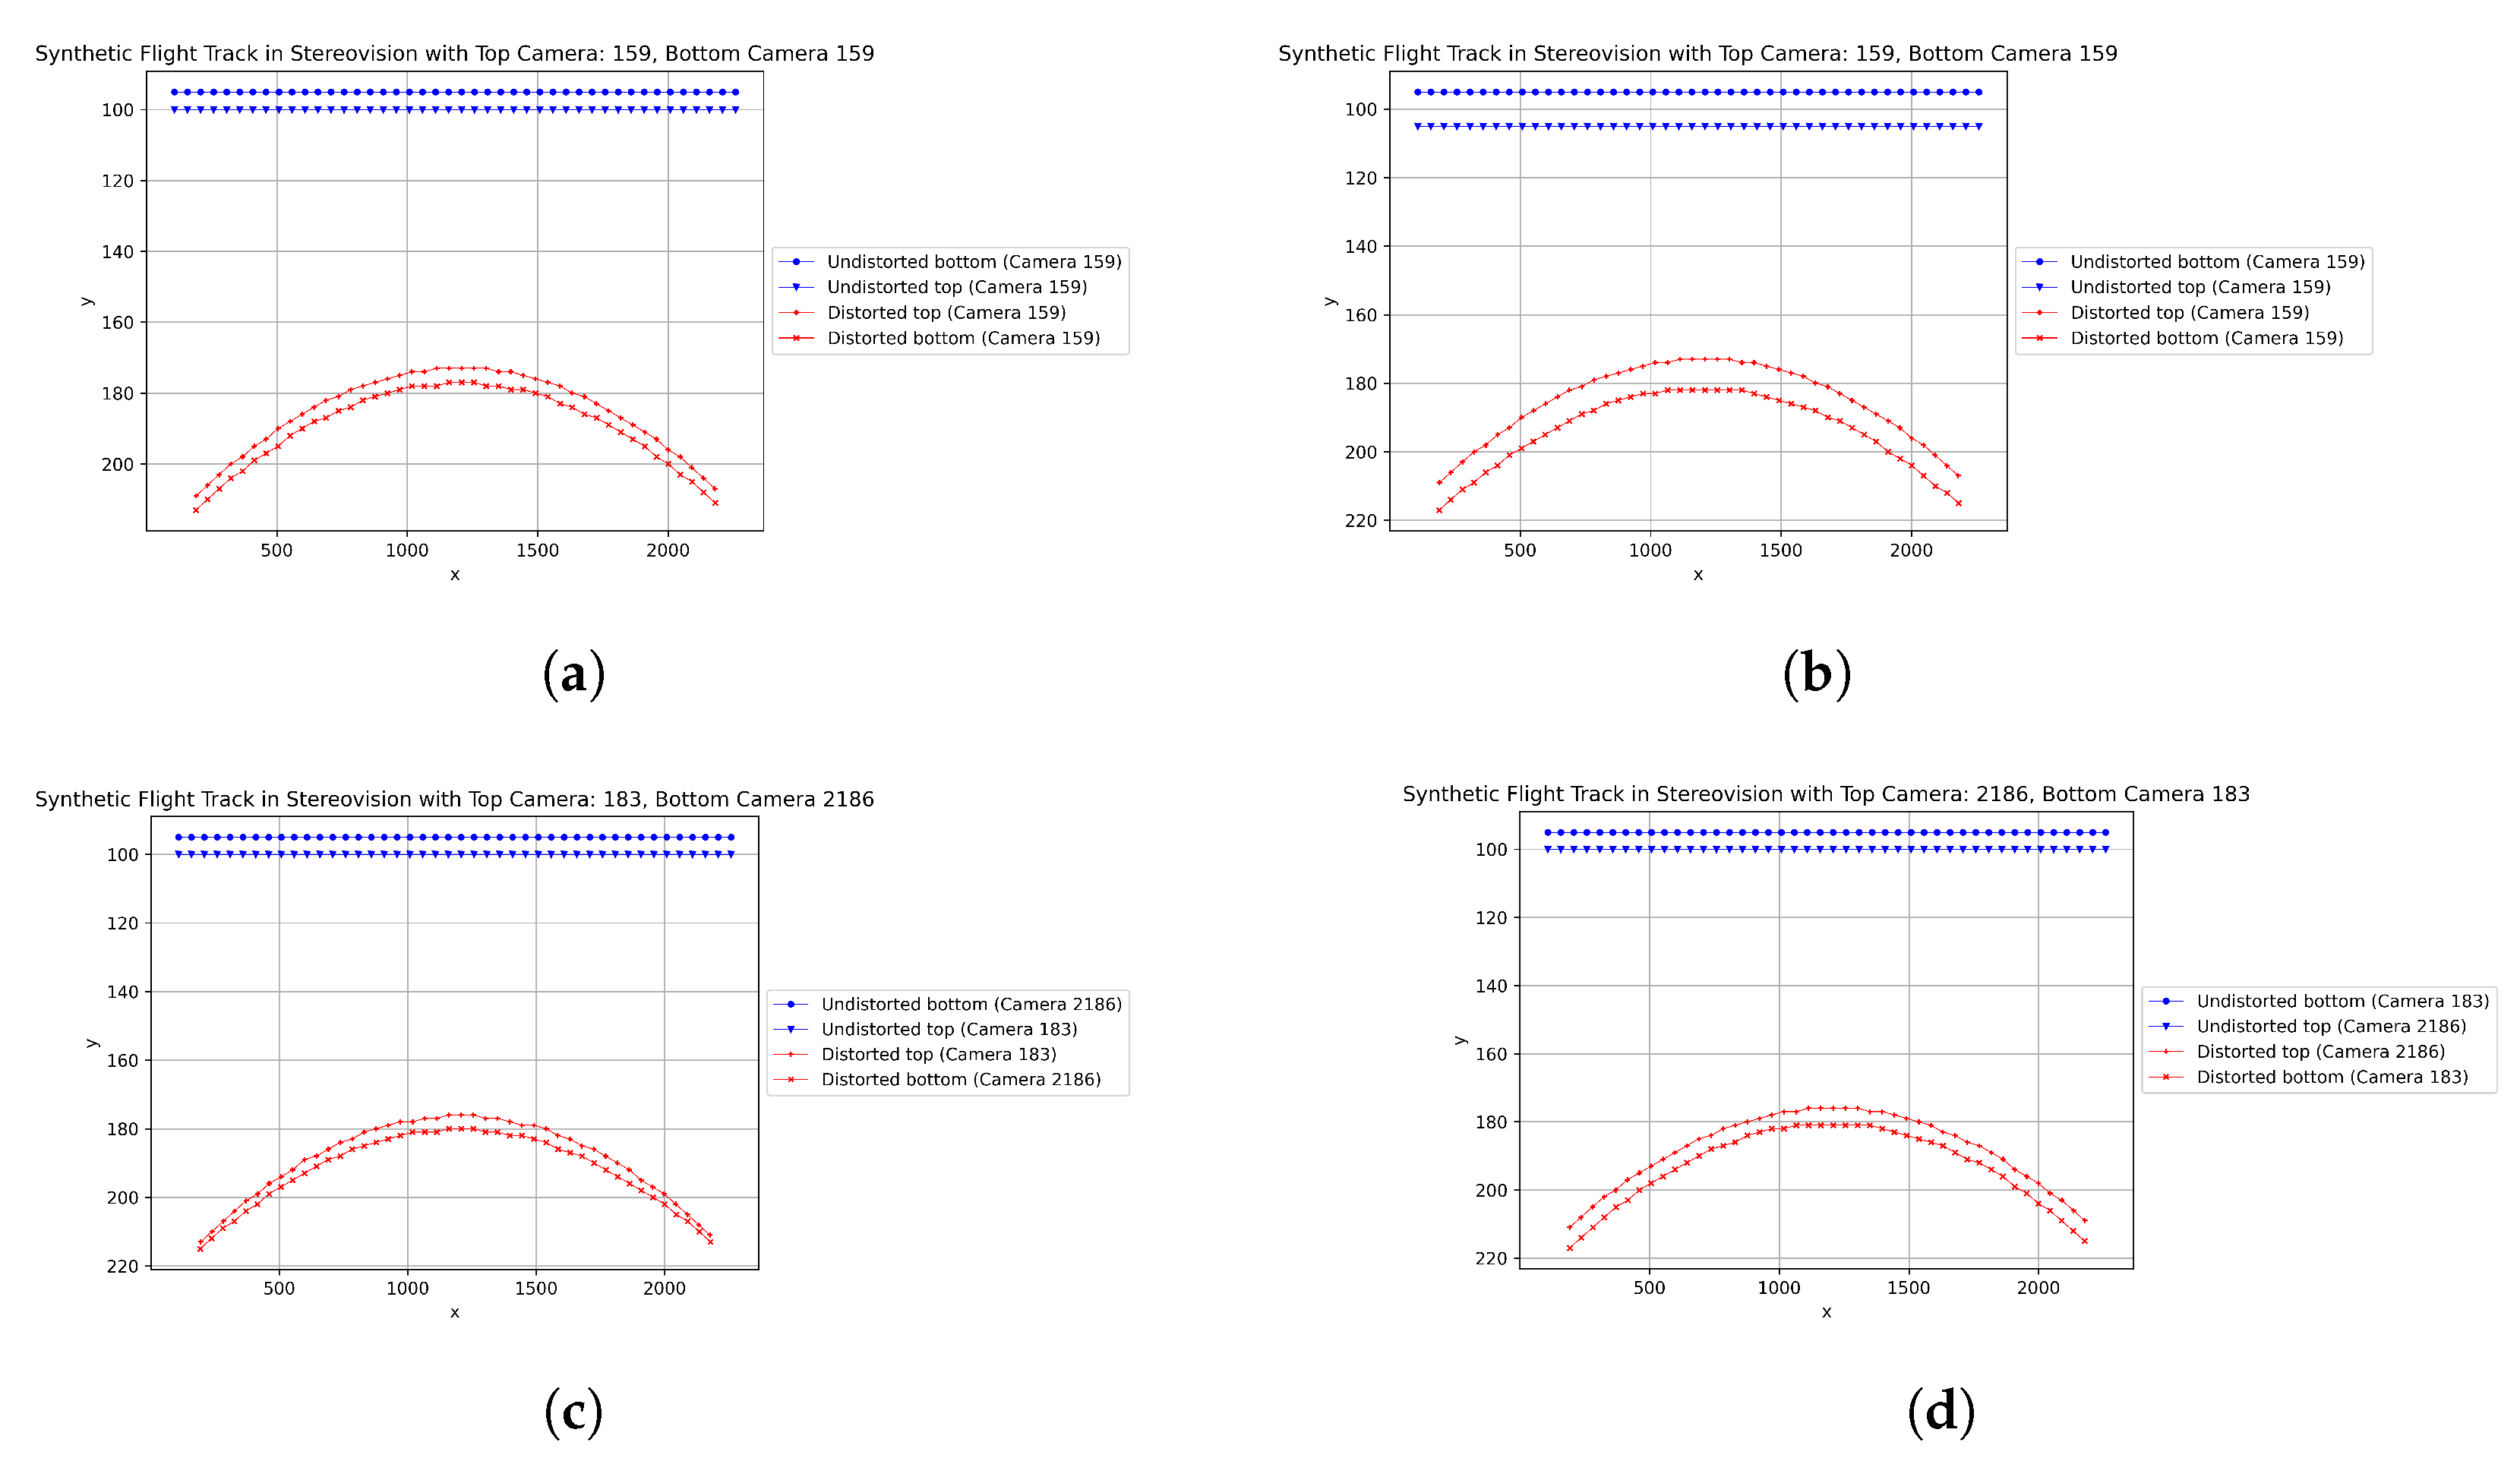
The following experiments were needed to ensure that the undistorted and distorted images had the same size, at 2400 px × 3200 px. We simulated a bird’s flight at constant distances defined by the disparity between two lines. Assuming both stereo-cameras have no lens distortion, the lines would map the bird’s trajectory as two parallel horizontal lines. The line on the bottom camera was Δ y pixels above the top one. Both lines were placed in the uppermost part of the camera images, where they are most affected by lens distortion; see Figure 3.
In this section, the following notation is used: the top camera is the camera placed above the bottom camera, and in the coordinate system with a reference point in the middle of the matrix, it sees objects which are above its optical axis and closer to the middle of the matrix than the bottom camera. However, in image processing, the coordinates are usually related to the top-left corner of the images, so the top line corresponds to the bottom camera, and, vice versa, the bottom line corresponds to the top camera.
The two parallel lines are a series of points in each camera’s frame with a constant value of y and with x varying from 0 to 2400. Then, each line is distorted using the algorithm, which applies distortion coefficients for a process of reverting the correction. This is carried out using a numerical algorithm implementing the Nelder–Mead optimisation method. The algorithm iteratively searches for the distorted pixel coordinates given an undistorted pixel. This method ensures precision to five decimal places. This methodology is applied to two settings for the lines:
  • Track 1: y t o p = 95 px, y b o t t o m = 100 px, and Δ y = 5 px corresponding to d = 600 m;
  • Track 2: y t o p = 95 px, y b o t t o m = 105 px, and Δ y = 10 px corresponding to d = 300 m.
The experiments with the synthetic track evaluation method use the distortion coefficients from cameras 159, 183, and 2186. Visualisation of the method is presented in Figure 5, which illustrates four cases. Figure 5a and Figure 5b show Track 1 and Track 2, respectively, for camera 159. Figure 5c and Figure 5d show Track 1 for a pair of cameras 183 and 2186 in the reverse constellation. Note that reversing the order of the cameras, reversing top for bottom, strongly affects the disparity between cameras; see Figure 5c,d.
To evaluate how differences in the distortions of different lenses can affect the non-corrected measurement, we test a case when the same camera is used in a stereovision set. For each track and each camera pair, a few measures are calculated: the minimal and maximal disparities in the distorted track in [px] and their corresponding distances in [m], estimated using (7), and their deviation from the original, corrected values in [%]. The results are shown in Table 4.
Table 4 shows the experimental results for the nine combinations of three cameras for each of two tracks. Stereo cameras with the same distortion coefficients are given along the table’s main diagonal. The results are consistent since the errors in the disparities and distances for both tracks range from +17% to +20%. This ideal case would be where all the lenses and cameras are consistently manufactured and assembled.
In reality, a stereovision pair consists of two cameras with different distortion coefficients, which is illustrated in the non-diagonal cells of Table 4. Lenses with different distortions in the top and bottom cameras cause bigger errors. In some cases, the distance becomes shorter, e.g., for the pair with top camera 159 and bottom camera 2186, with a distance error between 34 % and 41 % . In the case of top camera 183 and bottom camera 159 for Track 1, the distance appears to be much larger, between 96 % and 302 % . Sometimes, the disparity falls at 0 px or a negative value, giving a false infinity position.
The presented results show that removing lens distortion is crucial for accurate object localisation, especially in the affected image parts, i.e., the corners and margins. Correction is essential to the monitoring within a long-range stereovision system, such as BPS. This system has to make autonomous decisions when a large bird of prey is approaching a wind turbine at a 400 m distance to be able to stop the rotor in time. As shown, distances of 600 m and 300 m may be falsely estimated and appear as long and safe, while it could be too late for the necessary reaction.

6. Results and Conclusions

The calibration process for each camera uses a checkerboard with non-standardised positioning and consists of a significant number of calibration images. This process relies on a large number of images and their stable positioning rather than positional precision. The calibration parameters are unique to a given camera. The differences in the distribution of the distortion coefficients can cause calibration problems. Therefore, cameras which vary by more than 2 σ from the set of cameras should not be used, especially for stereovision applications.
The correction quality can be evaluated based on linear regression lines. A statistical comparison of the results can help to eliminate cameras that deviate from the average measurements. The 2 σ criterion seems to be suitable for camera selection.
Using synthetic tracks that simulate bird flight is a way to check and evaluate the effect of lens distortion on stereovision applications. The presented results show that the effect can be considered a linear systematic error of a value less than 20% but only in cases where both cameras have the same parameters. For cameras with different lens parameters, the error can be as big as 400% or even be considered a mistake due to the impossible relationship between the object localisation in the top and bottom cameras. However, calibration of the lens distortion can correct the error. Nevertheless, careful consideration of the paired cameras is recommended.
The methods and results presented in this paper are preliminary steps for future research. The next step would focus on improving the distortion correction algorithm or model, which could be based on a Machine Learning approach. Apart from this, a synthetic 3D bird flight trajectory could be used to evaluate the tracking error in the movement in different areas of the lenses. Also, a statistical analysis of the lens parameter distributions for a large number of cameras is an interesting issue.

Author Contributions

Conceptualisation: D.G., W.J.K. and W.K. Methodology: G.M., W.K. and W.J.K. Software: G.M., S.Z. and M.K. Validation: G.M. Formal analysis: G.M. and W.J.K. Investigation: G.M. Resources: D.G. Data curation: S.Z. and M.K. Writing—original draft preparation: G.M. Writing—review and editing: W.J.K. Visualisation: G.M., S.Z. and M.K. Supervision:, W.J.K. Project administration: D.G. Funding acquisition: D.G. and W.J.K. All authors have read and agreed to the published version of the manuscript.

Funding

This research was funded by the National Centre for Research and Development of Poland, grant number POIR.01.02.00-00-0247/17. Project title: ‘Realization of R&D works leading to the implementation of a new solution—MULTIREJESTRATOR PLUS for monitoring and control of the power system in terms of operational efficiency, the life span extending and optimizing the impact on the surrounding wind farms’.

Institutional Review Board Statement

Not applicable.

Informed Consent Statement

Not applicable.

Data Availability Statement

The data presented in this study are available on request from the corresponding author.

Conflicts of Interest

Authors Grzegorz Madejski, Sebastian Zbytniewski, Mateusz Kurowski, Dawid Gradolewski and Włodzimierz Kaoka were employed by the company Bioseco S. A. The remaining authors declare that the research was conducted in the absence of any commercial or financial relationships that could be construed as a potential conflict of interest. The funders had no role in the design of this study; in the collection, analyses, or interpretation of the data; in the writing of the manuscript; or in the decision to publish the results.

References

  1. van Erp, T.; Carvalho, N.G.P.; Gerolamo, M.C.; Gonçalves, R.; Rytter, N.G.M.; Gladysz, B. Industry 5.0: A new strategy framework for sustainability management and beyond. J. Clean. Prod. 2024, 461, 142271. [Google Scholar] [CrossRef]
  2. Gradolewski, D. Sensors and Algorithms in Industry 4.0: Security and Health Preservation Applications. Ph.D. Thesis, Blekinge Tekniska Högskola, Karlskrona, Sweden, 2021. [Google Scholar]
  3. Gradolewski, D.; Dziak, D.; Kaniecki, D.; Jaworski, A.; Skakuj, M.; Kulesza, W.J. A Runway Safety System Based on Vertically Oriented Stereovision. Sensors 2021, 21, 1464. [Google Scholar] [CrossRef] [PubMed]
  4. Gradolewski, D.; Dziak, D.; Martynow, M.; Kaniecki, D.; Szurlej-Kielanska, A.; Jaworski, A.; Kulesza, W.J. Comprehensive Bird Preservation at Wind Farms. Sensors 2021, 21, 267. [Google Scholar] [CrossRef] [PubMed]
  5. Hartley, R.; Zisserman, A. Multiple View Geometry in Computer Vision; Cambridge University Press: Cambridge, UK, 2003. [Google Scholar]
  6. Kannala, J.; Brandt, S.S. A generic camera model and calibration method for conventional, wide-angle, and fish-eye lenses. IEEE Trans. Pattern Anal. Mach. Intell. 2006, 28, 1335–1340. [Google Scholar] [CrossRef] [PubMed]
  7. Brown, D. Decentering distortion of lenses. Photogramm. Eng. 1966, 32, 444–462. [Google Scholar]
  8. Zhang, Z. A flexible new technique for camera calibration. IEEE Trans. Pattern Anal. Mach. Intell. 2000, 22, 1330–1334. [Google Scholar] [CrossRef]
  9. Heikkila, J. Geometric camera calibration using circular control points. IEEE Trans. Pattern Anal. Mach. Intell. 2000, 22, 1066–1077. [Google Scholar] [CrossRef]
  10. Rahman, T.; Krouglicof, N. An Efficient Camera Calibration Technique Offering Robustness and Accuracy Over a Wide Range of Lens Distortion. IEEE Trans. Image Process. 2012, 21, 626–637. [Google Scholar] [CrossRef] [PubMed]
  11. Álvarez, L.; Gómez, L.; Sendra, J.R. An Algebraic Approach to Lens Distortion by Line Rectification. J. Math. Imaging Vis. 2009, 35, 36–50. [Google Scholar] [CrossRef]
  12. Janos, I.; Benesova, W. Improving radial lens distortion correction with multi-task learning. Pattern Recognit. Lett. 2024, 183, 147–154. [Google Scholar] [CrossRef]
  13. Chuang, J.H.; Chen, H.Y. Alleviating Radial Distortion Effect for Accurate, Iterative Camera Calibration Using Principal Lines. IEEE Trans. Instrum. Meas. 2024, 73, 1–11. [Google Scholar] [CrossRef]
  14. Duda, A.; Frese, U. Accurate Detection and Localization of Checkerboard Corners for Calibration. In Proceedings of the British Machine Vision Conference, Newcastle, UK, 3–6 September 2018. [Google Scholar]
  15. Bradski, G. The OpenCV Library. Dr. Dobb’s J. Softw. Tools 2000, 120, 122–125. [Google Scholar]
  16. Raspberry Pi High Quality Camera. Available online: https://datasheets.raspberrypi.com/hq-camera/hq-camera-product-brief.pdf (accessed on 14 October 2024).
  17. Sony IMX477 Matrix. Available online: https://docs.baslerweb.com/c125-0618-5m-p (accessed on 14 October 2024).
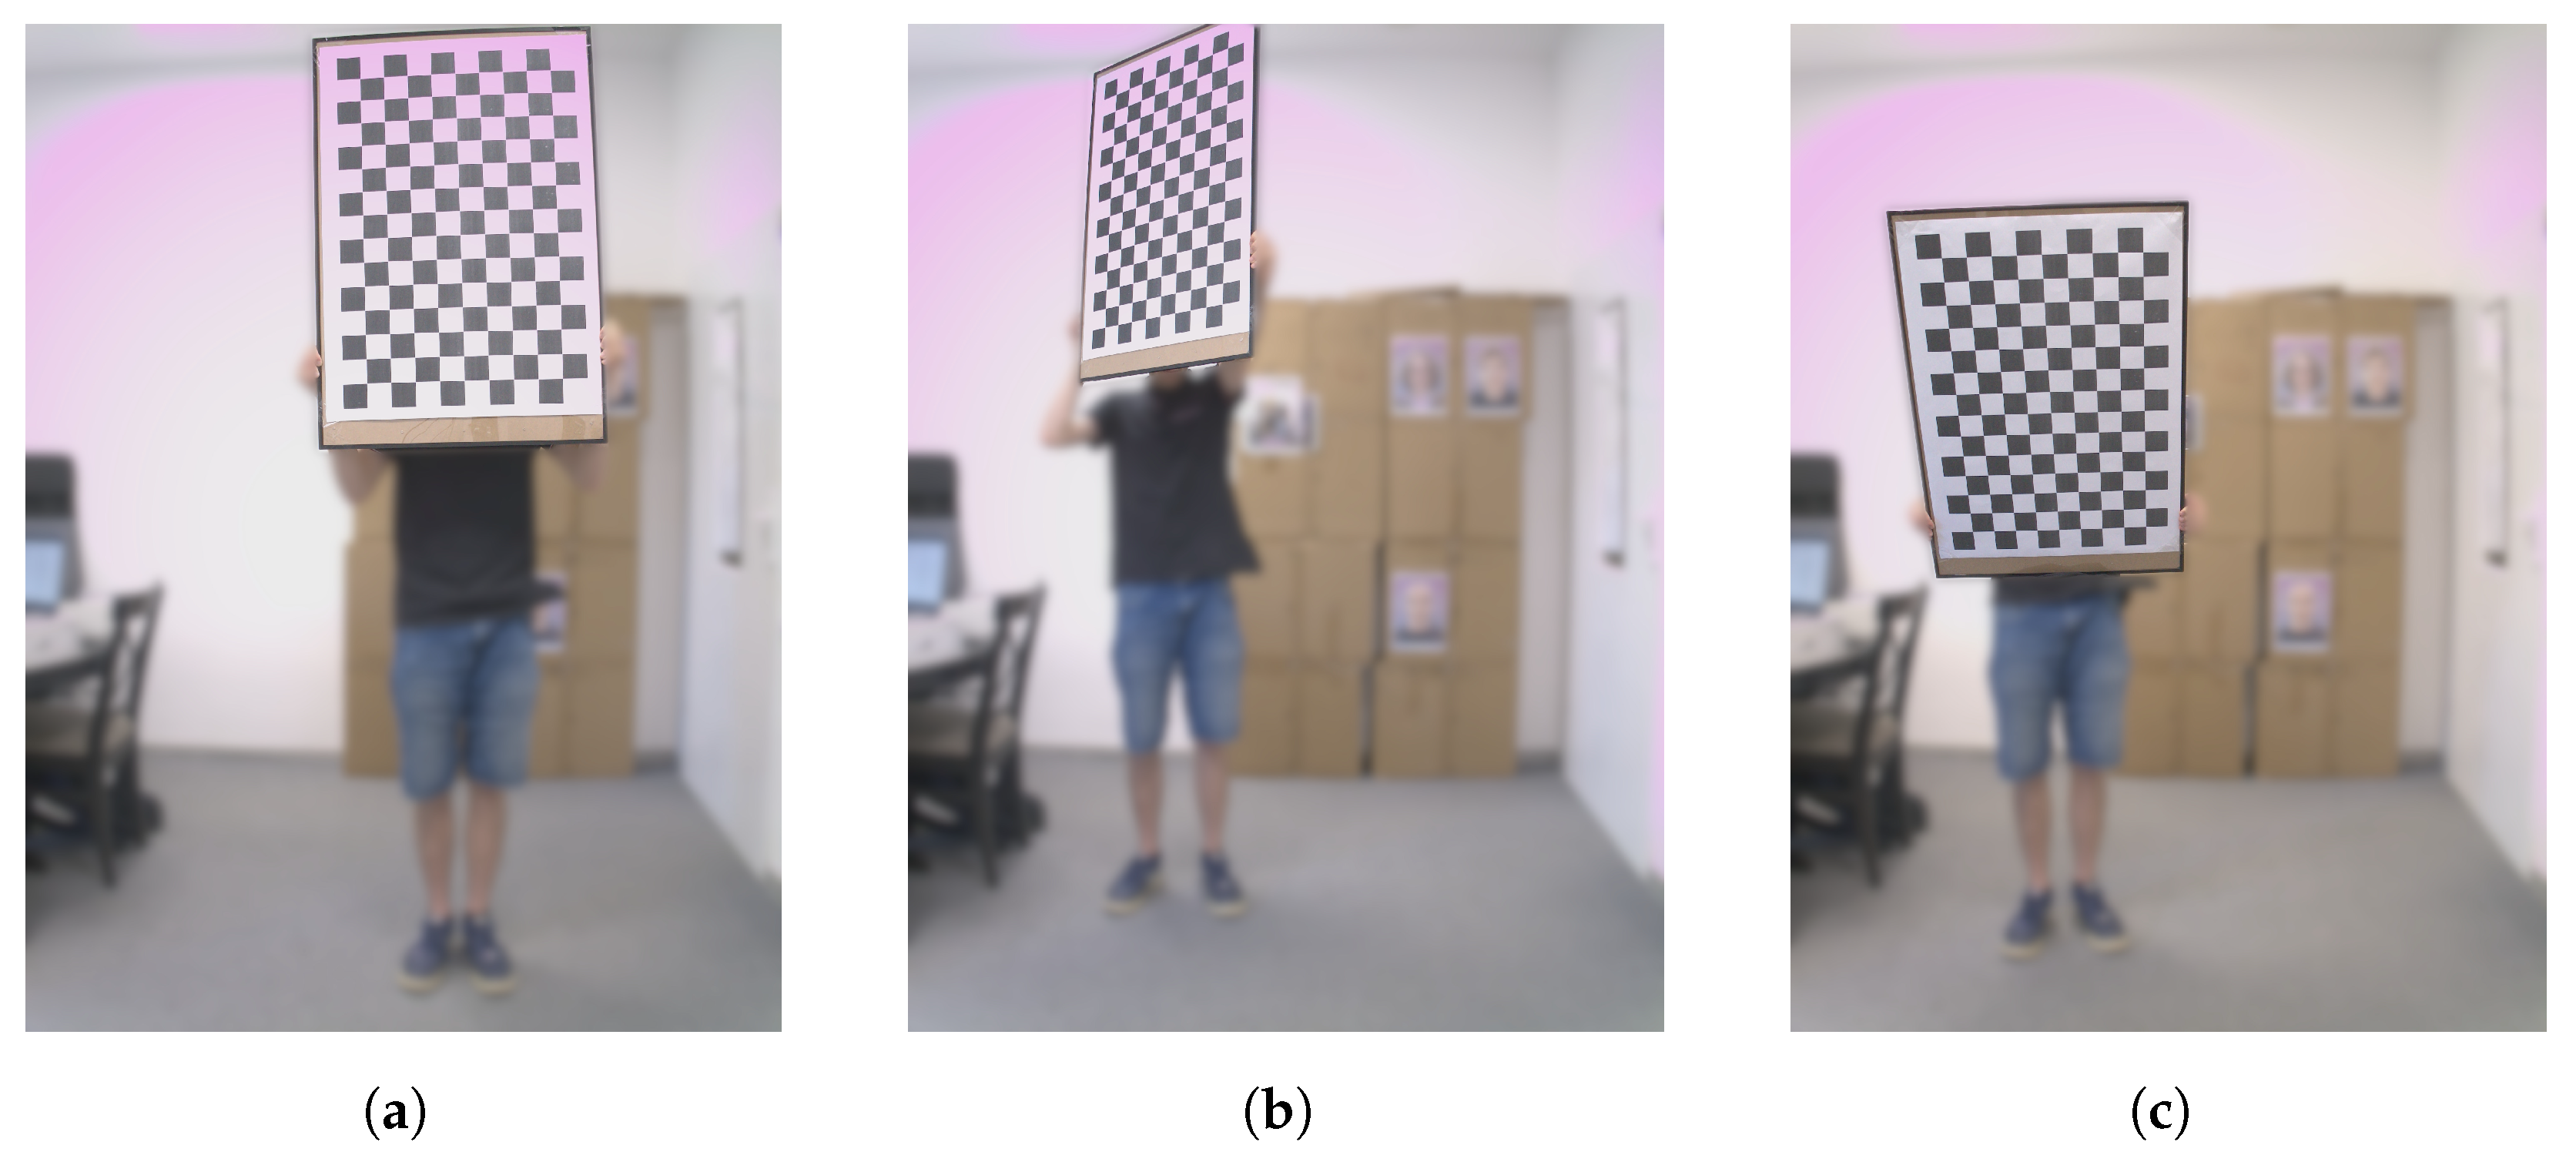
Figure 1. Photographs used to calibrate camera 1751 with a blurred background for anonymity. (a) Image with the checkerboard parallel to the camera scene. (b) Image with yaw transformation applied to the checkerboard. (c) Image with pitch transformation applied to the checkerboard.
Engproc 82 00085 g001
Figure 2. Process of lens distortion correction/undistorting. The original images are stretched, especially at the corners. This affects the empty blackened areas in the corrected images. (a) Horizontal lines—original image. (b) Horizontal lines—corrected image. (c) Vertical lines—original image. (d) Vertical lines—corrected image.
Engproc 82 00085 g002
Figure 3. Comparison of heatmaps of pixel displacement for camera calibrations. The distortion level is the vector length by which the original pixel should be moved to obtain an undistorted image. (a) Heatmap for calibration of camera 159. (b) Heatmap for calibration of camera 183. (c) Heatmap of differences between heatmap (a,b).
Engproc 82 00085 g003
Figure 4. The upper part of the horizontal line images for camera 183, distorted on the left and corrected on the right. Linear regression is applied to the photographed lines in black by taking a sample of the points in red. The regression result lines are in blue.
Engproc 82 00085 g004
Figure 5. Comparison of synthetic bird tracks before (blue) and after (red line) distortion. (a) Undistorted and distorted Track 1 for camera 159. (b) Undistorted and distorted Track 2 for camera 159. (c) Undistorted and distorted Track 1 for top camera 183 and bottom camera 2186. (d) Undistorted and distorted Track 1 for top camera 2186 and bottom camera 183.
Engproc 82 00085 g005
Table 1. Distortion coefficients, mean, and standard deviation values. For each coefficient, the values are tested using z . s c o r e = ( x m e a n ) / s d to find outliers. A value with z . s c o r e [ 1 , 1 ] is marked with green; for z . s c o r e [ 2 , 1 ) ( 1 , 2 ] , the value is yellow, and for z . s c o r e [ 3 , 2 ) ( 2 , 3 ] , the value is orange.
Distortion Coefficients
k 1 k 2 k 3
Camera ID159−0.217−0.0240.158
183−0.2430.0670.077
218−0.2350.0100.141
223−0.2240.0420.053
226−0.2370.0270.134
247−0.2410.0090.162
304−0.2840.269−0.300
401−0.2660.203−0.192
1726−0.200−0.2920.828
1855−0.2620.149−0.112
2186−0.2470.109−0.041
mean−0.2410.0520.083
sd0.0240.1450.291
Table 2. Linear regression evaluation results for distorted lines. The MSE is calculated using two photos from each camera.
Camera IDMean
[px]
1591832182232264012186
Vertical [px]185.4182.0249.1224.6217.4210.4212.9211.7
Horizontal [px]114.4116.671.699.5107.1117.3106.5118.9
Mean [px]149.9149.3160.3162.1162.2163.8165.9159.1
Table 3. Linear regression evaluation results for corrected lines (after calibration). The MSE is calculated using two photos from each camera.
Camera IDMean
[px]
Improvement
Rate
1591832182232264012186
Vertical [px]1.91.83.54.42.72.22.02.681.4
Horizontal [px]4.42.56.95.03.74.82.34.228.3
Mean [px]3.12.15.24.63.23.52.23.446.8
Improvement Rate48.471.130.835.250.746.875.446.8
Table 4. Impact of lens distortion on the stereovision measured for the camera pairs using the synthetic bird tracks. Table cell colours emphasise errors, going up to 20% (green), then up to 100% (yellow) and above 100% (red).
Max and min errors in disparity and distance for distorted Track 1 Δ y = 5 px ,   d = 600 m
Top↓, Bottom→1591832186
159−0.7 px → 105 m (+17%)
−0.8 px → 112 m (+19%)
2.3 px → −187 m (−32%)
0.9 px → −90 m (−15%)
3.5 px → −246 m (−41%)
2.5 px → −202 m (−34%)
183−2.4 px → 576 m (+96%)
−3.8 px → 1814 m (+302%)
−0.7 px → 105 m (+17%)
−0.8 px → 110 m (+18%)
1.8 px → −169 m (−27%)
−0.5 px → 162 m (+10%)
2186−3.0 px → 2540 m (+423%)
−5.0 px → +  m
−1.0 px → 156 m (+26%)
−3.4 px → 1302 m (+217%)
−0.8 px → 107 m (+18%)
Max and min errors in disparity and distance for distorted Track 2 Δ y = 10 px ,   d = 300 m
Top↓, Bottom→1591832186
159−1.5 px → 52 m (+17%)
−1.6 px → 56 m (+19%)
1.5 px → −40 m (−13%)
0.1 px → −3 m (−1%)
2.6 px → −63 m (−21%)
1.8 px → −45 m (−15%)
183−3.2 px → 143 m (+48%)
−4.5 px → 245 m (+82%)
−1.5 px → 52 m (+17%)
1.0 px → −27 m (−9%)
−1.2 px → 42 m (+14%)
2186−4.8 px → 275 m (+92%)
−5.9 px → 429 m (+143%)
−1.8 px → 65 m (+22%)
−4.2 px → 217 m (+72%)
−1.5 px → 53 m (+18%)
−1.7 px → 60 m (+20%)
Disclaimer/Publisher’s Note: The statements, opinions and data contained in all publications are solely those of the individual author(s) and contributor(s) and not of MDPI and/or the editor(s). MDPI and/or the editor(s) disclaim responsibility for any injury to people or property resulting from any ideas, methods, instructions or products referred to in the content.