Proceeding Paper

Using Low-Cost Gas Sensors in Agriculture: A Case Study †

ENEA—Italian National Agency for New Technologies, Energy and Environment, Research Center of Brindisi, SS. 7, Appia, km 706, 72100 Brindisi, Italy
Presented at the 11th International Electronic Conference on Sensors and Applications (ECSA-11), 26–28 November 2024; Available online: https://sciforum.net/event/ecsa-11.
Eng. Proc. 2024, 82(1), 74; https://doi.org/10.3390/ecsa-11-20503
Published: 26 November 2024

Abstract

The main goal of the POREM (LIFE17 ENV/IT/000333) project consisted in demonstrating the applicability of the treated poultry manure for soil restoration or bioremediation. To perform the research activities planned for the project, a considerable amount of poultry manure was stored in a large depot located in a rural, remote, and unattended area. The use of the manure implied the emissions of odors and gases that required continuous and real-time monitoring. This task could not be accomplished by placing expensive instrumentation in such a remote and unattended location, therefore, we have investigated the use of low-cost gas sensors for monitoring such poultry manure emissions. A portable monitoring unit mainly based on chemoresistive gas sensors was used to provide indications about the concentrations of NH3, CH4, H2S, and CO2. One of these devices was deployed in the manure storage depot, while the second one was deployed far from the storage site to compare the data related to the background environment with the measures coming out from the manure. Both the monitors were wirelessly linked to the internet, even though the radio signal was weak and swinging in that location. This situation gave us the opportunity to test a particular protocol to remotely control the devices based on sending and receiving e-mails containing commands for the remote machines. This experiment proved the feasibility of the use of low-cost devices in such particular environments, and data gathered seem to indicate that, if properly stored, gases and odors emitted by poultry manure have a limited impact on the air quality of the surrounding environment.

1. Introduction

The goal of the POREM (LIFE17 ENV/IT/000333) [1] project consisted in demonstrating the applicability of treated poultry manure for soil restoration or bioremediation. The use of this material originates gas and odor emissions that can cause annoyance in local communities [2,3,4], therefore, their monitoring can be required in some circumstances. Gas emission assessments are usually performed by chemical analyzers that offer high accuracy and precision, but are very expensive, maintenance demanding, and, they need significant infrastructure for their arrangement [5,6,7,8]. In recent years, low-cost gas sensors have been the object of research activities [9,10,11,12,13,14,15,16] proving that, although they are not featured by high accuracy, they can provide useful indications about the concentration levels of different gases [17,18,19,20,21]. Due to all these reasons, the monitoring of NH3, CH4, H2S, and CO2 during POREM project activities has been performed by the SentinAir device, which is a portable monitoring unit capable of managing a wide range of sensors and instruments. This device can perform real-time measurements and can be connected to the internet, enabling its complete remote control, and also data visualization and download [22,23]. The monitoring site is located in the rural area of Biccari, a little town in the South of Italy belonging to the Apulia region. As mentioned earlier, this activity is part of the POREM project and consists in monitoring gaseous emissions coming out from the poultry manure produced by a farm.

2. Materials and Methods
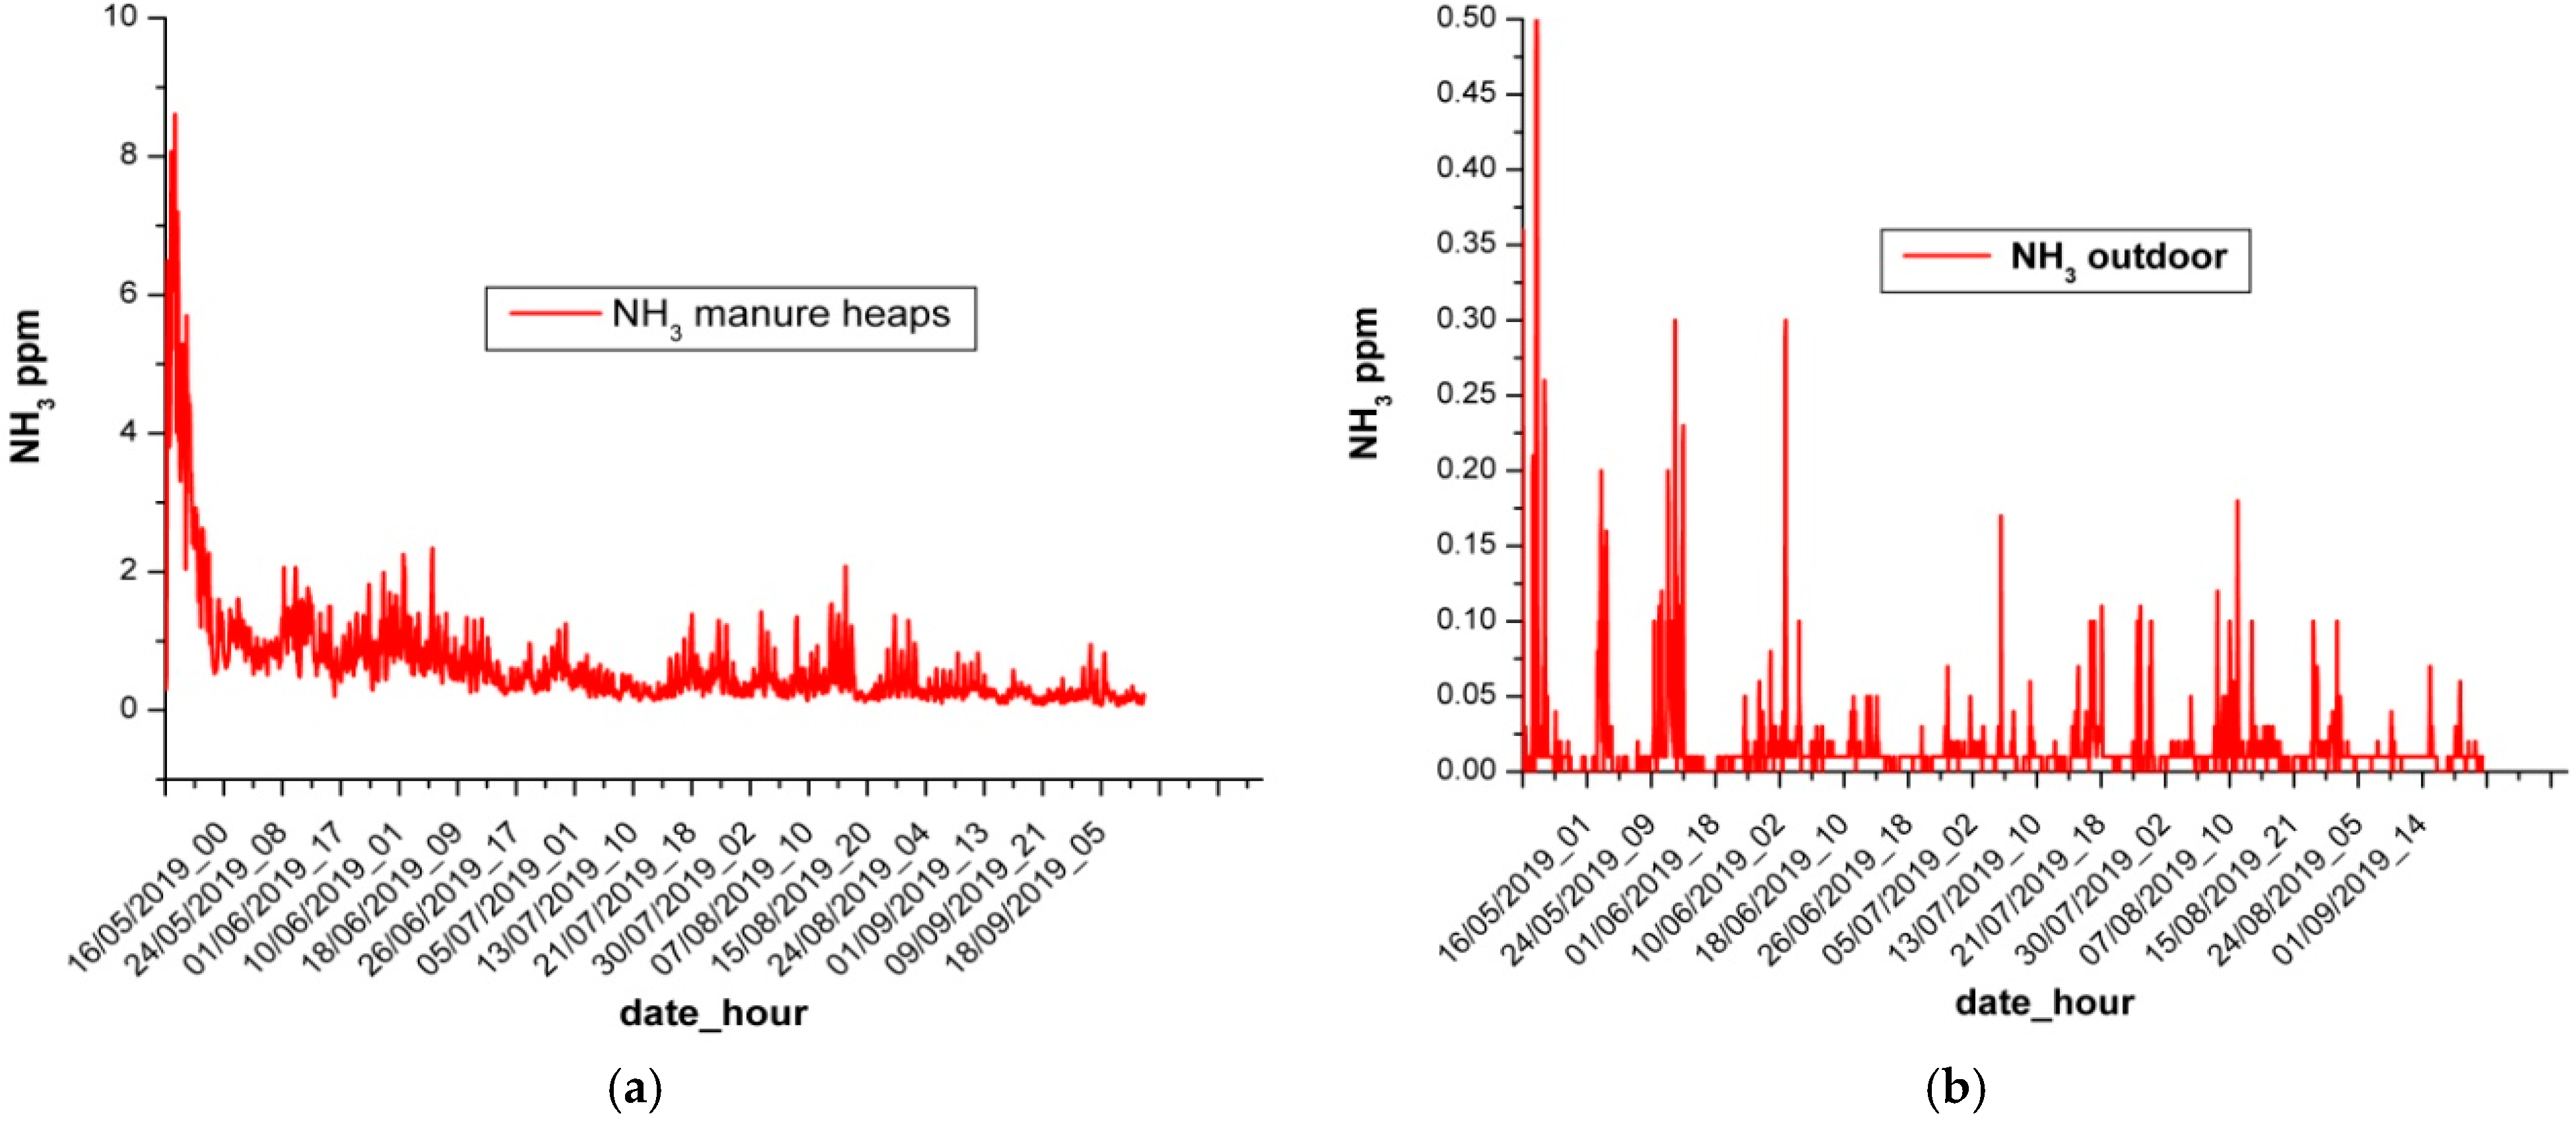
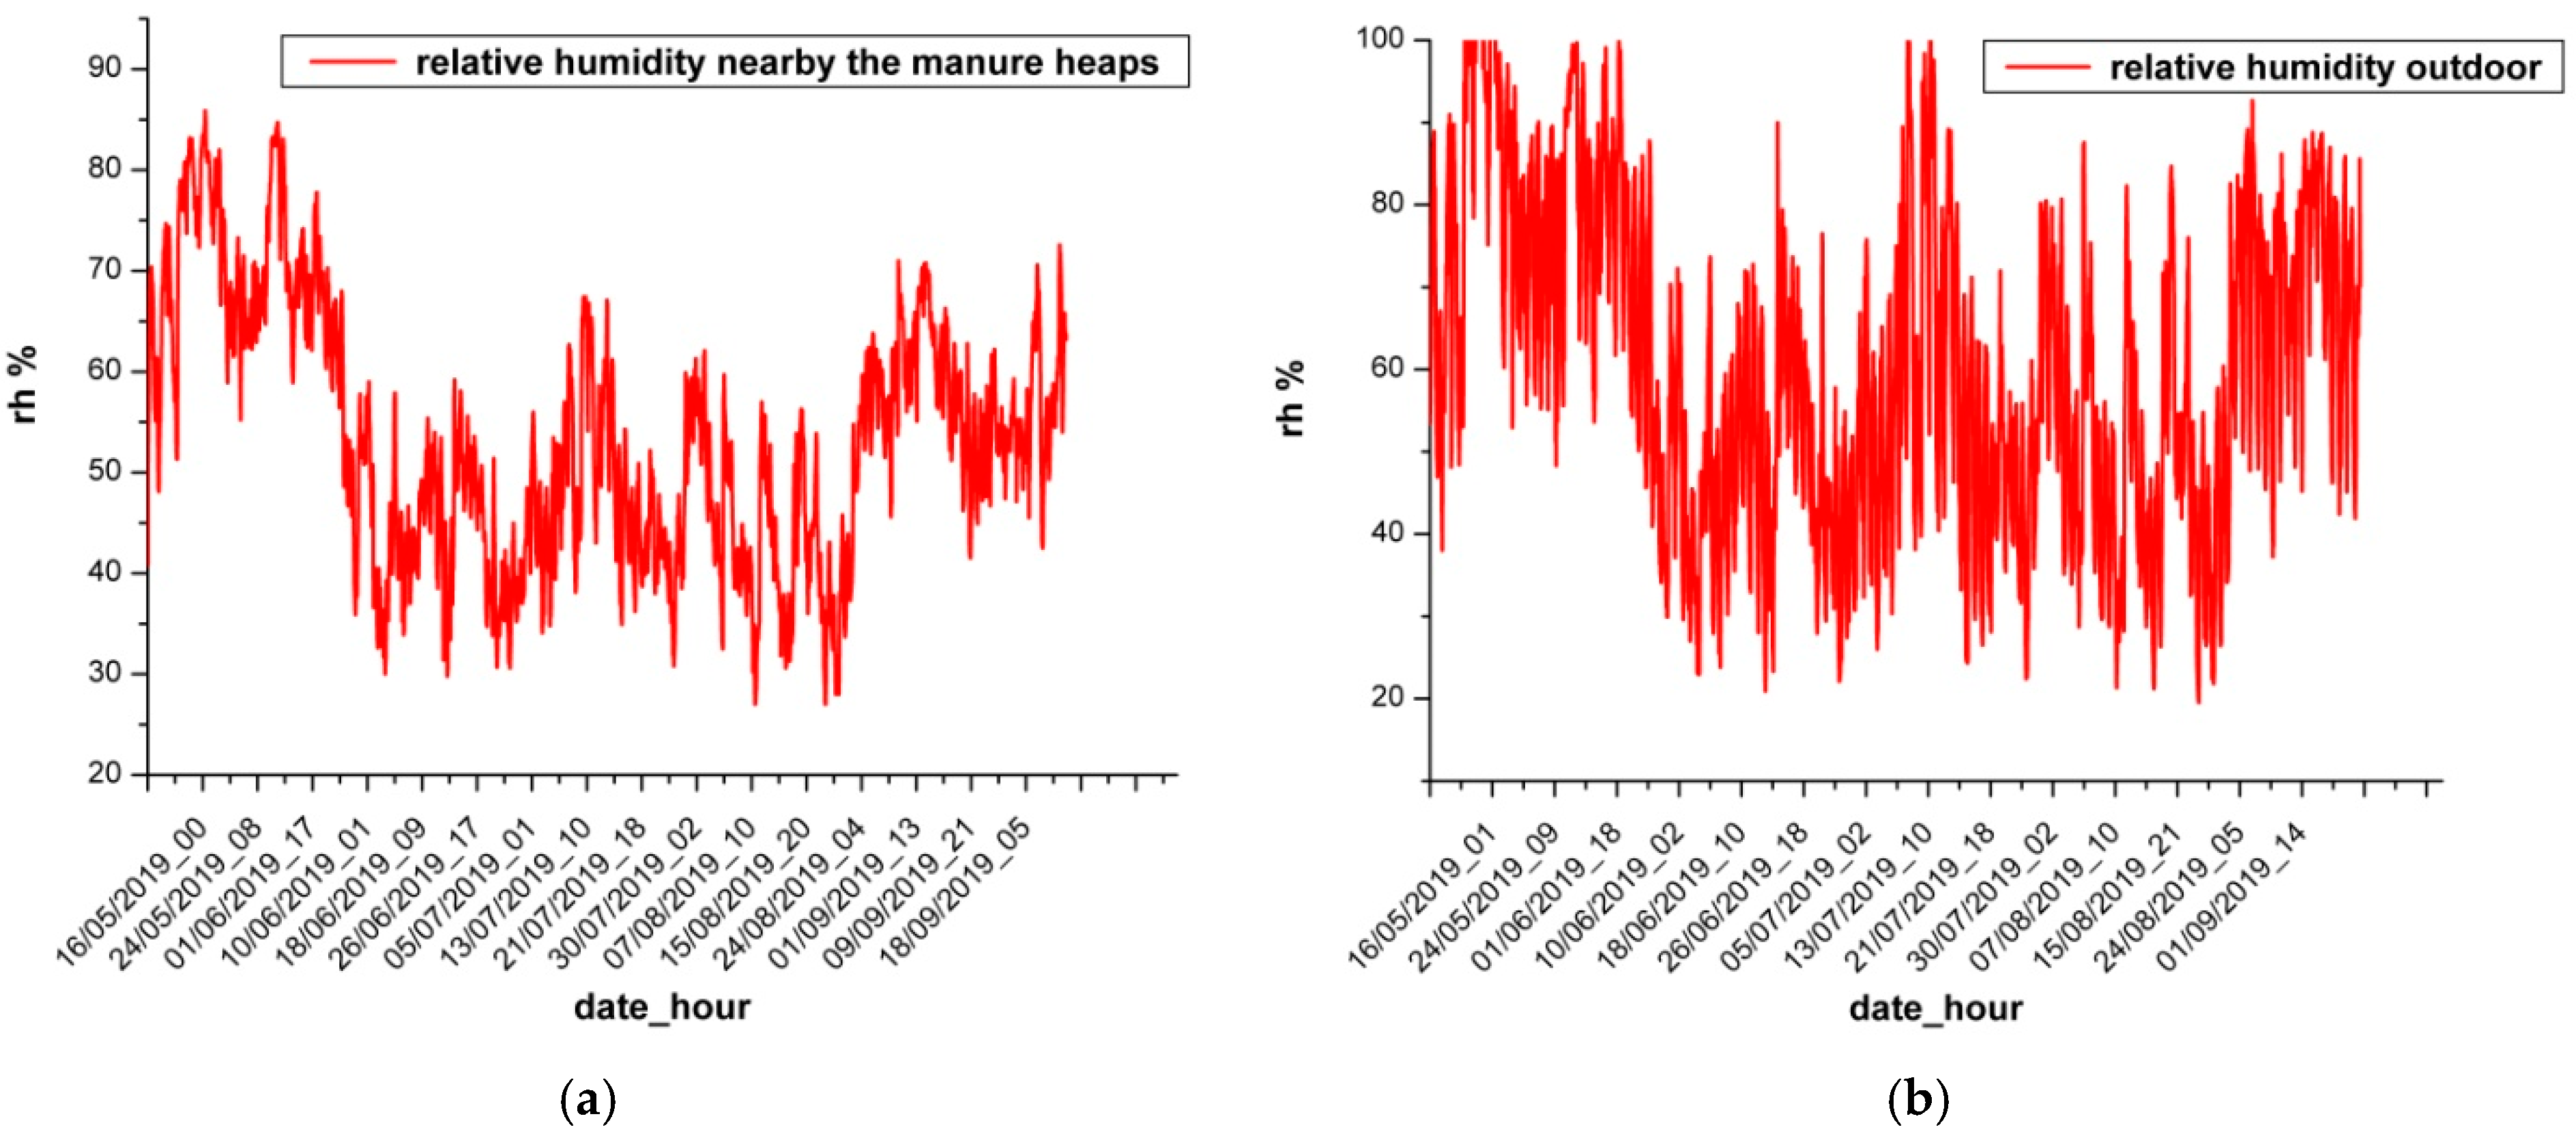
The SentinAir system aims to provide a flexible tool for managing a wide range of sensors and instruments for research purposes in uncomfortable environments, far from the laboratory facilities. It was built to replace expensive chemical analyzers due to budget issues. Considering the comparative and indicative nature of the investigation to carry out, the use of low-cost sensors to install on the SentinAir system proved to be a reasonable option compared with the use of professional and expensive instruments. The SentinAir hardware and software architecture is detailed in [22,23], while its assembly procedure has been exposed in [23]. Two copies of the SentinAir device were used to evaluate the impact of the emissions coming from the poultry manure stored in a depot. The storage site was a closed space which dimensions are 20 m × 15 m × 5 m. A set of windows placed just below the depot ceil provided the openings to the external environment. No forced ventilation system was used for the air exchange between the internal and the external space, therefore the airflow was ensured by leaving the windows open. In this way, the area available for natural ventilation was about 2.7 m2. The first SentinAir device was placed outside the depot, in a place 3 m high from the ground, while the second one was located very close to the manure heaps (about 1 m). As concerns the set of sensors mounted inside the monitors, they are summarized in Table 1.
The IRC-A1 sensor was available with an electronic board to support its operation capable of providing CO2 concentration expressed in “ppm” through its on-purpose USB output port. This sensor along with its electronic support board was calibrated by the manufacturer, while the other chemoresistive sensors were provided without an electronic board capable of giving the measurements of gas concentrations. Their outputs were analogic voltage signals reflecting the gas concentrations sensed by the sensors. For this reason, laboratory calibrations were necessary to use these sensors.
They were exposed to known gas concentrations and their output voltages were logged for determining the equations enabling them to convert their output voltage signals into gas concentration data. A set of linear equations were found to be reasonably useful for this purpose, and their coefficients were calculated by using the linear regression method.
The device placed in the depot was also equipped with a temperature probe to monitor the temperature trends inside the poultry manure heaps. The probe was built in the laboratory by using the TC 1047 A sensor and a steel pipe.
The total duration of the monitoring activities lasted more than three months, while the sampling rate of both the monitoring units was set to five minutes.

3. Results

The measurements carried out every five minutes were used by the two monitoring units to calculate the hourly averages of each monitored variable. They were useful to understand the fermentation process trend of the manure heaps and the impact of the poultry manure emissions outside the storage depot. The dataset obtained in this way is summarized in the plots of the time series concerning each measured parameter (see Figure 1, Figure 2, Figure 3, Figure 4, Figure 5, Figure 6 and Figure 7).

4. Discussion

Although it was not possible to gather data produced by professional instruments due to budget issues, anyway, useful indications arise from the comparison between the data monitored by the device placed close to the poultry manure and the one placed outside the manure storage depot. The main aspect that comes to light is represented by the fact that the H2S and NH3 concentrations detected inside and outside the manure depot differ by roughly one magnitude order (see Figure 4 and Figure 5). This element is more evident during the first days of the experiment when the poultry manure was freshly stored. During this period, the H2S and NH3 maximum concentrations close to the manure heaps were respectively 20 ppm and 8.6 ppm, while the maximum concentrations measured far from the manure were 0.5 ppm. Concerning the CO2 emissions, it can be noted (see Figure 3) that its concentration close to the manure was always higher than the one detected far from it. As for H2S and NH3, most of the emissions occurred during the first days of the monitoring activity. The methane concentrations represent a particularity in the observed data: its concentration close to the manure was constantly higher than the one featuring the external environment by one magnitude order, but no peak was observed during the first days, as in the case of the other gaseous emissions (see Figure 6). Another interesting element of the dataset acquired during this experience is represented by the time series of the temperature inside the manure heaps detected by the probe built in our laboratory. Its plot is shown in Figure 1, where we can observe a peak during the first seven days, indicating that the fermentation process was active mostly during that period. This element is even more evident if we consider that during this phase the temperature inside the manure heaps was continually above 50°C (with a peak of 75°C), while the temperature detected in the depot ranged from 14 m°C to 23°C (see Figure 2). Data related to the relative humidity are plotted in Figure 7. As expected, the relative humidity detected outdoor is featured by a wide variability, while the range of values detected close to the manure is more limited.

5. Conclusions

A cost-effective, portable monitoring unit has been designed and developed for the use of low-cost sensors to employ in uncomfortable or harsh environments. The indication coming out from this experience leads us to conclude that, although the chemical analyzers provide more accurate measurements, the use of low-cost technologies, and in particular the chemoresistive gas sensors, can be effectively adopted for comparative or indicative studies. We have shown that in circumstances where expensive chemical analyzers must be left in remote, uncomfortable, and unattended places, the SentinAir device and the chemoresistive gas sensors could be a valid option. Its effectiveness has been proved in a particular case study related to agriculture activities. More specifically, the results arising from this experience seem to indicate that the gaseous emissions of poultry manure are mainly concentrated in the first ten days; therefore, if properly stored before its use, its emission impacts on the air quality of the surrounding environment is significantly limited. This factor is of remarkable importance in situations where farming activities are a concern for communities dwelling in their close vicinities.

Funding

This work was supported by funds of POREM (“Poultry manure based bio-activator for better soil management through bioremediation”) project co-funded by EU, within the LIFE program (LIFE17/ENV/IT/333).

Institutional Review Board Statement

Not applicable.

Informed Consent Statement

Not applicable.

Data Availability Statement

Data will be provided by contacting the author.

Acknowledgments

A special thanks to Gennaro Cassano for his support in the realization of this experiment.

Conflicts of Interest

The author declares no conflict of interest.

References

  1. POREM Project Webpage. Available online: https://webgate.ec.europa.eu/life/publicWebsite/project/LIFE17-ENV-IT-000333/poultry-manure-based-bioactivator-for-better-soil-management-through-bioremediation (accessed on 28 June 2024).
  2. Schauberger, G.; Piringer, M.; Petz, E. Separation distance to avoid odour nuisance due to livestock calculated by the Austrian odour dispersion model (AODM). Agric. Ecosyst. Environ. 2001, 87, 13–28. [Google Scholar] [CrossRef]
  3. Von Essen, S.G.; Auvermann, B.W. Health effects from breathing air near CAFOs for feeder cattle or hogs. J. Agromed. 2005, 10, 55–64. [Google Scholar] [CrossRef] [PubMed]
  4. Akter, S.; Cortus, E.L. Comparison of Hydrogen Sulfide Concentrations and Odor Annoyance Frequency Predictions Downwind from Livestock Facilities. Atmosphere 2020, 11, 249. [Google Scholar] [CrossRef]
  5. Mead, M.I.; Popoola, O.A.; Stewart, G.B.; Landshoff, P.; Calleja, M.; Hayes, M.; Baldovi, J.J.; McLeod, M.W.; Hodgson, T.F.; Dicks, J.; et al. The use of electrochemical sensors for monitoring urban air quality in low-cost, high-density networks. Atmos. Environ. 2013, 70, 186–203. [Google Scholar] [CrossRef]
  6. Castell, N.; Dauge, F.R.; Schneider, P.; Vogt, M.; Lerner, U.; Fishbain, B.; Broday, D.; Bartonova, A. Can commercial low-cost sensor platforms contribute to air quality monitoring and exposure estimates? Environ. Int. 2017, 99, 293–302. [Google Scholar] [CrossRef] [PubMed]
  7. Kumar, P.; Morawska, L.; Martani, C.; Biskos, G.; Neophytou, M.; Di Sabatino, S.; Bell, M.; Norford, L.; Britter, R. The rise of low-cost sensing for managing air pollution in cities. Environ. Int. 2015, 75, 199–205. [Google Scholar] [CrossRef] [PubMed]
  8. Snyder, E.G.; Watkins, T.H.; Solomon, P.A.; Thoma, E.D.; Williams, R.W.; Hagler, G.S.; Shelow, D.; Hindin, D.A.; Kilaru, V.J.; Preuss, P.W. The changing paradigm of air pollution monitoring. Environ. Sci. Technol. 2013, 47, 11369–11377. [Google Scholar] [CrossRef] [PubMed]
  9. Penza, M.; Rossi, R.; Alvisi, M.; Aversa, P.; Cassano, G.; Suriano, D.; Benetti, M.; Cannata, D.; Di Pietrantonio, F.; Verona, E. SAW Gas Sensors with Carbon Nanotubes Films. In Proceedings of the 2008 IEEE Ultrasonics Symposium, Beijing, China, 2–5 November 2008; pp. 1850–1853. [Google Scholar]
  10. Trizio, L.; Brattoli, M.; De Gennaro, G.; Suriano, D.; Rossi, R.; Alvisi, M.; Cassano, G.; Pfister, V.; Penza, M. Application of artificial neural networks to a gas sensor-array database for environmental monitoring. In Sensors and Microsystems; Springer: Boston, MA, USA, 2012; pp. 139–144. [Google Scholar]
  11. D’Urso, P.R.; Arcidiacono, C.; Cascone, G. Assessment of a Low-Cost Portable Device for Gas Concentration Monitoring in Livestock Housing. Agronomy 2023, 13, 5. [Google Scholar] [CrossRef]
  12. Tryner, J.; Phillips, M.; Quinn, C.; Neymark, G.; Wilson, A.; Jathar, S.H.; Carter, E.; Volckens, J. Design and testing of a low-cost sensor and sampling platform for indoor air quality. Build. Environ. 2021, 206, 108398. [Google Scholar] [CrossRef] [PubMed]
  13. Janke, D.; Bornwin, M.; Coorevits, K.; Hempel, S.; van Overbeke, P.; Demeyer, P.; Rawat, A.; Declerck, A.; Amon, T.; Amon, B. A Low-Cost Wireless Sensor Network for Barn Climate and Emission Monitoring—Intermediate Results. Atmosphere 2023, 14, 1643. [Google Scholar] [CrossRef]
  14. Zhang, H.; Srinivasan, R.; Ganesan, V. Low Cost, Multi-Pollutant Sensing System Using Raspberry Pi for Indoor Air Quality Monitoring. Sustainability 2021, 13, 370. [Google Scholar] [CrossRef]
  15. Demanega, I.; Mujan, I.; Singer, B.C.; Anđelković, A.S.; Babich, F.; Licina, D. Performance assessment of low-cost environmental monitors and single sensors under variable indoor air quality and thermal conditions. Build. Environ. 2021, 187, 107415. [Google Scholar] [CrossRef]
  16. Wei, P.; Ning, Z.; Ye, S.; Sun, L.; Yang, F.; Wong, K.C.; Westerdahl, D.; Louie, P.K.K. Impact Analysis of Temperature and Humidity Conditions on Electrochemical Sensor Response in Ambient Air Quality Monitoring. Sensors 2018, 18, 59. [Google Scholar] [CrossRef] [PubMed]
  17. Suriano, D.; Gennaro, C.; Penza, M. A Portable Sensor System for Air Pollution Monitoring and Malodours Olfactometric Control. Lect. Notes Electr. Eng. 2012, 109, 87–92. [Google Scholar]
  18. Suriano, D.; Cassano, G.; Penza, M. Design and Development of a Flexible, Plug-and-Play, Cost-Effective Tool for on-Field Evaluation of Gas Sensors. J. Sens. 2020, 2020, 8812025. [Google Scholar] [CrossRef]
  19. Karagulian, F.; Barbiere, M.; Kotsev, A.; Spinelle, L.; Gerboles, M.; Lagler, F.; Redon, N.; Crunaire, S.; Borowiak, A. Review of the Performance of Low-Cost Sensors for Air Quality Monitoring. Atmosphere 2019, 10, 506. [Google Scholar] [CrossRef]
  20. Zimmerman, N.; Presto, A.A.; Kumar, S.P.N.; Gu, J.; Hauryliuk, A.; Robinson, E.S.; Robinson, A.L.; Subramanian, R. A machine learning calibration model using random forests to improve sensor performance for lower-cost air quality monitoring. Atmos. Meas. Tech. 2018, 11, 291–313. [Google Scholar] [CrossRef]
  21. Bigi, A.; Mueller, M.; Grange, S.K.; Ghermandi, G.; Hueglin, C. Performance of NO, NO2 low cost sensors and three calibration approaches within a real world application. Atmos. Meas. Tech. 2018, 11, 3717–3735. [Google Scholar] [CrossRef]
  22. Suriano, D. SentinAir system software: A flexible tool for data acquisition from heterogeneous sensors and devices. SoftwareX 2020, 12, 100589. [Google Scholar] [CrossRef]
  23. Suriano, D. A portable air quality monitoring unit and a modular, flexible tool for on-field evaluation and calibration of low-cost gas sensors. HardwareX 2021, 9, e00198. [Google Scholar] [CrossRef] [PubMed]
Figure 1. Time series of the temperature measured inside the poultry manure heaps.
Engproc 82 00074 g001
Figure 2. Time series of the temperature measured very close to the manure heaps (a), and outside the depot (b).
Engproc 82 00074 g002
Figure 3. Time series of the CO2 concentration measured very close to the manure heaps (a), and outside the depot (b).
Engproc 82 00074 g003
Figure 4. Time series of H2S concentration measured very close to the manure heaps (a), and outside the depot (b).
Engproc 82 00074 g004
Figure 5. Time series of NH3 concentration measured very close to the manure heaps (a), and outside the depot (b).
Engproc 82 00074 g005
Figure 6. Time series of CH4 concentration measured very close to the manure heaps (a), and outside the depot (b).
Engproc 82 00074 g006
Figure 7. Time series of the relative humidity measured very close to the manure heaps (a), and outside the depot (b).
Engproc 82 00074 g007
Table 1. Sensors used in the SentinAir monitors.
SensorParameterTypeManufacturer
IRC-A1CO2NDIRAlphasense (Braintree, UK)
TGS 825H2SchemoresistiveFigaro (Rolling Meadows, IL, USA)
TGS 826NH3chemoresistiveFigaro (Rolling Meadows, IL, USA)
TGS 2611CH4chemoresistiveFigaro (Rolling Meadows, IL, USA)
HIH 5031RHcapacitiveHoneywell (Charlotte, NC, USA)
TC 1047 A 1TtermoresistiveMicrochip (Chandler, AZ, USA)
1 this sensor was mounted inside the monitors to measure ambient temperature, and also in the probe.
Disclaimer/Publisher’s Note: The statements, opinions and data contained in all publications are solely those of the individual author(s) and contributor(s) and not of MDPI and/or the editor(s). MDPI and/or the editor(s) disclaim responsibility for any injury to people or property resulting from any ideas, methods, instructions or products referred to in the content.

