Proceeding Paper

Advances, Benefits, and Challenges of Wearable Sensors for Healthcare and Stress Management: A Focus on Hemodynamic Parameters and Cortisol Measurement †

by
Georgios V. Taskasaplidis
1,*,
Konstantinos A. Liogas
2,
Alexander M. Korsunsky
2,
Dimitris A. Fotiadis
1,* and
Panagiotis D. Bamidis
3
1
Informatics Department, School of Sciences, University of Western Macedonia, 52100 Kastoria, Greece
2
Department of Engineering Science, University of Oxford, Parks Road, Oxford OX1 3PJ, UK
3
School of Medicine, Aristotle University of Thessaloniki, 54124 Thessaloniki, Greece
*
Authors to whom correspondence should be addressed.
Presented at the 11th International Electronic Conference on Sensors and Applications (ECSA-11), 26–28 November 2024; Available online: https://sciforum.net/event/ecsa-11.
Eng. Proc. 2024, 82(1), 42; https://doi.org/10.3390/ecsa-11-20492
Published: 26 November 2024

Abstract

:
Stress has multiple effects on human health. Sensors designed to measure stress and indicate health status by recognizing illnesses or other conditions (e.g., heart problems and blood pressure) have been widely utilized to monitor and characterize this physiological phenomenon. Stress has two response mechanisms: the autonomic nervous system (ANS) and the hypothalamic–pituitary–adrenal (HPA) axis. The ANS can affect heart rate, breathing rate, skin conductance, blood pressure, and other hemodynamic parameters. Continuous non-invasive blood pressure (cNIBP) measurement, pulse volume, cardiac output, and other hemodynamic parameters are important for stress measurement and health indicators. There is still room for research and the development of different approaches to measurement in this area. Very few sensor systems associated with cNIBP have been developed or are currently in progress. Photoplethysmography (PPG), impedance plethysmography (IPG), and ultrasound imaging were performed along with other non-invasive sensors, such as electrocardiography (ECG), cardioseismography (CSG), and ballistocardiography (BCG), to measure hemodynamic parameters. In the HPA axis, stress hormones are the most important measurement from the perspective of cortisol levels. This measurement is also important in general for the health of the subject, especially for good functioning of the axis itself (HPA axis). Sensors have been developed to detect cortisol levels for academic and research purposes. Cortisol levels can be measured in two ways: direct and indirect hormone measurements. Non-invasive direct hormone measurement uses a sensor to evaluate the cortisol levels in sweat. In contrast, indirect measurement uses the increase or decrease in cortisol levels in relation to other substances such as sodium or potassium. Therefore, in the present study, we investigated technologies, methods, and wearable sensors for continuous hemodynamic measurements at the ANS level and cortisol measurements at the HPA axis level. These sensors and measurements are crucial for improving healthcare applications.

1. Introduction

Health and stress in the modern age of excessive anxiety have become conceptually linked. Chronic stress is considered the culprit for many diseases such as hypertension, heart dysfunction, metabolic syndrome, obesity, diabetes, arthritis, and many others. Wearable systems (sensors and devices) for daily use to monitor stress and health indicators are constantly under development, usually in the form of a watch, ring, jewelry, locket necklace, band, or patch.
Stress is related to and reacts via two mechanisms (see Figure 1): the autonomic nervous system (ANS) and the hypothalamus–pituitary–adrenal axis (HPA axis). The ANS comprises the sympathetic nervous system (SNS) and parasympathetic nervous system (PNS), which are antagonistic systems. The SNS is the “active stress” mode and the PNS is the “after stress” mode. The first irritates the body (e.g., increases heart rate, blood pressure, and breathing rate), and the second calms it down (e.g., decreases heart rate, blood pressure, and breathing rate). Regarding the HPA axis, that is, at the hormonal level, in the case of stress and the need to react to it, the hormone cortisol, known by the nickname “the stress hormone”, is mainly secreted. Cortisol interferes with the metabolism and balances electrolytes and other processes, thereby providing the body with energy, strength, and appropriate supplies for coping with stressful situations. These two mechanisms are interrelated; they interact with each other, and ideally, for a complete picture of stress and health, should both be monitored.
Wearable sensors and methods for noninvasive blood pressure (NIBP) measurements have been developed and are being developed. In addition to NIBP, other methods and theories estimate various hemodynamic measurements such as stroke volume (SV), cardiac output (CO), and arterial stiffness. On the HPA axis, transducers with nucleic acid aptamers and enzymes (natural or artificial) can be used to bid cortisol, thereby measuring the concentration of the hormone in an analyte. Alternatively, ion transducers that can measure sodium and potassium concentration changes in an analyte can do the same (cortisol causing these changes). All these sensors, calculations, and measurements can offer a general picture of health, as well as a more thorough picture of the cardiovascular system and HPA axis function.
In this paper, the analysis and presentation of sensors, methods, and corresponding theories were performed. A literature search was conducted in the fields of hemodynamics and the HPA axis for possible measurements. This becomes the path that can be followed to obtain these estimates and measurements. The benefits they offer when applied in everyday life are demonstrated in addition, to how close and feasible are such capabilities in terms of the fabrication and use of wearables, and what are the principal problems and difficulties. Suggestions are made, directions and insights are provided, and solutions are proposed.
The work consists (in addition to the abstract and introduction) of three sections that present the technologies, methods, and mathematical formulas for measuring blood pressure and other hemodynamic parameters (Section 2); the ways, technologies, and methods of measuring cortisol produced by the HPA axis, also called “stress hormone” (Section 3); and finally, the discussion and conclusions (Section 4).

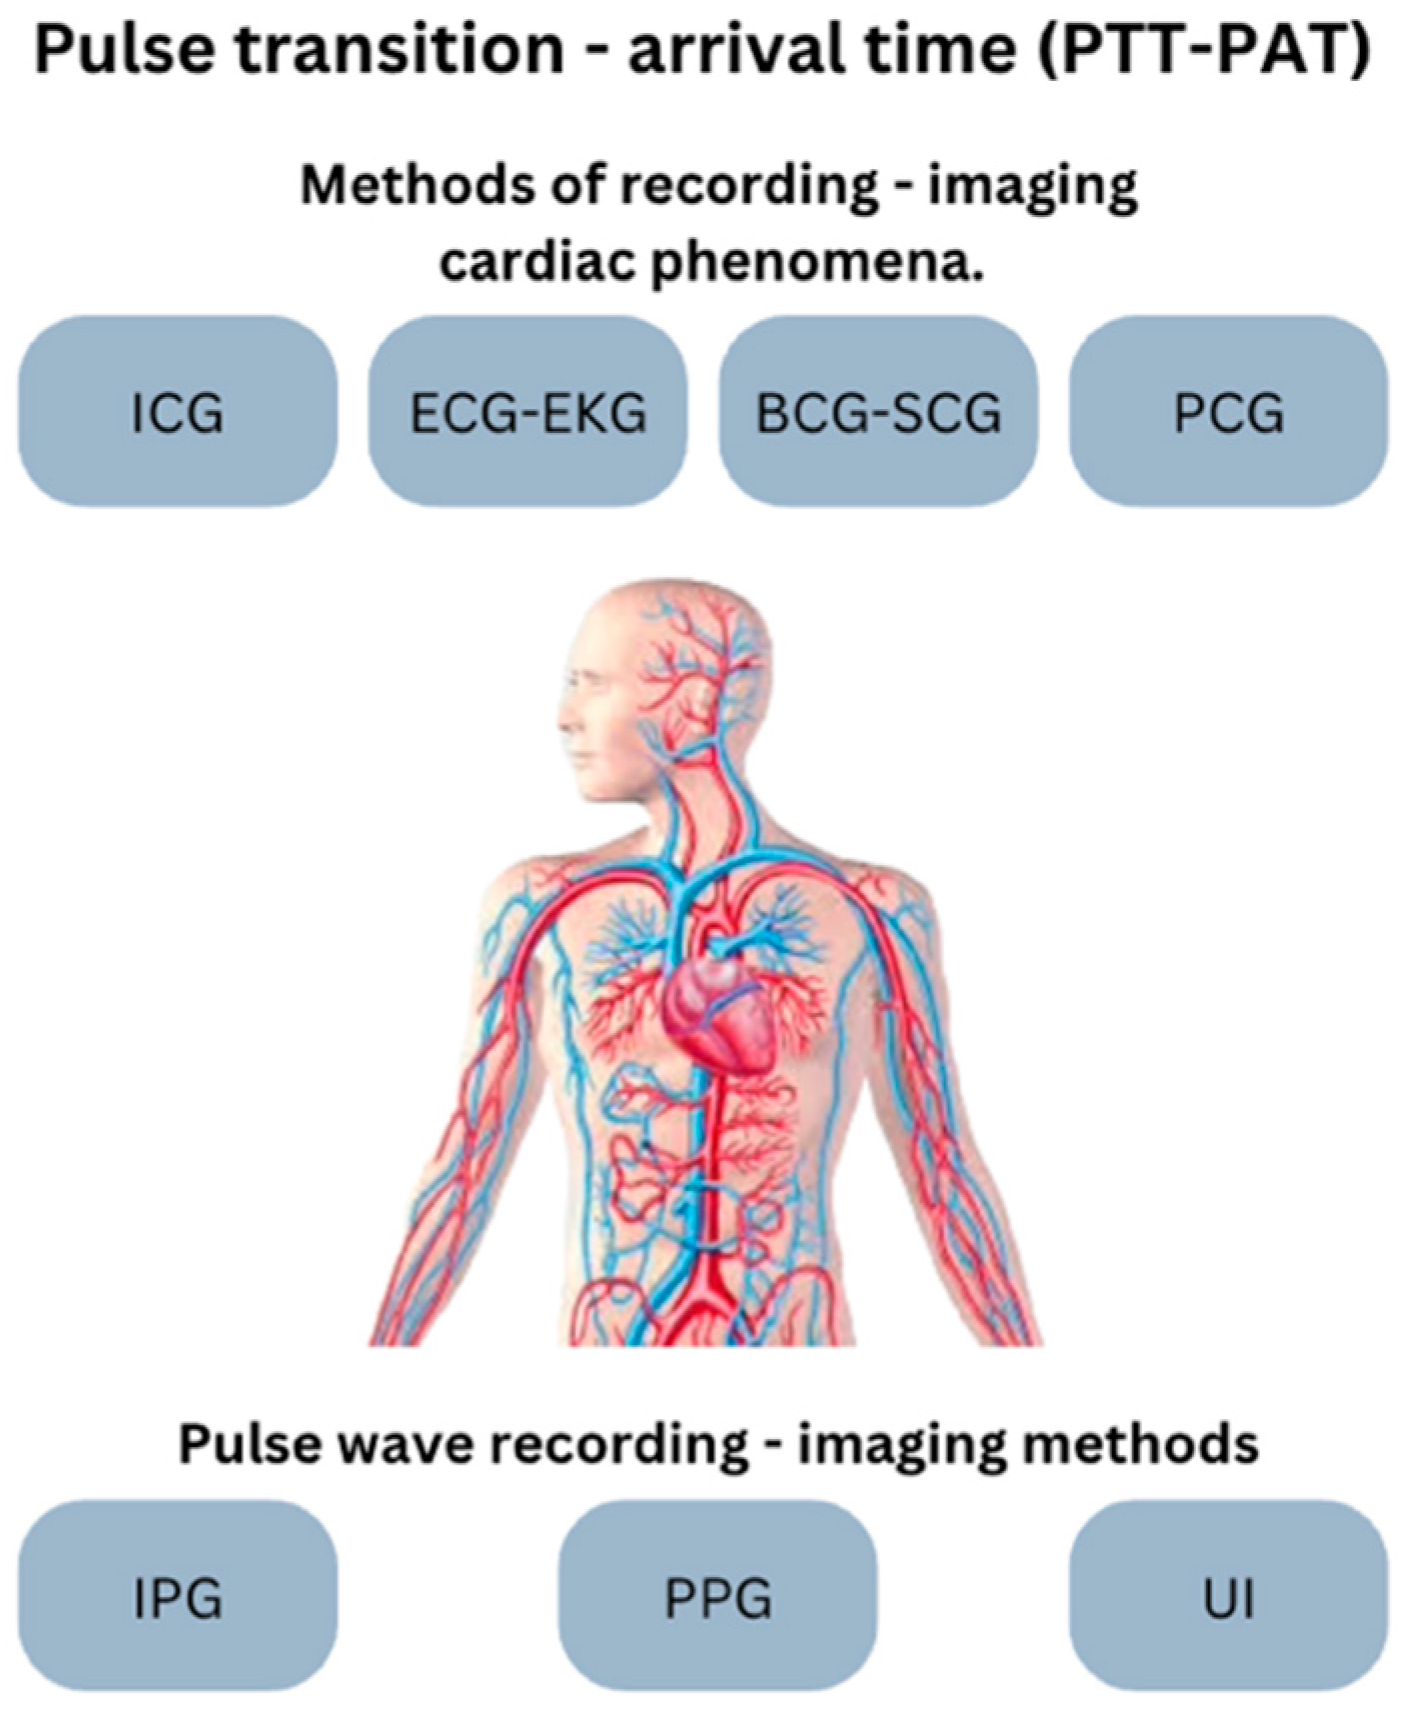
2. Continuous Noninvasive Blood Pressure (cNIBP)—Hemodynamics

The monitoring of at least some hemodynamic parameters is important, especially when it is continued and the device is noninvasive. Some hemodynamic factors are closely related, and often, some measurements, mathematical formulas–equations, calculations, and estimations can provide results. Hence, we need to know and familiarize ourselves with the following concepts and mathematical formulas.
Pulse wave velocity (PWV) is typically calculated using the common mathematical formula of velocity (V = d/t), which is PWV = ΔL/ΔT, where ΔL is the distance between two measuring sites and ΔT is the pulse transit time (PTT) between the two sites.
A simple blood pressure (BP) formula is P = α PWV 2 + β for human arteries, where α and β are constants that depend on the arteries and other body parameters [1].
Pulse pressure (PP) equals the mean systolic blood pressure (SBP) minus the mean diastolic blood pressure (DBP).
Stroke volume (SV) equals PP (SBP-DBP) divided by the sum of SBP and DBP, and SV multiplied by HR derives an estimate of cardiac output (CO) [2].
The above formulas serve as estimations and provide adequate measurements, particularly when other methods are unavailable. These findings have several clinical implications. Under critical conditions, medical precision equipment and measurements are required. However, for daily 24/7 continuous measurements with relative accuracy and for monitoring changes in various hemodynamic parameters, this is a fairly good solution.

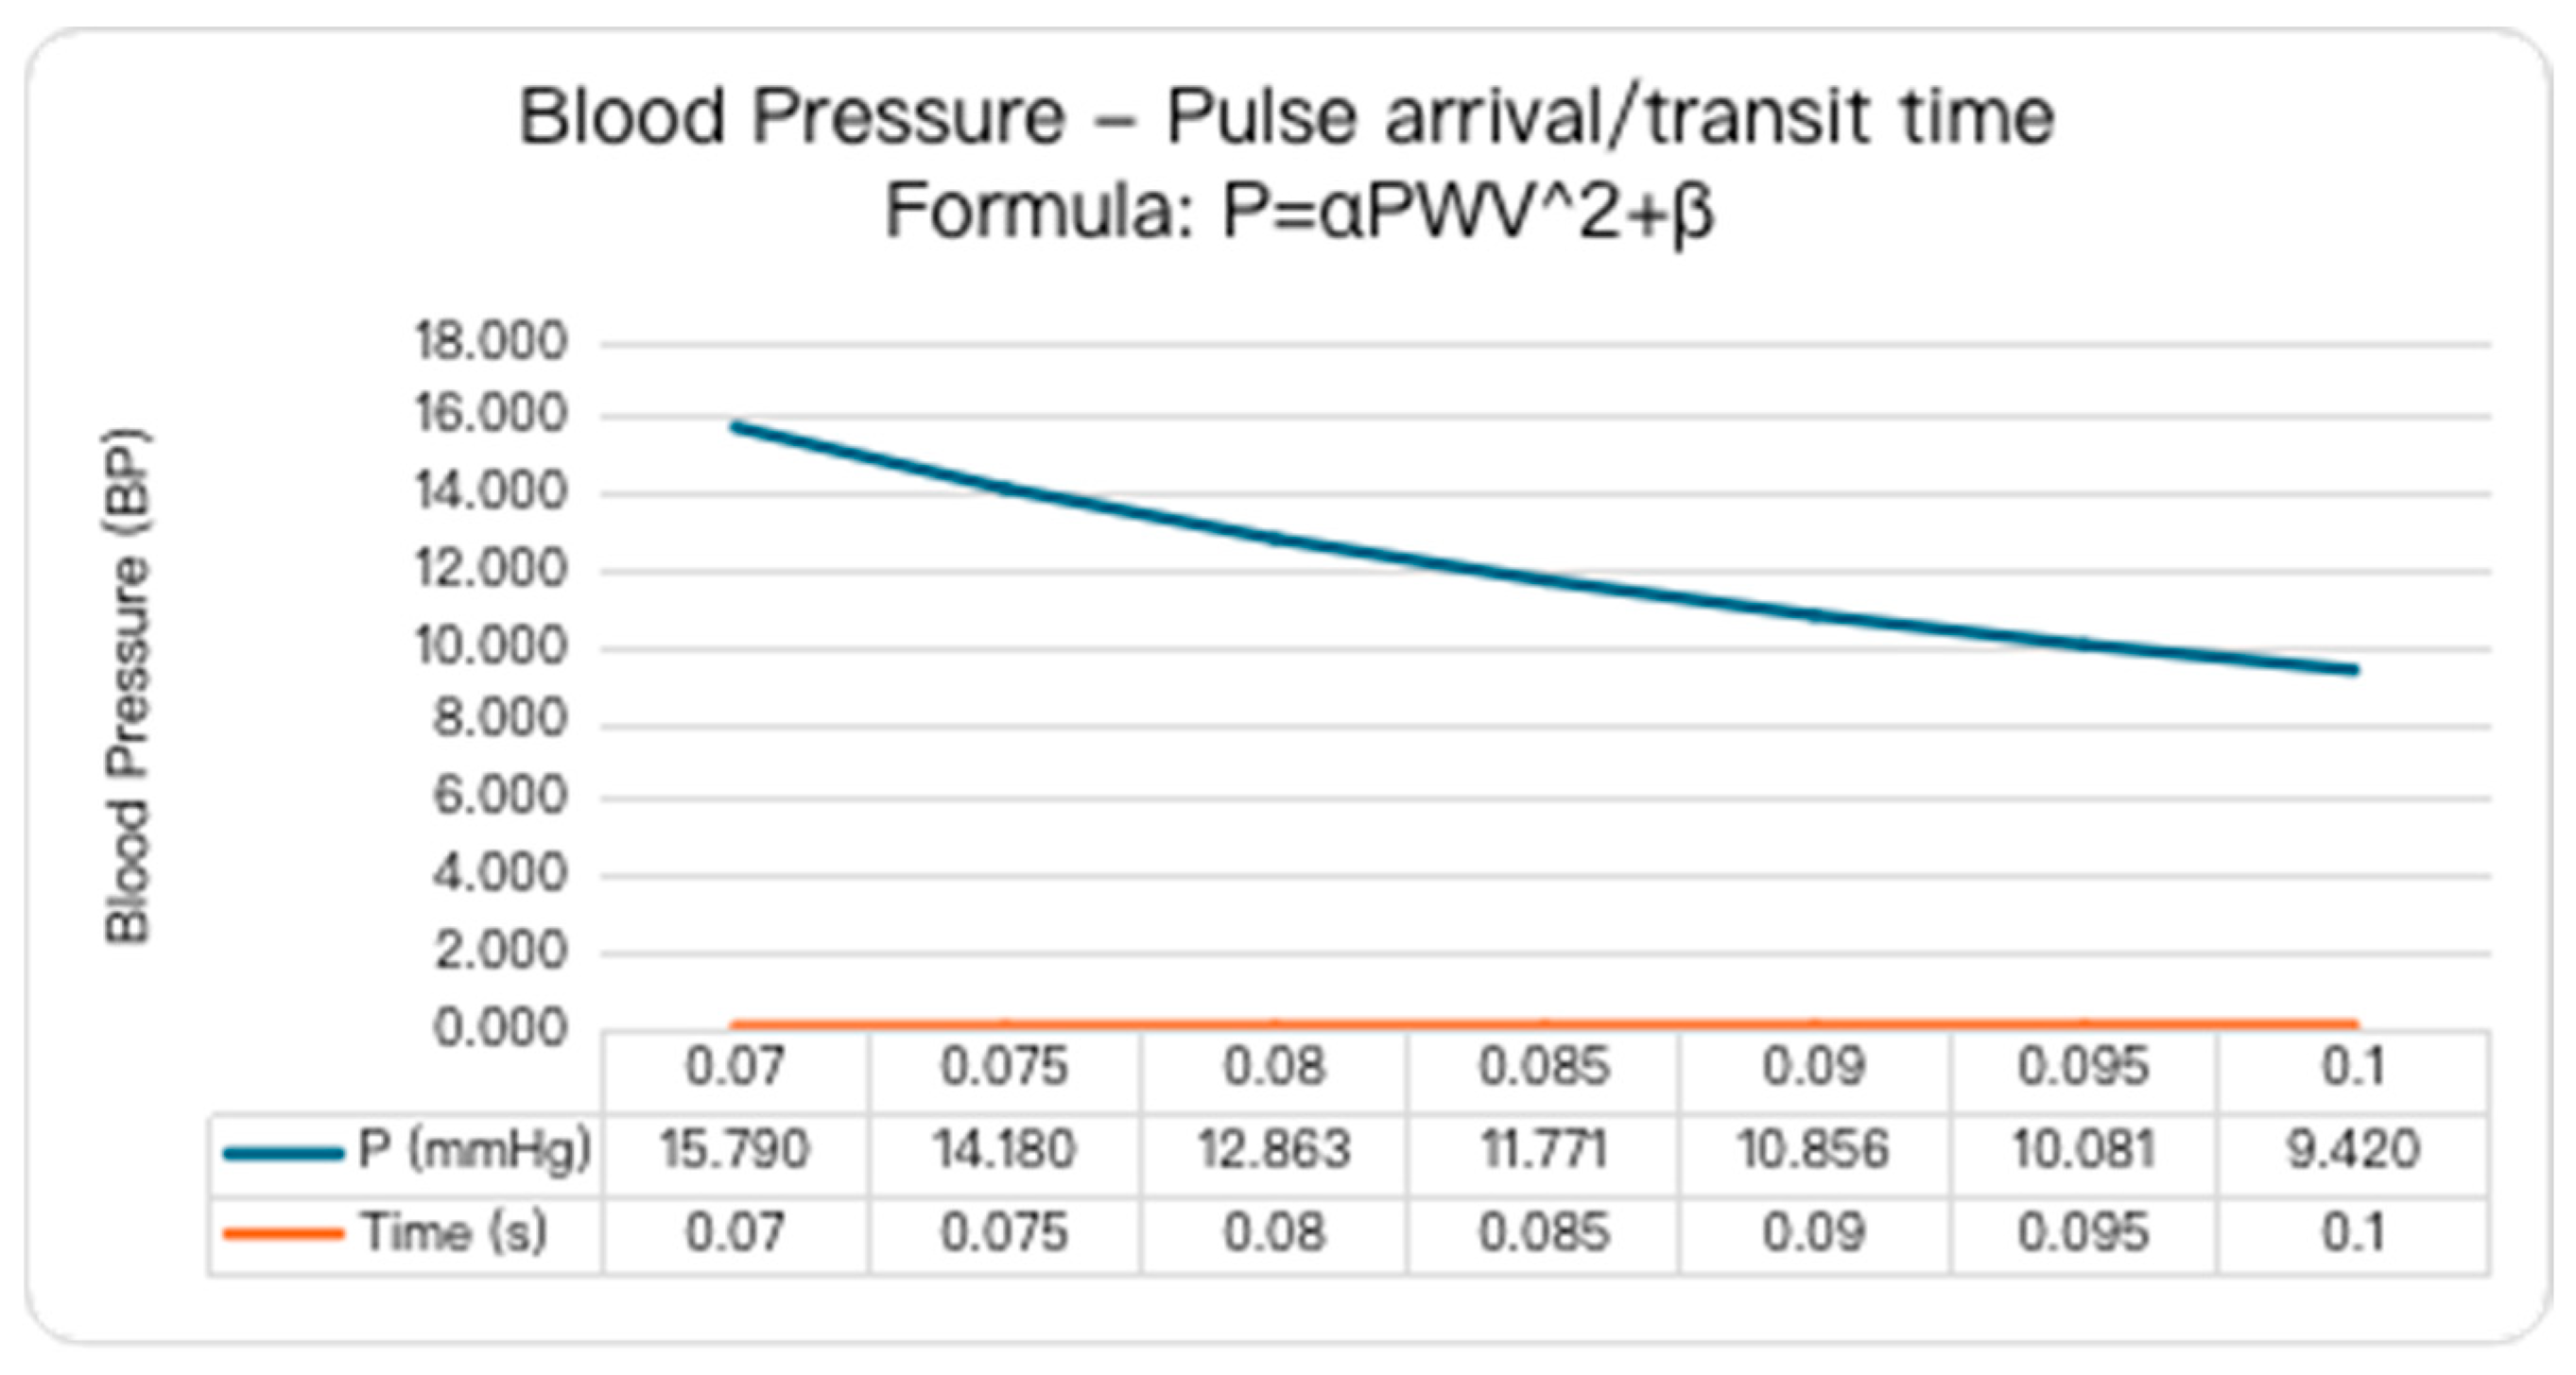
2.1. Blood Pressure Estimation

From the above, the conclusion is that the measurement of blood pressure requires pulse wave velocity (PWV) measurement. PWV is also correlated with atherosclerosis and arterial stiffness [3]. PWV equals ΔL/ΔT. Hence, the pulse transit time between the two sites is very important (the length is constant). Therefore, the two reference points must be identified. A reference point can be the heart itself or some phenomenon of the heart’s function (electrical or mechanical) and the terminal in an artery at a point in the body (e.g., chest, neck, or limbs). These can also be the two points of an artery (PTT) or the reflected wave transit time (RWTT). The measurement of time starting from the electrical activity of the heart (e.g., the R peak on the electrocardiogram (ECG)) is called the pulse arrival time (PAT) and pulse wave transit time (PWTT). PAT includes the heart pre-ejection period (PEP) and pulse transit time (PTT) (see Figure 2). In addition, the pulse wave transit time during exercise testing reflects the severity of heart disease in cardiac patients [4]. Furthermore, the reflected wave transit time (RWTT) has been a prediction marker of cardiovascular mortality in the general population [5].
The methods and sensors corresponding to these methods were as follows: heart phenomena: electrocardiography (ECG), impedance cardiography (ICG), seismocardiography (SCG), ballistocardiography (BCG), and phonocardiography (PCG); arterial pulse phenomena: photoplethysmography (PPG), impedance plethysmography (IPG), and ultrasound imaging (UI). Of the aforementioned methods of monitoring and/or imaging cardiac and arterial activity and physiology, photoplethysmography (PPG), impedance plethysmography (IPG), ultrasound imaging (UI), or a combination of these are necessary for pulse transition–arrival time (PAT-PTT) measurements. For example, two synchronized PPG sensors alone (at the top and bottom of the arm or with some space between them) can perform PTT measurements [6]. Table 1 lists the characteristics of all methods.
By applying the mathematical formula ( P = α PWV 2 + β ) and placing constant values and the time (ΔT), which is the only variable parameter (PWV = ΔL/ΔT where length is constant), within the normal limits of 5–15 m/s (mean time of approximately 0.1 s/m) [7], a graphical representation of blood pressure related to time (or velocity) is shown in Figure 3. Usually, the pressure is initially measured multiple times (usually three times) using conventional high-precision blood pressure devices (e.g., in the upper arm and with a stethoscope) and is recorded in almost all wearable blood pressure devices by calculation and estimation. Thus, the blood pressure is mapped to the pulse wave velocity and pulse transit-arrival time measured by the sensor. Theoretically, in this way, but also with the use of machine learning (artificial intelligence), which, with the right guidance, has the ability to self-learn, find patents, trends, and insights, estimating and calculating blood pressure is possible (see also Figure 4).

2.1.1. Photoplethysmography (PPG)

Photoplethysmography (PPG) is an optical technique used to detect changes in blood volume in the peripheral circulation and can also show blood flow changes graphically. The PPG device measures the degree of light absorption by the blood, and variations in the blood flow volume differ in light absorption. Thus, heartbeats can be measured when the produced pulse wave reaches the measurement point. The pulse transit time (PTT) and reflected wave transit time (RWTT) can be measured using PPG. The pulse arrival time (PAT) can also be measured if electrocardiography (ECG) is available. This technique is promising for blood pressure estimation, arterial stiffness [8] assessment, and blood glucose estimation [9,10,11].

2.1.2. Impedance Plethysmography (IPG)

This technique (among others) is also used to detect blood volume changes in a body segment (a power source and two electrodes are required). The impedance of a body segment changes when the blood flow volume increases or decreases. Thus, with IPG, heartbeats can be measured, and blood flow fluctuations can be shown graphically. IPG can potentially be used for blood pressure (BP) estimation in almost the same manner as PPG [12,13,14,15].

2.1.3. Ultrasound Imaging (UI)
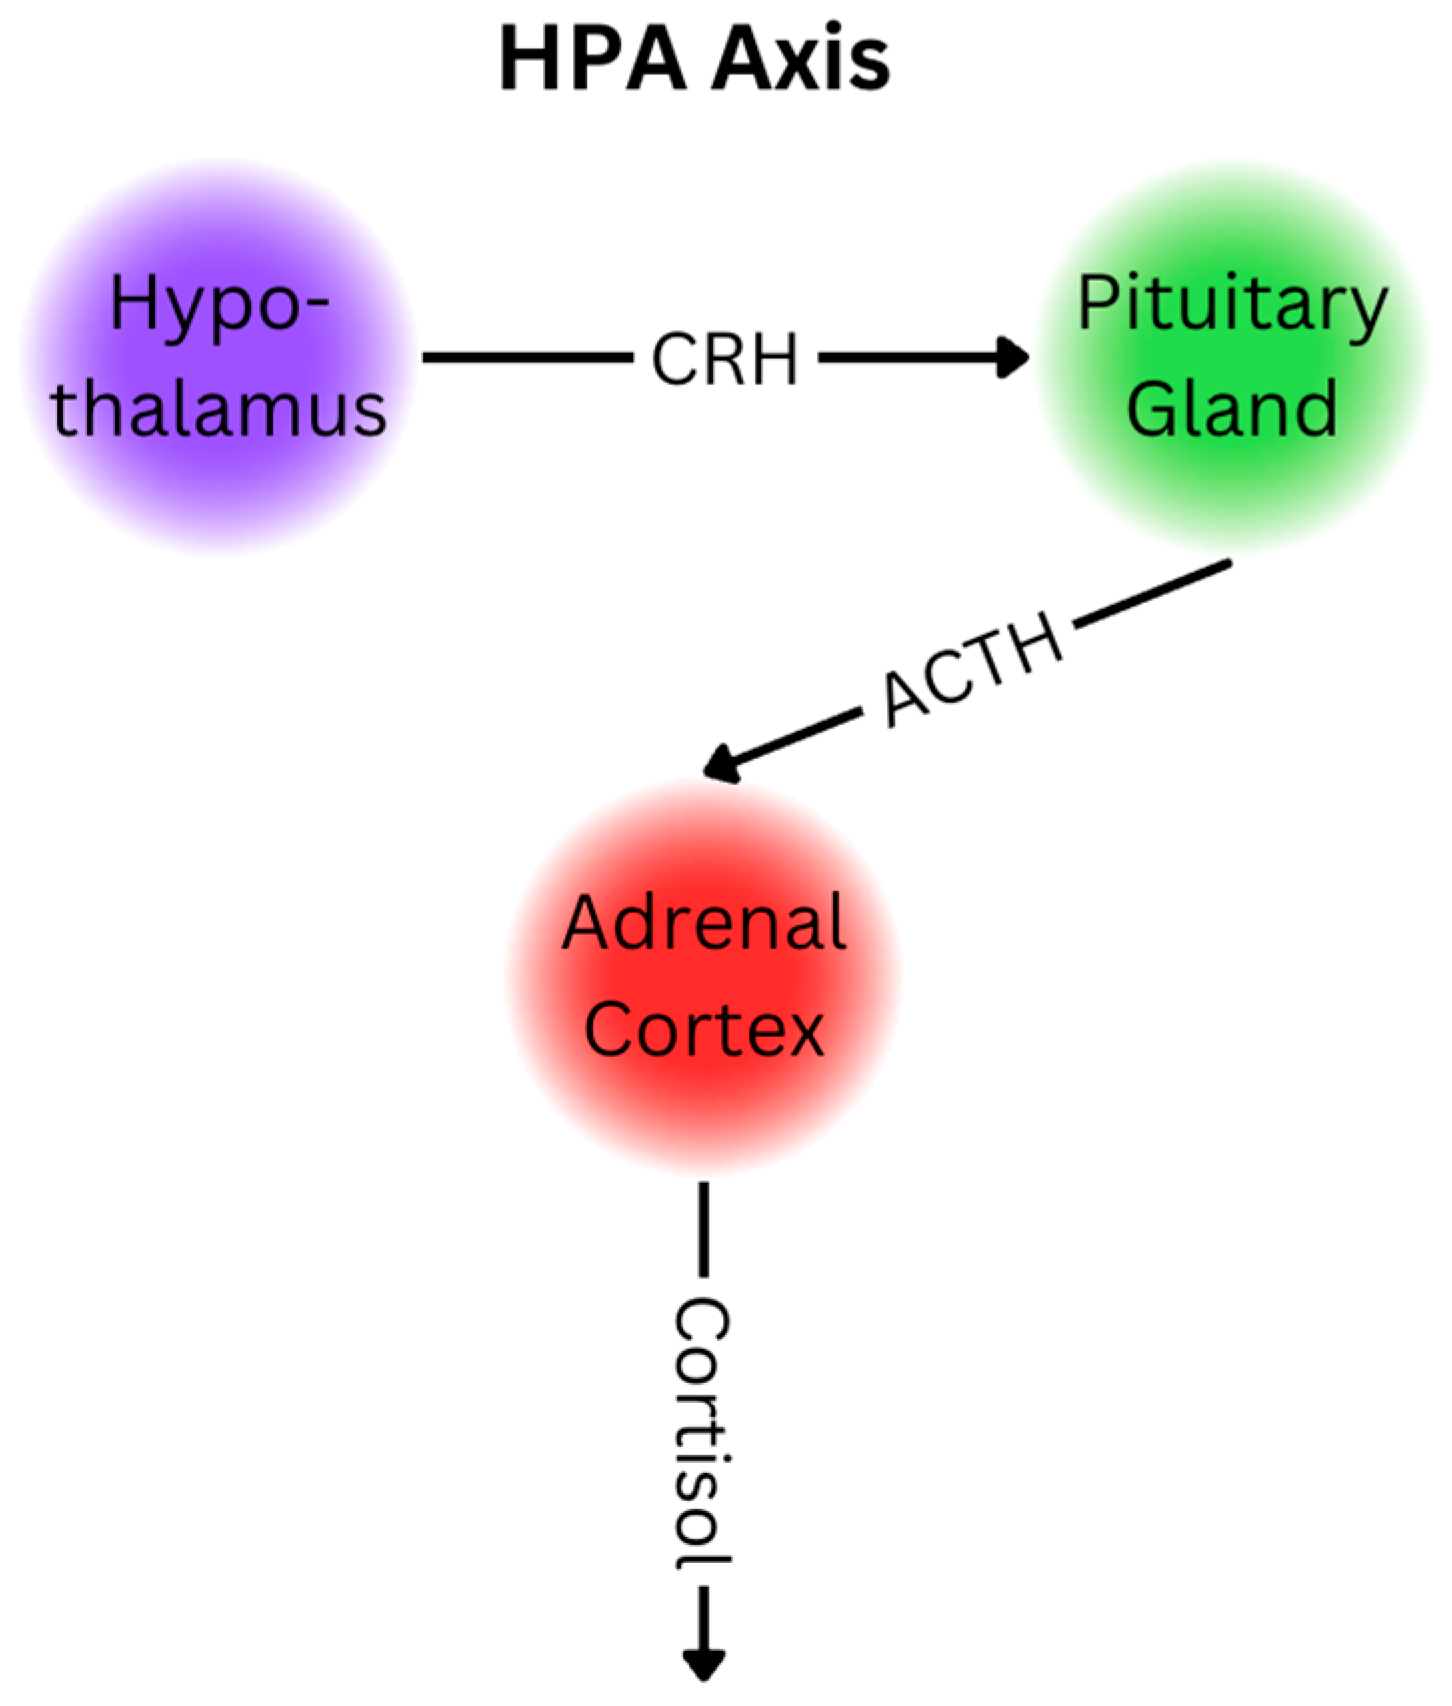
Ultrasound imaging (UI) uses high-frequency sound waves to examine the internal structures of the body. This technique enables the visualization of internal organ movements and blood flow within the vessels. Alterations in blood flow velocity (pulse wave velocity [PWV]) contribute to continuous arterial diameter changes. PWV and arterial diameter can be measured through continuous imaging [16]. The estimation of blood pressure (BP) is possible [17], along with other hemodynamic parameters (e.g., stroke volume) [18,19]. Wearable ultrasound imaging has some obstacles (e.g., power consumption, minimalization, image clarity, and data privacy) [20].

3. Cortisol

The proper functionality of the hypothalamic–pituitary–adrenal (HPA) axis is important for stress and health in general. The axis produces cortisol when it is necessary (Figure 5), for example, peaks in the morning to help wakefulness and when there is a stress stimulus. Thus, the HPA axis plays a role in the circadian rhythm, as well as in metabolism, digestion, immune response, sexual activity, and energy storage and expenditure [21]. A typical sweat cortisol detection sensor is illustrated in Figure 6.
Aptamers bind a specific target of a molecule (e.g., cancer, stem, and pathogen cells) and are sometimes classified as chemical antibodies (or antibody mimics). Aptamers are analogous to monoclonal antibodies (which are widely known for COVID-19 treatment) [22]. They produce an electrochemical reaction to specific binding molecules (in vivo or in vitro). Enzymes are similarly reacting to an analyte concentration by producing an electrochemical reaction. Cortisol can be detected and measured using sensors with aptamers (receptors) and enzymes. Nucleic acids can act as enzymes or aptamers, and these functional nucleic acids (FNAs) can be natural or artificial [23,24].
Alternatively, cortisol can be measured by measuring sodium and potassium concentrations in the analyte (sweat or other human fluids). Cortisol increases sodium and water retention and enhances potassium excretion via mineralocorticoid receptor activation [25]. A sensor employing an ion-selective electrode (ISE) as a transducer can measure sodium (salt) and potassium ions independently [26].

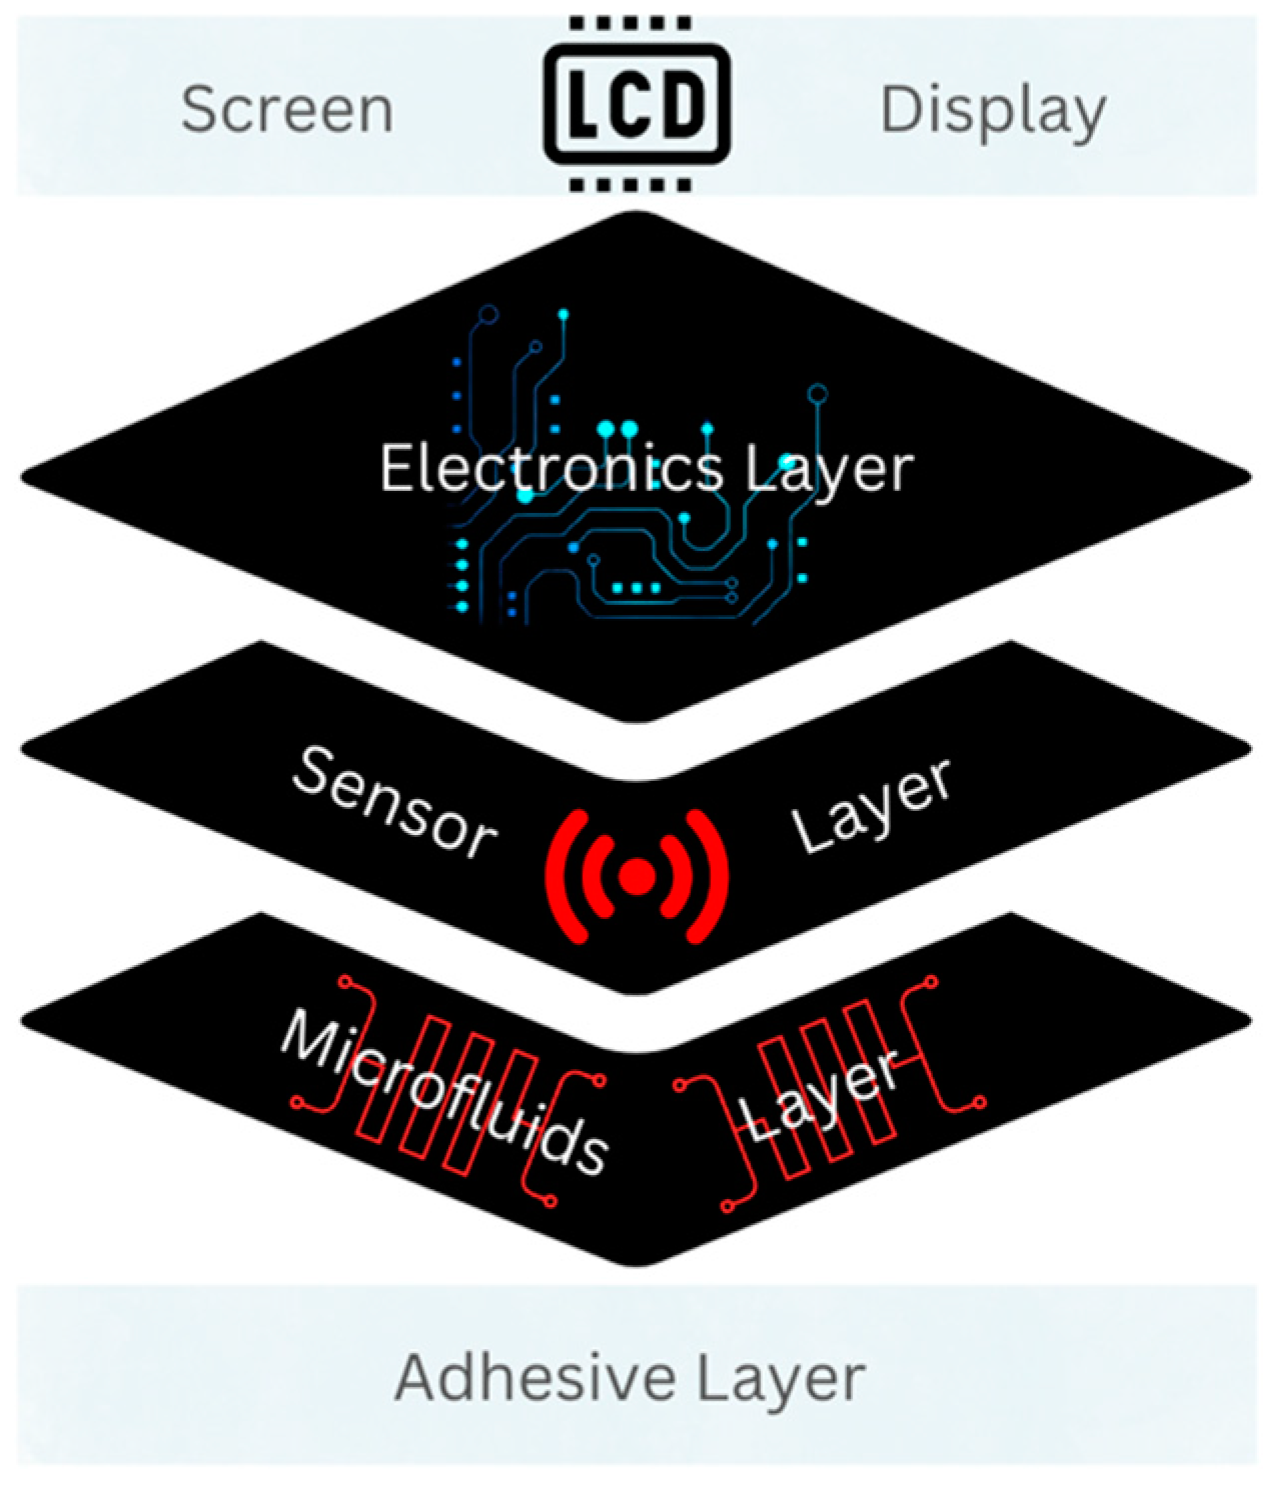
4. Discussion and Conclusions

Photoplethysmography has long been a promising technology. In the current literature, there are articles from more than ten years ago on blood pressure measurement, blood glycemic index measurements, and oxygen saturation; however, this is not an easy task (oxygen saturation is now achieved in many wearable devices). There are no mainstream commercial wearable devices with these capabilities, but they are likely to be in the near future.
Ultrasound as a wearable device is relatively new and rare, and it is also very promising, probably more than any other method (because of the imaging), but also has many obstacles to overcome (see Section 2.1.3). Putting theory into practice almost always brings surprises. So, (a) sensor measurement excellence; (b) processing and filters to remove noise, other interference, and artifacts; and (c) data analysis, processing, and cleaning are the three main points of concern and interest to improve measurements.
Among photoplethysmography, impedance plethysmography, and ultrasound imaging, are the first two that can be used directly and provide testable measurements because they are more proven and simpler to implement than wearable ultrasound imaging.
At the cortisol level, measuring cortisol directly from the analyte is ideal, but it involves many new technologies (aptamers and enzymes) with what this implies. Its measurement using ions (sodium and potassium) may not be as accurate, at least under certain conditions. Herein, multiple methods are proposed that should be investigated in depth, and the trigger is given to young researchers to evaluate them (individually or in combination).
Sweat is a more attractive human fluid secretion for cortisol measurement due to its accessibility compared to other bodily fluids (e.g., saliva, tears, urine). Interstitial fluid (ISF) is also appropriate for cortisol measurement, albeit requiring a minimally invasive procedure [27]. However, sweat is not consistently available for continuous measurement, and environmental contaminants may affect the results. A method exists to induce localized sweat production in a small epidermal area through the application of an electrical current. Furthermore, novel adhesive sensors and microfluidic layers can serve as protective barriers against dust and dirt contamination [28].
Cortisol measurements may be non-maintenance-free. Thus, additional costs, time, and extra processes may be required by the customer and/or expert personnel to regularly clean or replace the spare parts of the device.
The accuracy of the measurements and estimates is lost as the calculations move away from the original measurement and become more deviant. That is, if we take the result of a mathematical formula that comes from the measurement of a sensor (e.g., blood pressure through the measurement of pulse wave velocity) and enter it into another mathematical formula where the result is multiplied by another value, then the accuracy of the measurement decreases (a small initial deviation is multiplied).
This manuscript provides future research directions, instructions, and insights into where research is headed in this field, providing the necessary knowledge. Ideas are provided on how leading and recent technologies (e.g., nucleic acids in the form of aptamers and enzymes, 3D printing, and wearable ultrasound imaging) that have been successfully tested in other health applications can be integrated and contribute significantly to this field. The great opportunities and health benefits of hemodynamic measurements and cortisol levels are also presented. In addition, the need to provide feedback on a stress health control system, both hemodynamically (BP, SV, and CO) and hormonally (HPA axis cortisol), is demonstrated as a holistic approach to better solve this whole issue.
Numerous methods, sensors, technologies, theories, scientific experiments, and literature exist to achieve such measurements with mainstream commercial wearables. Sensors, filters, artificial intelligence, including machine learning models, data processing, and analysis, have evolved significantly systematically and quickly at regular intervals. These measurements, at least in the beginning, maybe more indicative and not of such great accuracy, but they will be very important for health and how to preserve, improve health, and prevent possible diseases.

Author Contributions

Conceptualization, G.V.T. and D.A.F.; methodology, G.V.T.; validation D.A.F., A.M.K. and P.D.B.; investigation G.V.T.; writing—original draft preparation G.V.T. and D.A.F., writing—review and editing K.A.L. and A.M.K.; visualization G.V.T.; Supervision P.D.B. and A.M.K. All authors have read and agreed to the published version of the manuscript.

Funding

This research received no external funding.

Institutional Review Board Statement

Not applicable.

Informed Consent Statement

Not applicable.

Data Availability Statement

Data will be made available on request.

Conflicts of Interest

The authors declare no conflicts of interest.

References

  1. Ma, Y.; Choi, J.; Hourlier-Fargette, A.; Xue, Y.; Chung, H.U.; Lee, J.Y.; Wang, X.; Xie, Z.; Kang, D.; Wang, H.; et al. Relation between blood pressure and pulse wave velocity for human arteries. Proc. Natl. Acad. Sci. USA 2018, 115, 11144–11149. [Google Scholar] [CrossRef] [PubMed]
  2. Koenig, J.; Hill, L.K.; Williams, D.P.; Thayer, J.F. Estimating cardiac output from blood pressure and heart rate: The liljestrand & zander formula. Biomed. Sci. Instrum. 2015, 51, 85–90. [Google Scholar]
  3. Kim, H.-L.; Kim, S.-H. Pulse Wave Velocity in Atherosclerosis. Front. Cardiovasc. Med. 2019, 6, 41. [Google Scholar] [CrossRef] [PubMed]
  4. Takayanagi, Y.; Koike, A.; Kubota, H.; Wu, L.; Nishi, I.; Sato, A.; Aonuma, K.; Kawakami, Y.; Ieda, M. Pulse wave transit time during exercise testing reflects the severity of heart disease in cardiac patients. Drug Discov. Ther. 2020, 14, 21–26. [Google Scholar] [CrossRef]
  5. Liao, C.-F.; Cheng, H.-M.; Sung, S.-H.; Yu, W.-C.; Chen, C.-H. Determinants of pressure wave reflection: Characterization by the transit time-independent reflected wave amplitude. J. Hum. Hypertens. 2011, 25, 665–671. [Google Scholar] [CrossRef]
  6. Lokharan, M.; Lokesh Kumar, K.C.; Harish Kumar, V.; Kayalvizhi, N.; Aryalekshmi, R. Measurement of Pulse Transit Time (PTT) Using Photoplethysmography. In Proceedings of the 16th International Conference on Biomedical Engineering; Singapore, 4–7 December 2016, Goh, J., Lim, C.T., Leo, H.L., Eds.; Springer: Singapore, 2017; pp. 130–134. [Google Scholar]
  7. Kumar, P.V.G.; Deshpande, S.; Nagendra, H.R. Traditional practices and recent advances in Nadi Pariksha: A comprehensive review. J. Ayurveda Integr. Med. 2019, 10, 308–315. [Google Scholar] [CrossRef]
  8. Karimpour, P.; May, J.M.; Kyriacou, P.A. Photoplethysmography for the Assessment of Arterial Stiffness. Sensors 2023, 23, 9882. [Google Scholar] [CrossRef] [PubMed]
  9. Monte-Moreno, E. Non-invasive estimate of blood glucose and blood pressure from a photoplethysmograph by means of machine learning techniques. Artif. Intell. Med. 2011, 53, 127–138. [Google Scholar] [CrossRef] [PubMed]
  10. Liao, S.; Liu, H.; Lin, W.-H.; Zheng, D.; Chen, F. Filtering-induced changes of pulse transmit time across different ages: A neglected concern in photoplethysmography-based cuffless blood pressure measurement. Front. Physiol. 2023, 14, 1172150. [Google Scholar] [CrossRef]
  11. Myint, C.; Lim, K.H.; Wong, K.I.; Gopalai, A.A.; Oo, M.Z. Blood Pressure measurement from Photo-Plethysmography to Pulse Transit Time. In Proceedings of the 2014 IEEE Conference on Biomedical Engineering and Sciences (IECBES), Miri, Malaysia, 8–10 December 2014; pp. 496–501. [Google Scholar]
  12. Ghosh, S.; Chattopadhyay, B.P.; Roy, R.M.; Mukherjee, J.; Mahadevappa, M. Non-invasive cuffless blood pressure and heart rate monitoring using impedance cardiography. Intell. Med. 2022, 2, 199–208. [Google Scholar] [CrossRef]
  13. Wang, T.-W.; Syu, J.-Y.; Chu, H.-W.; Sung, Y.-L.; Chou, L.; Escott, E.; Escott, O.; Lin, T.-T.; Lin, S.-F. Intelligent Bio-Impedance System for Personalized Continuous Blood Pressure Measurement. Biosensors 2022, 12, 150. [Google Scholar] [CrossRef] [PubMed]
  14. Huynh, T.H.; Jafari, R.; Chung, W.-Y. Noninvasive Cuffless Blood Pressure Estimation Using Pulse Transit Time and Impedance Plethysmography. IEEE Trans. Biomed. Eng. 2019, 66, 967–976. [Google Scholar] [CrossRef] [PubMed]
  15. Lee, K.; Yoo, H.-J. Simultaneous Electrical Bio-Impedance Plethysmography at Different Body Parts: Continuous and Non-Invasive Monitoring of Pulse Wave Velocity. IEEE Trans. Biomed. Circuits Syst. 2021, 15, 1027–1038. [Google Scholar] [CrossRef] [PubMed]
  16. Vappou, J.; Luo, J.; Konofagou, E.E. Pulse Wave Imaging for Noninvasive and Quantitative Measurement of Arterial Stiffness In Vivo. Am. J. Hypertens. 2010, 23, 393–398. [Google Scholar] [CrossRef] [PubMed]
  17. Rey, A.; Belen, A. Estimation of Blood Pressure by Image-Free, Wearable Ultrasound. Artery Res. 2024, 30, 3. [Google Scholar] [CrossRef]
  18. Kenny, J.-É.S.; Munding, C.E.; Eibl, A.M.; Eibl, J.K. Wearable ultrasound and provocative hemodynamics: A view of the future. Crit. Care 2022, 26, 329. [Google Scholar] [CrossRef]
  19. Zakrzewski, A.; Anthony, B. Non-Invasive Blood Pressure Estimation Using Ultrasound and Simple Finite Element Models. IEEE Trans. Biomed. Eng. 2017, 65, 2011–2022. [Google Scholar] [CrossRef]
  20. Wang, C.; Zhao, X. See how your body works in real time—Wearable ultrasound is on its way. Nature 2024, 630, 817–819. [Google Scholar] [CrossRef]
  21. Sheng, J.A.; Bales, N.J.; Myers, S.A.; Bautista, A.I.; Roueinfar, M.; Hale, T.M.; Handa, R.J. The Hypothalamic-Pituitary-Adrenal Axis: Development, Programming Actions of Hormones, and Maternal-Fetal Interactions. Front. Behav. Neurosci. 2021, 14, 601939. [Google Scholar] [CrossRef]
  22. Zhang, Y.; Lai, B.S.; Juhas, M. Recent Advances in Aptamer Discovery and Applications. Molecules 2019, 24, 941. [Google Scholar] [CrossRef] [PubMed]
  23. Navani, N.K.; Li, Y. Nucleic acid aptamers and enzymes as sensors. Curr. Opin. Chem. Biol. 2006, 10, 272–281. [Google Scholar] [CrossRef]
  24. Debiais, M.; Lelievre, A.; Smietana, M.; Müller, S. Splitting aptamers and nucleic acid enzymes for the development of advanced biosensors. Nucleic Acids Res. 2020, 48, 3400–3422. [Google Scholar] [CrossRef] [PubMed]
  25. Wassel, E.; Umeh, C.A.; Giberson, C.; Anand, S.K.; Nguyen, A.; Porter, H.; Choday, P.; Kaur, H.; Kundu, A.; Penaherrera, J. Elevated Adrenocorticotropic Hormone, Hypercortisolism, and Marked Hypernatremia. Cureus 2021, 13, e19714. [Google Scholar] [CrossRef] [PubMed]
  26. Pirovano, P.; Dorrian, M.; Shinde, A.; Donohoe, A.; Brady, A.J.; Moyna, N.M.; Wallace, G.; Diamond, D.; McCaul, M. A wearable sensor for the detection of sodium and potassium in human sweat during exercise. Talanta 2020, 219, 121145. [Google Scholar] [CrossRef]
  27. Taskasaplidis, G.; Fotiadis, D.A.; Bamidis, P.D. Review of Stress Detection Methods Using Wearable Sensors. IEEE Access 2024, 12, 38219–38246. [Google Scholar] [CrossRef]
  28. Wu, C.-H.; Ma, H.J.H.; Baessler, P.; Balanay, R.K.; Ray, T.R. Skin-interfaced microfluidic systems with spatially engineered 3D fluidics for sweat capture and analysis. Sci. Adv. 2023, 9, eadg4272. [Google Scholar] [CrossRef] [PubMed]
Figure 1. The role of the hypothalamus in a stress response.
Engproc 82 00042 g001
Figure 2. Pulse arrival time (PAT) with the use of an electrocardiogram (ECG) and photoplethysmography.
Engproc 82 00042 g002
Figure 3. Methods that can be used for pulse transition–arrival time (PTT-PAT) measurement.
Engproc 82 00042 g003
Figure 4. The rate of change in blood pressure with respect to time (velocity) of the pulse wave transition (using formula [1]).
Engproc 82 00042 g004
Figure 5. The hypothalamus releases corticotropin release hormone (CRH), then the pituitary gland releases adrenocorticotropin hormone (ACTH), and finally, the adrenal cortex releases cortisol.
Engproc 82 00042 g005
Figure 6. The layers of a complete sensor system. Some layers are not always necessary (e.g., display) and some layers can be merged.
Engproc 82 00042 g006
Table 1. Methods for monitoring cardiac and arterial activities and physiology.
Abbr.MethodMeansActivity/ImagingMeasurement
BCG
-SCG
Ballistocardiography SeismocardiographyAcceleratorHeart and aorta vibration (mechanical)Heartbeat, vibrations of the heart and aorta
ECG-EKGElectrocardiography
Electrocardiography
ElectrodesHeart electricR-R intervals, heartbeat
IPGImpedance PlethesmographyElectrodes, electric power sourceHeart mechanicalHeart pulse wave, arterial blood volume changes
PCGPhonocardiographySound recorderHeart soundHeartbeat, sound and murmur recording
PPGPhotoplethysmographyPhotodiode (led)Blood flowHeart pulse wave, blood flow and volume changes
UIUltrasound ImagingAcoustic wavesArterial, veinHeart pulse wave, scattering of the blood cell particles
Disclaimer/Publisher’s Note: The statements, opinions and data contained in all publications are solely those of the individual author(s) and contributor(s) and not of MDPI and/or the editor(s). MDPI and/or the editor(s) disclaim responsibility for any injury to people or property resulting from any ideas, methods, instructions or products referred to in the content.

