Proceeding Paper

Analysis of Multiple Emotions from Electroencephalogram Signals Using Machine Learning Models †

by
Jehosheba Margaret Matthew
*,
Masoodhu Banu Noordheen Mohammad Mustafa
and
Madhumithaa Selvarajan
Department of Biomedical Engineering, Vel Tech Rangarajan Dr. Sagunthala R&D Institute of Science and Technology, Chennai 600062, India
*
Author to whom correspondence should be addressed.
Presented at The 11th International Electronic Conference on Sensors and Applications (ECSA-11), 26–28 November 2024; Available online: https://sciforum.net/event/ecsa-11.
Eng. Proc. 2024, 82(1), 41; https://doi.org/10.3390/ecsa-11-20398
Published: 25 November 2024

Abstract

Emotion recognition is a valuable technique to monitor the emotional well-being of human beings. It is found that around 60% of people suffer from different psychological conditions like depression, anxiety, and other mental issues. Mental health studies explore how different emotional expressions are linked to specific psychological conditions. Recognizing these patterns and identifying their emotions is complex in human beings since it varies from each individual. Emotion represents the state of mind in response to a particular situation. These emotions, that are collected using EEG electrodes, need detailed emotional analysis to contribute to clinical analysis and personalized health monitoring. Most of the research works are based on valence and arousal (VA) resulting in two, three, and four emotional classes based on their combinations. The main objective of this paper is to include dominance along with valence and arousal (VAD) resulting in the classification of 16 classes of emotional states and thereby improving the number of emotions to be identified. This paper also considers a 2-class emotion, 4-class emotion, and 16-class emotion classification problem, applies different models, and discusses the evaluation methodology in order to select the best one. Among the six machine learning models, KNN proved to be the best model with the classification accuracy of 95.8% for 2-class, 91.78% for 4-class and 89.26% for 16-class. Performance metrics like Precision, ROC, Recall, F1-Score, and Accuracy are evaluated. Additionally, statistical analysis has been performed using Friedman Chi-square test to validate the results.

1. Introduction

Emotion is a response of a human being when subjected to external stimuli. It affects a person’s psychological and behavioral activities in making decisions and processing information. It is an interesting combination of psychology and technology [1] and can be learnt from different disciplines including marketing, philosophy, neuroscience, psychology, and artificial intelligence. A Brain–Computer Interface (BCI) system is used to provide communication between the machine and the brain [2]. The emergence of BCI [3] has enabled neuroscientists to study the emotions of different individuals and process them using this technology.
Affective Computing is an example of BCI that connects computer science, physiology, and psychology. It is defined as the computational study of emotions and their manifestations within the systems through brain signals [4]. The recognition of emotion through computational means is communicated to healthcare people like doctors, healthcare educators, and medical administrators. The advancement in technology has contributed to various medical applications like rehabilitation, assisting doctors with mental disease diagnoses, like autism, etc., assistance for disabled people like prosthetics, and innovation in medical equipment.
Emotions are presented in two different ways, namely the discrete emotional model and the dimensional model. The discrete model was proposed by Ekman with six emotional states namely happiness, anger, fear, sadness, surprise, and disgust. The dimensional model signifies the affective states in the dimensional space and the dimensions are valence, arousal, dominance, and liking [5]. Here, the emotions are recognized by rating those dimensions. The 2-dimensional models are simpler with valence and arousal whereas the 3-dimensional models are more realistic with valence, arousal, and dominance [6].
Human emotions are analyzed by the quick changes in the electrical activity of the brain. These abrupt changes are measured using an Electroencephalogram (EEG) which is a measuring device placed on the scalp of the head. Various human cognitive and emotional processes of the brain are studied by researchers with the help of EEG signals [7]. EEG signals are in the frequency range of 0.5–100 Hz and the lower frequency range is suitable for cognition [8]. It is commonly preferred by researchers because of easy recording and processing of them into meaningful information. These physiological signals are processed by different machine learning models.
Machine learning is a field of computer science that gives computers the ability to learn without being explicitly programmed [9,10]. It is the subset of artificial intelligence that automates the systems and simplifies the working processes using simple programs. It experiences fast growth and major advancements in various fields. It is indispensable in various fields like healthcare, finance, automotive, and many other promising fields. It is mainly used when the existing solutions require more tuning for a particular problem. It is also for complex problems when there are no good solutions. It has the ability to adapt to new data and find good solutions.
Machine learning systems are classified as supervised, unsupervised, semi-supervised, and reinforcement learning. In supervised earning, the training data have desired solutions called labels before it is given to the algorithm that includes KNN, linear regression, logistic regression, SVM, decision tree, and random forests [10]. In unsupervised learning, the training data are unlabeled and they are not classified. Therefore, the machine uncovers the hidden patterns and creates new labels. The main advantage of this learning is the identification of new unknown patterns. Reinforcement learning is the most advanced learning method since it learns continuously and improves the model by leveraging feedback from past iterations. The term classification in machine learning refers to the task of identifying the data points in the dataset and grouping them into different categories. In a multiclass classification, the data are classified into different classes. It is a statistical problem where the predefined class predicts the output based on features of the dataset [11].
Most emotion recognition-based research focuses on binary classification [12,13,14,15,16]. Few research papers have addressed the 4-class classification [17,18,19]. It is important to classify emotions into different classes so that many numbers of emotions can be estimated [20]. Dominance is either separately classified [21] or not included in the classification of emotions. Nandhini et al. [22] have used the VAD method for emotion recognition for 12 discrete emotions which is a 12-class classification using machine learning algorithms. In this paper, we discuss three different types of classifications namely 2-class, 4-class, and 16-class which are given in Table 1.
The main objectives of this research work are as follows:
  • Develop a suitable VAD model to categorize 16 emotions which is high when compared to the existing state-of-the-art techniques.
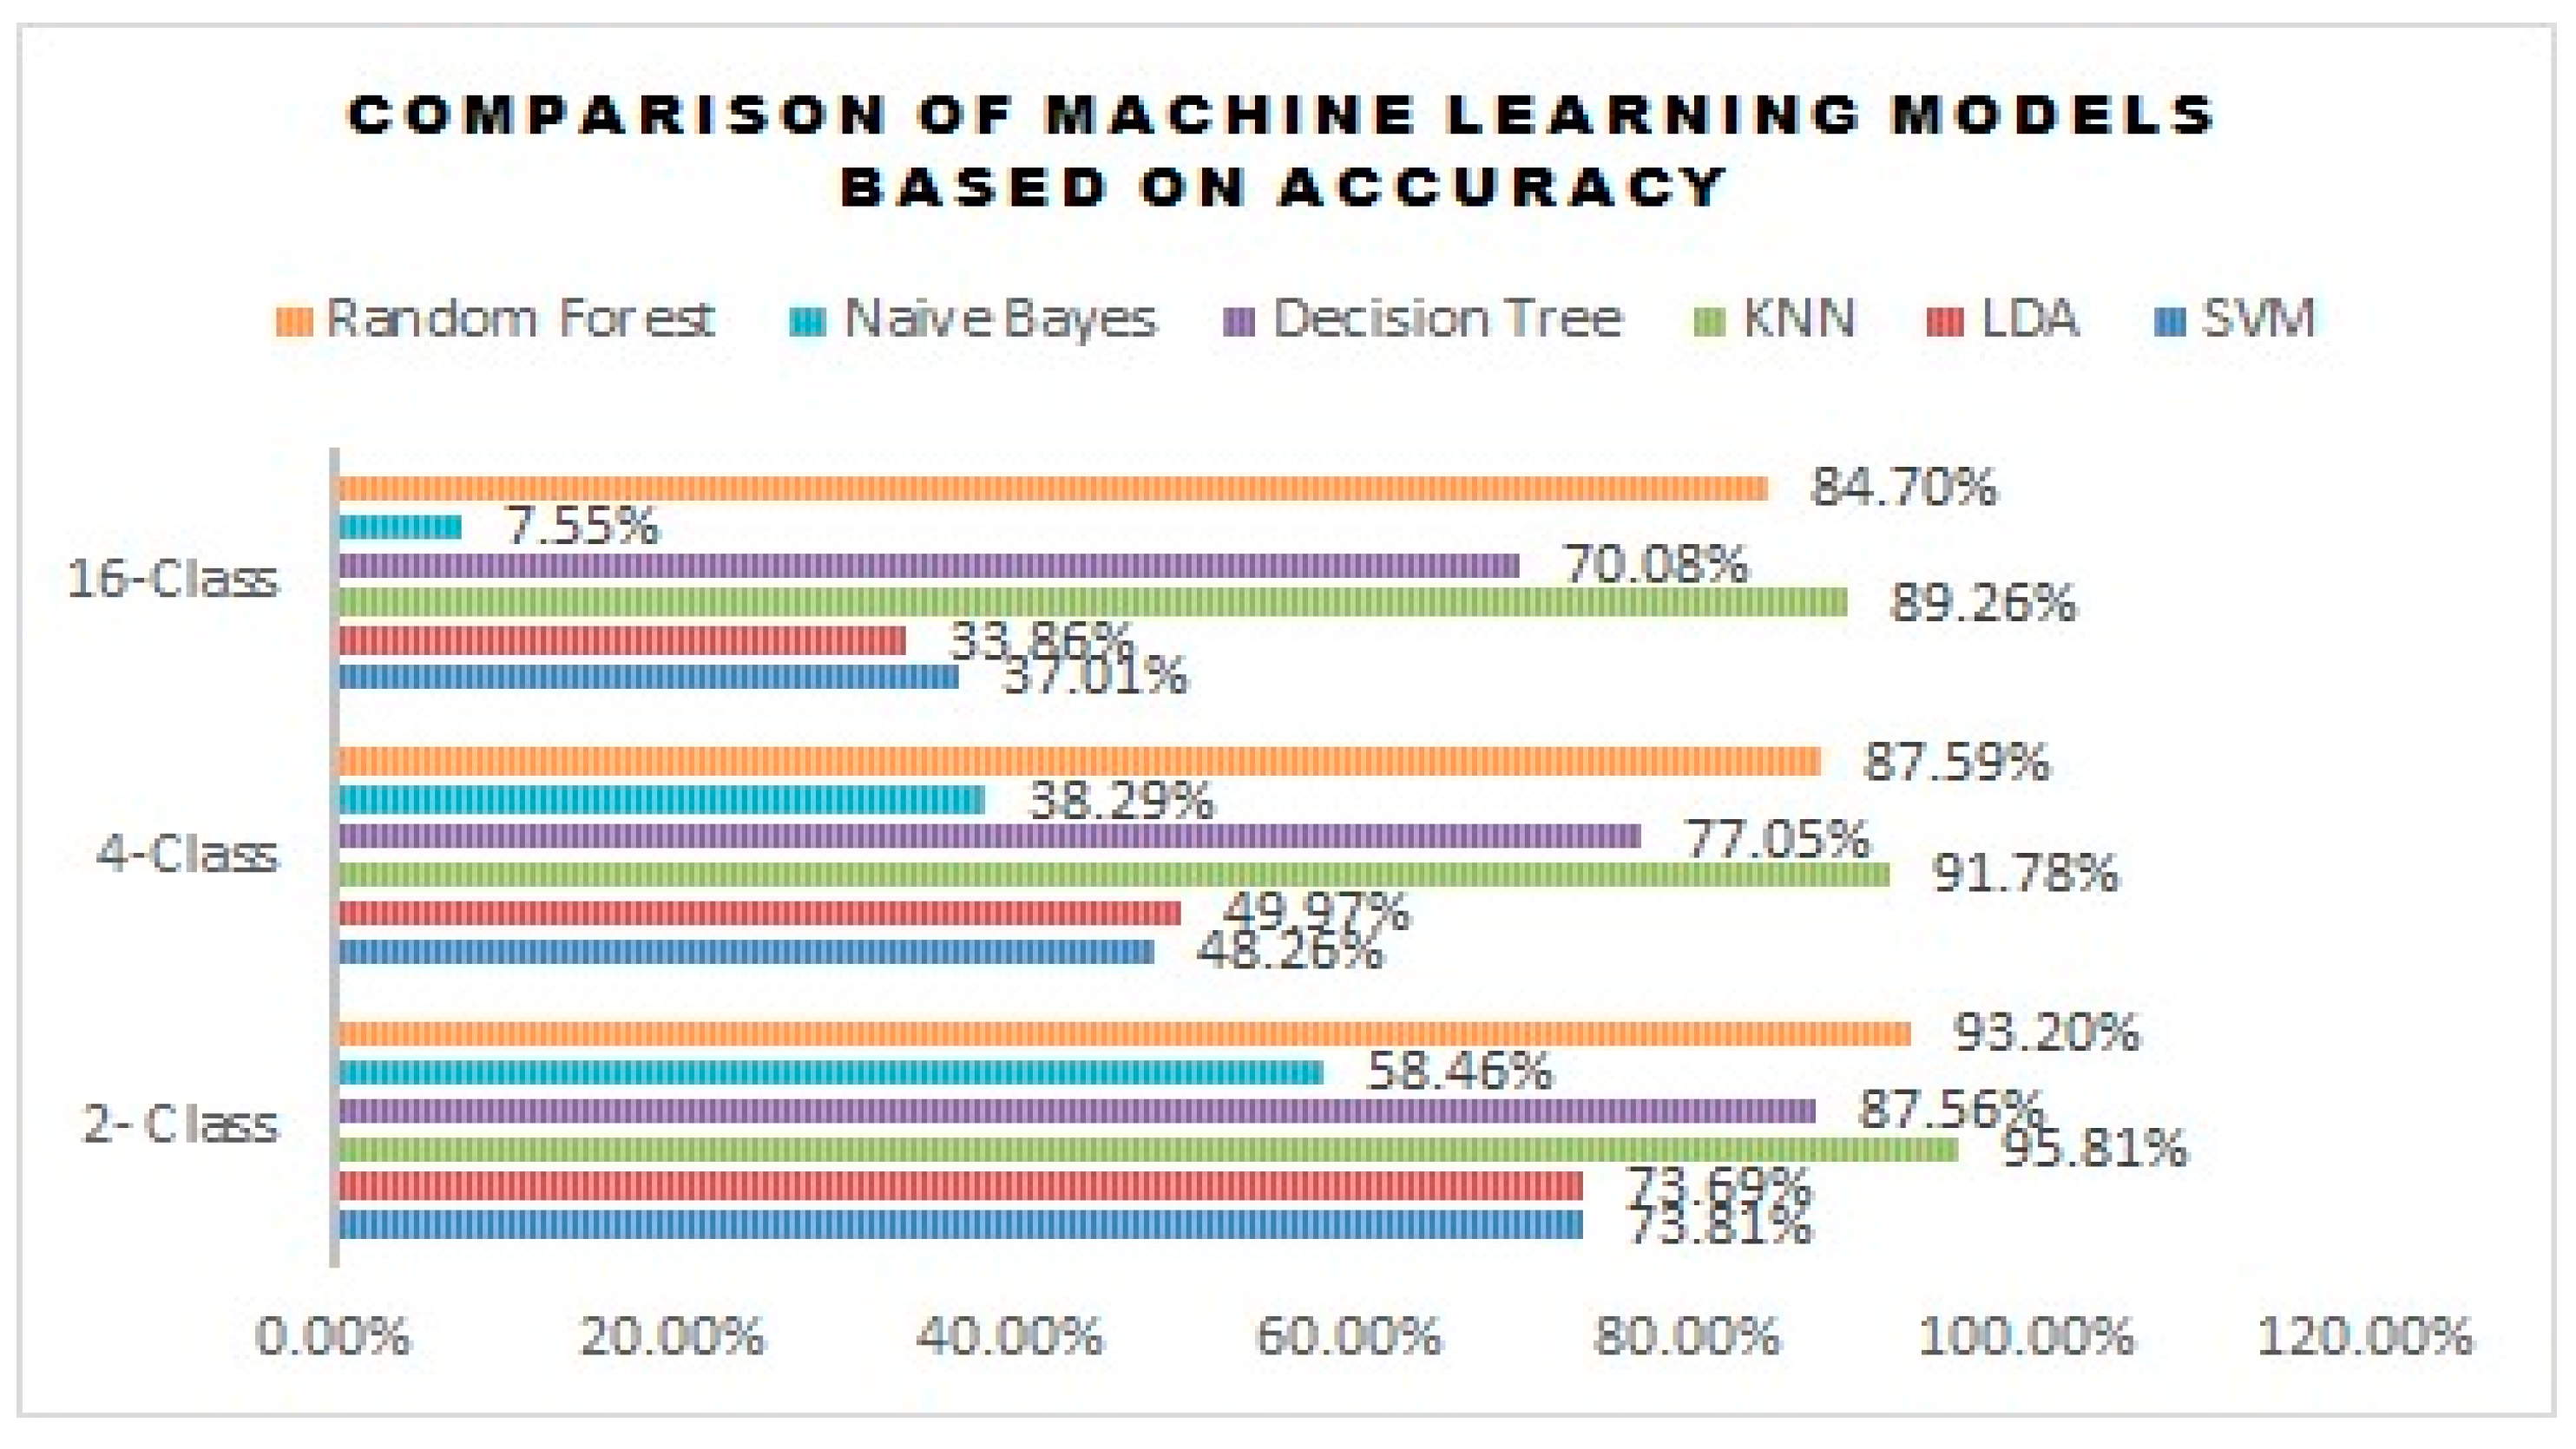
  • Evaluate the performance of the machine learning model for 2-class, 4-class, and 16-class and hence, identify a suitable machine learning model for multiple class classification of emotion.
The remaining sections of the paper are organized in the following order: Section 2 discusses the methodology for preparing the dataset and the explanation of the machine learning models. Section 3 gives the results and discussion of each model and their corresponding performance evaluation. The conclusion is given as the last section in this paper with the summary of the work.

2. Methodology

The interaction between the human brain and the computer follows certain steps so that the computer understands the EEG signal. The DEAP dataset is used for our proposed work [23]. The EEG signal recorded from the human brain has to be collected from the EEG cap which has 48 numbers of electrodes according to the international 10–20 system. Each participant rated the video based on valence, arousal, dominance, and liking on the scale of 1–9. The acquired raw EEG signal was recorded for 63 s after the removal of the baseline signal of 3 s and stored on a computer device. Figure 1 depicts the block diagram of EEG-based emotion recognition for machine learning models. The signal undergoes several processes such as downsampling, filtering, augmentation, feature extraction, and classification of emotions based on the number of classes. At first, the signal was downsampled to 128 Hz to focus on the frequency of interest and to eliminate higher frequency components in the signal. The dimensions of the data are the product of the number of video trials, selected the number of channels and samples which is 40 × 14 × 8064 (63 s × 128 Hz). The windowing technique is used for the data augmentation process; resulting in 19,520 (40 ×488) data samples for a single subject for 40 trials [24]. Power Spectral Density (PSD) was extracted by considering the five frequency bands of EEG and 14 numbers of channels. The machine learning models that are used for classification are SVM, KNN, LDA, random forest, decision tree, and naive Bayes.
The label in the DEAP dataset has rating values of each trail for each subject. The rating is based on four dimensions of valence, arousal, dominance, and liking (VADL) and ranges from 1 to 9. Most studies used binary classification where the labels are classified into positive and negative emotions. Few studies have used a valence and arousal (VA) model resulting in four class classifications. In this paper, the combination of valence, arousal, and dominance (VAD) dimensions is used to categorize into 16 emotions.

3. Result and Discussion
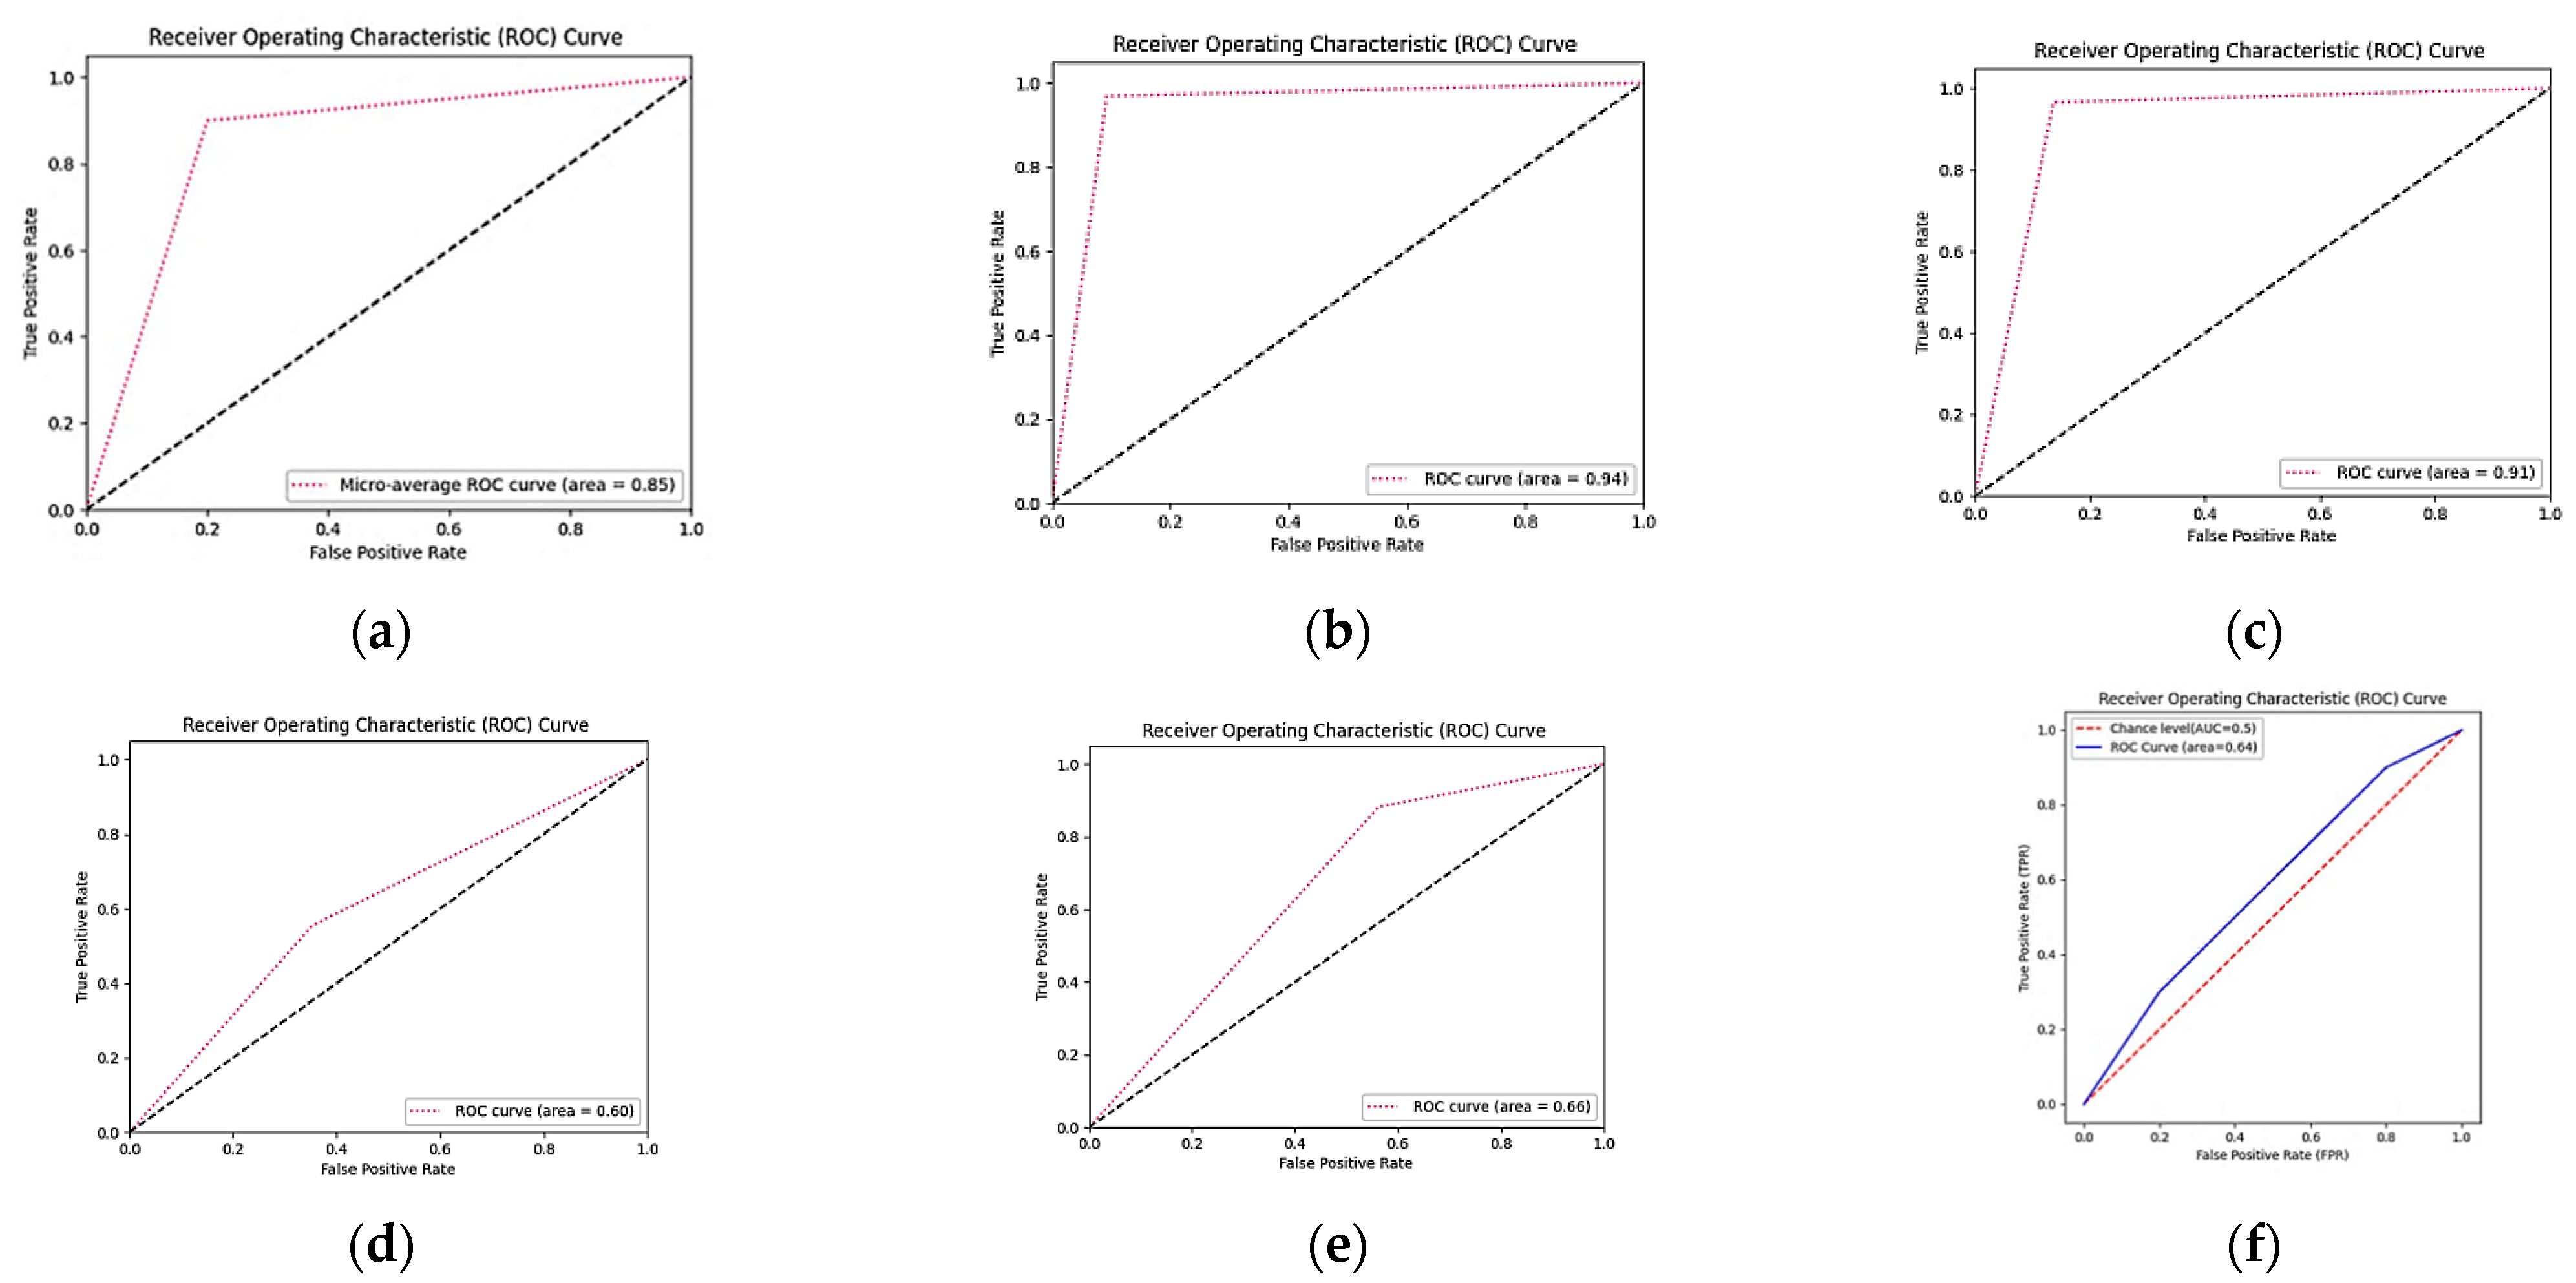
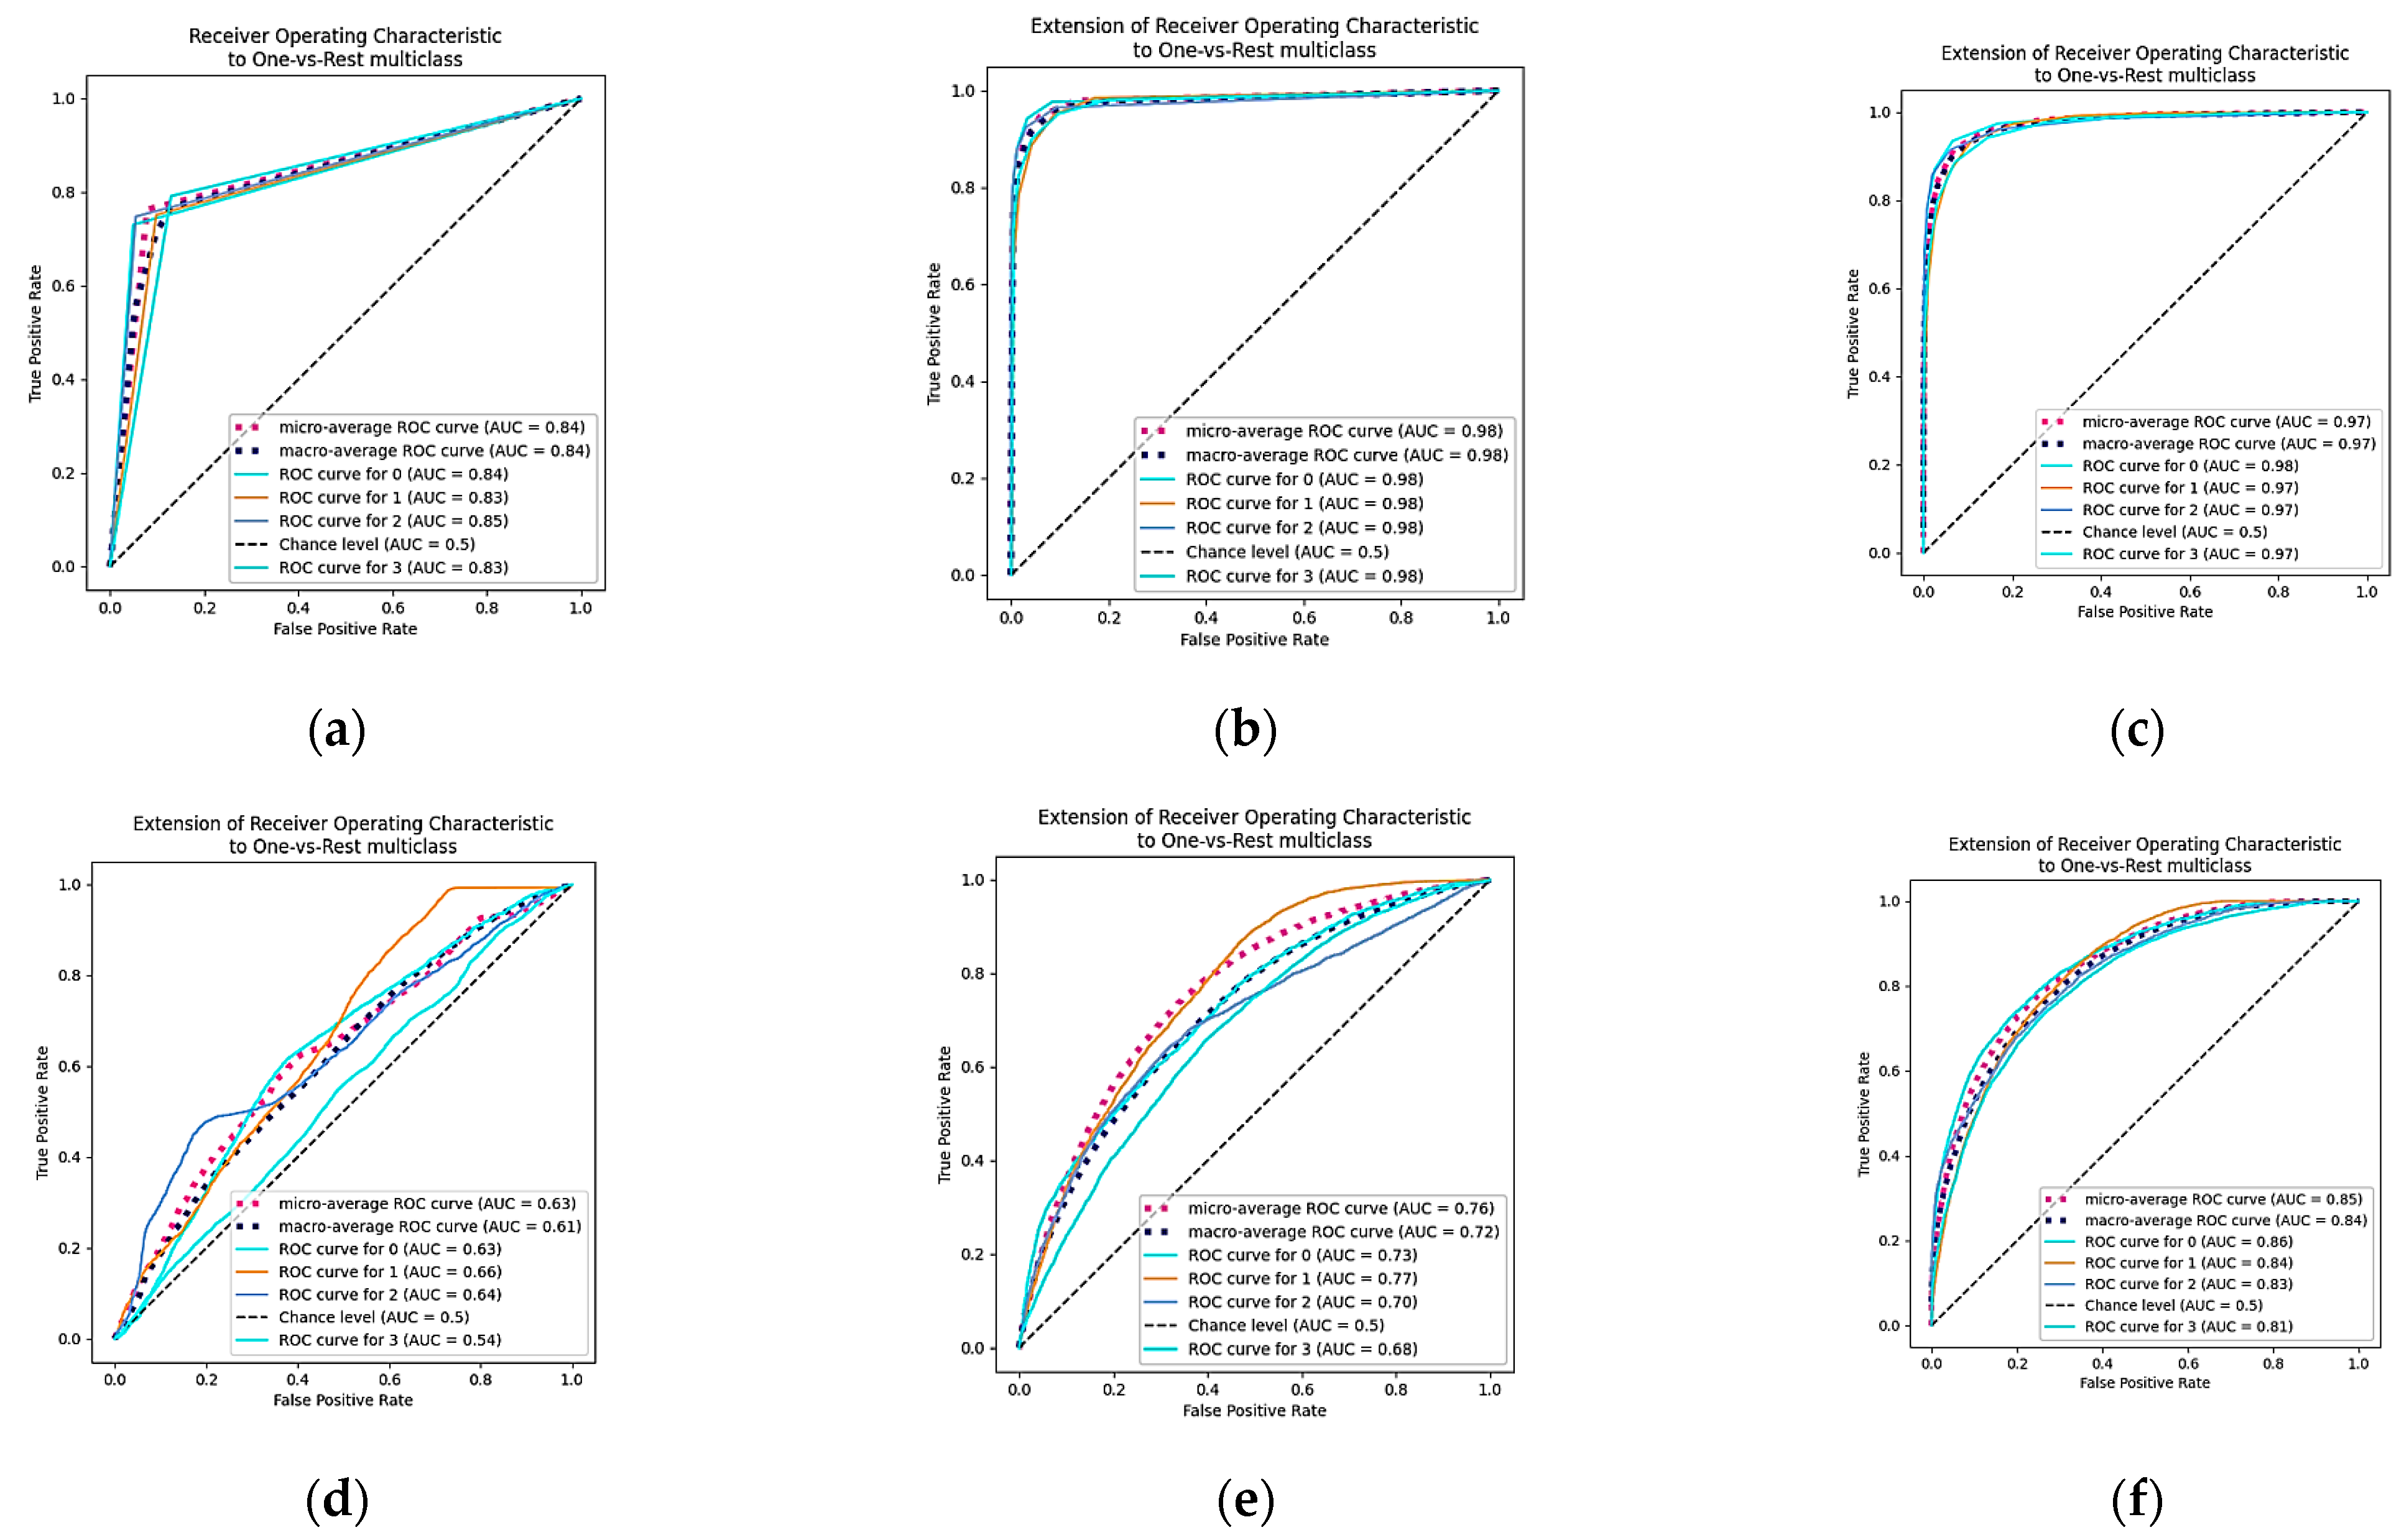
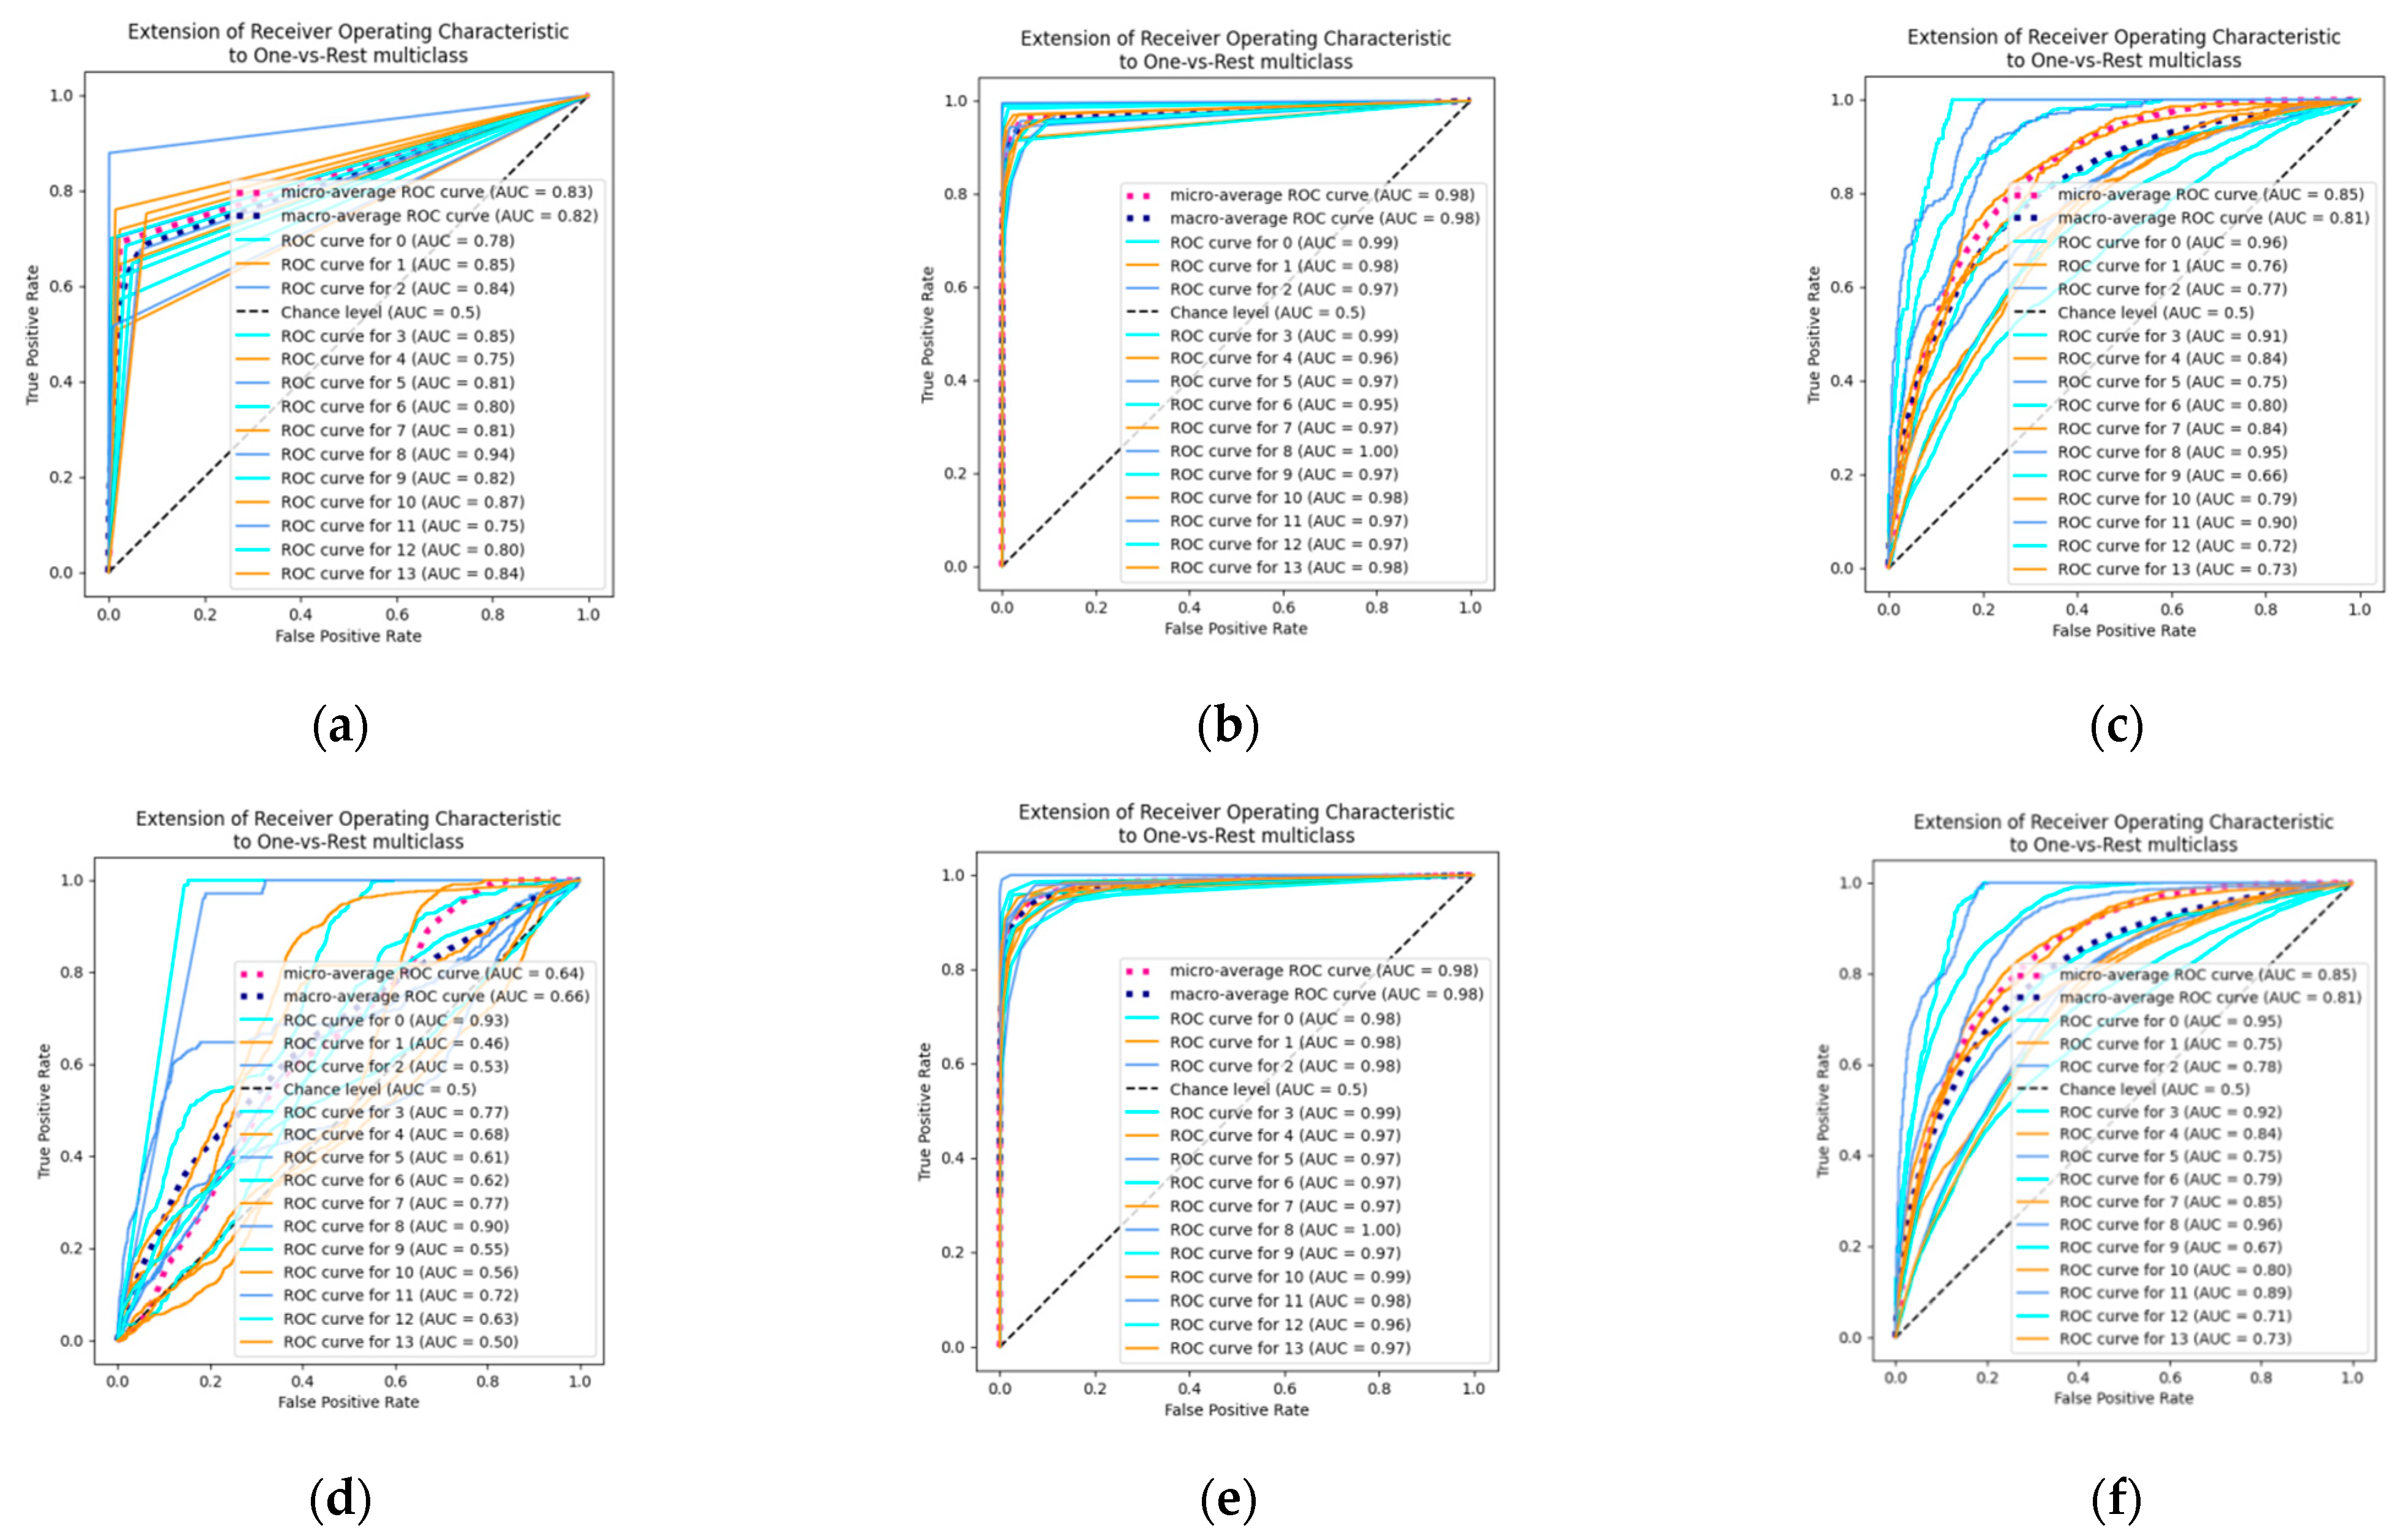
The experimental setup for the investigation is given in Table 2.

3.1. SVM

Examination of the dataset with the SVM model found that the model had good accuracy results for 2-class classification. It is a powerful machine learning tool that is best suited for binary classification. The percentage of accuracy has dropped for 16-class classification to 37.01%. These accuracy rates can be improved when the SVM model is created for each pair of classes. In this model, the value of the regularization parameter (C) is one and the kernel used for experimentation is linear and RBF. It is important to choose the value of C and a suitable kernel for better classification results.
As shown in Table 3, the linear kernel has shown a better performance of around 14% higher than the RBF kernel for 16-class classification. This is due to the linearization of data with short time interval considerations for FFT. Generally, EEG-based emotional dataset has the problem of class imbalance and hence, lead to the degradation of the performance [25]. SVM are sensitive to class imbalance and therefore SVM-RBF model has shown poor performance. It needs good tuning to achieve optimal solutions but it requires expertise. Therefore, when the number of classes increased, the model failed to separate the data into different classes.

3.2. LDA

LDA aimed to maximize the separation between the classes while minimizing the variance within each class. However, as the number of classes increased, the overlap between the classes also increased, making it harder to effectively distinguish between them. This happened because the classes are closely related or inherently ambiguous. Also, in multi-class classification, the decision boundaries are highly nonlinear, making it difficult to capture the underlying patterns in the data. Therefore, the model’s accuracy dropped from 73.69% to 33.86% when the number of classes increased. The performance metric of LDA is given in Table 4.

3.3. KNN

In order to select the value of k, different values were investigated to find the best. Since there is no definite method, proper care must be taken for the selection of the k value. A very low k value, such as 1 or 2, may create noise and lead to an outlier effect in the model. Selecting large k values is good and produces stable decision boundaries but creates difficulties in computation. This model is easy to implement and highly robust to noise; it has shown good results due to its ability to perform well with large data. It can process 1-D data and multi-class classification well, resulting in 89.26% accuracy. Among the different k values, it was observed that the model attained the highest accuracy when k = 3 for all three classes. Table 5 shows the efficiency of KNN using the performance metrics.

3.4. Decision Tree

The decision tree supports both binary and multi-class classification techniques. The decision tree with entropy is a key factor that helps to make decisions while splitting the data at each node of the tree; it groups homogenous data and maximizes the information gain by reducing the uncertainty. It was observed that the decision tree with entropy has better predictive power for the classification of the tasks due to the ability to quantify the impurity of the dataset. It was estimated that the accuracy of the 2-class was 87.56%, the 4-class was 77.05%, and the 16-class was 70.08%. Table 6 shows the performance metric of the decision tree with and without entropy.

3.5. Naive Bayes

The naive Bayes model works mostly on the assumption that the features are independent of the given class label. Complexity in capturing the underlying patterns between the variables has caused the model to fail. Confusion has occurred within the model because the features are correlated with each other. As the number of classes increased, the complexity further increased leading to poor classification of the model to about 7%. Table 7 shows the performance evaluation of naive Bayes.

3.6. Random Forest

Random Forest works on multiple numbers of trees instead of relying on a single tree. Therefore, it provides accuracy greater than 84% for all three types of classification and prevents the problem of overfitting. It produces high accuracy even when the dataset is large. The selection in the number of decision trees is based on a trial and error method. For 2-class classification, the number of the decision tree (n) chosen to be high was 24 and the maximum accuracy obtained was 93.2%. For 4-class classification, n was 25 and the maximum accuracy obtained was 87.59%. For 16-class classification, n is chosen to be 24 and the maximum accuracy was 84.7%. The other performance metric of the model was calculated and shown in Table 8.
The receiver operating characteristic (ROC) curve of the 2-class classification is shown in Figure 2a–f for all the machine learning models with predicted value in the x-axis and true value in the y-axis. Figure 3a–f portrays the 4-class classification of the experimented machine learning models. In Figure 4a–f, the ROC curve of 16-class classifications of different machine learning models is shown.
The comparison of different machine learning models based on accuracy is shown in Figure 5. Among the six models, we observed that KNN has better accuracy for multiclass classification. Table 4 shows that better results were obtained for the other performance metrics. This proved good for 16-class which is the highest number of emotions than the existing state-of-the-art classification. Random forest also has proved best with 84.7% for 16-class classification. Naive Bayes showed the worst performance for multiclass classification with 7% of accuracy. Thus, from the complete analysis, it can be deduced that higher classification of emotional states leads to the degradation of the model’s performance. The classification of 16 emotional classes seems to be challenging due to the variation in emotions among each individual and also the label values that are close to one another.

3.7. Statistical Analysis

The Friedman Chi-square statistical analysis test was performed for the machine learning models discussed above in this paper and the corresponding statistic values and p-value is given in Table 9. For 2-class classification, the estimated p-value is 0.0014 so there is a significant difference between the models. For 4-class classification, the obtained p-value is less than 0.05; therefore, there is a significant difference between the models. The Dunn–Bonferroni test was performed to compare the models in pairs. While performing the Dunn–Bonferroni test, it was evident that there is a significant difference between the KNN and naive Bayes model with p-value of 0.00091, 0.00088, and 0.001123 for 2-class, 4-class, and 16-class, respectively. In addition, random forest is also significantly different from naive Bayes with the p-value of 0.018, 0.0238, and 0.020634 for 2-class, 4-class, and 16-class, respectively. In 16-class classification, the KNN model is also significantly different from LDA with the p-value of 0.01568.

4. Conclusions

The main aim of this analysis is to identify an efficient machine learning model for EEG-based emotion recognition using the VAD model. DEAP dataset has been used for the experimentation of the models. The data were trained using models like SVM, KNN, LDA, naive Bayes, decision tree, and random forest. These models were evaluated using training data and have given varying degrees of accuracy based on the number of classifications and the type of machine learning model used. The performance metrics like accuracy, precision, recall, and F1-score were used to evaluate and compare the model. Among these models, KNN achieved the highest accuracy among all three types of classification, with an accuracy of 87.31% for 16-class, 90.29% for 4-class, and 94.86% for 2-class classification. The naive Bayes model performed least among other models with an accuracy of 7.55% for 16-class, 38.29% for 4-class, and 58.46% for 2-class. Both the random forest and KNN models showed good results for multiclass classification using the VAD model. These results show that these machine learning models could be useful for EEG-based emotion classification with less computational complexity. In the future, these models with proper tuning could be used to provide better results for multiclass classification.

Author Contributions

Conceptualization, J.M.M., M.B.N.M.M. and M.S.; methodology, J.M.M., M.B.N.M.M. and M.S.; software, J.M.M.; supervision, M.B.N.M.M.; validation, J.M.M., M.B.N.M.M. and M.S.; visualization, J.M.M., M.B.N.M.M. and M.S.; writing—original draft—J.M.M.; writing—review and editing, J.M.M. and M.B.N.M.M. All authors have read and agreed to the published version of the manuscript.

Funding

This research received no external funding.

Institutional Review Board Statement

Not applicable.

Informed Consent Statement

Not applicable.

Data Availability Statement

Dataset is available at https://www.eecs.qmul.ac.uk/mmv/datasets/deap/download.html (accessed on 19 January 2022).

Conflicts of Interest

The authors declare no conflicts of interest.

References

  1. Banu, N.M.; Sujithra, T.; Cherian, S.M. Performance Comparison of BCI Speller Stimuli Design. Mater. Today Proc. 2021, 45, 2821–2827. [Google Scholar] [CrossRef]
  2. Cao, G.; Ma, Y.; Meng, X.; Gao, Y.; Meng, M. Emotion Recognition Based On CNN. In Proceedings of the 2019 Chinese Control Conference (CCC), Guangzhou, China, 27–30 July 2019; pp. 8627–8630. [Google Scholar]
  3. Dabas, H.; Sethi, C.; Dua, C.; Dalawat, M.; Sethia, D. Emotion Classification Using EEG Signals; ACM: New York, NY, USA, 2018. [Google Scholar] [CrossRef]
  4. Géron, A. Hands-on Machine Learning with Scikit-Learn, Keras, and TensorFlow; R. O’Reilly Media: Sebastopol, CA, USA, 2019. [Google Scholar]
  5. Houssein, E.H.; Hammad, A.; Ali, A.A. Human Emotion Recognition from EEG-Based Brain–Computer Interface Using Machine Learning: A Comprehensive Review. In Neural Computing and Applications; Springer: London, UK, 2022; Volume 34. [Google Scholar] [CrossRef]
  6. Ivanova, E.; Borzunov, G. Optimization of Machine Learning Algorithm of Emotion Recognition in Terms of Human Facial Expressions. Procedia Comput. Sci. 2020, 169, 244–248. [Google Scholar] [CrossRef]
  7. Koelstra, S.; Mühl, C.; Soleymani, M.; Lee, J.S.; Yazdani, A.; Ebrahimi, T.; Pun, T.; Nijholt, A.; Patras, I. DEAP: A Database for Emotion Analysis; Using Physiological Signals. IEEE Trans. Affect. Comput. 2012, 3, 18–31. [Google Scholar] [CrossRef]
  8. Kusumaningrum, T.D.; Faqih, A.; Kusumoputro, B. Emotion Recognition Based on DEAP Database Using EEG Time-Frequency Features and Machine Learning Methods. J. Phys. Conf. Ser. 2020, 1501, 012020. [Google Scholar] [CrossRef]
  9. Lee, Y. Support Vector Machines for Classification: A Statistical Portrait. Methods Mol. Biol. 2010, 620, 347–368. [Google Scholar] [CrossRef] [PubMed]
  10. Li, R.; Ren, C.; Ge, Y.; Zhao, Q.; Yang, Y.; Shi, Y.; Zhang, X.; Hu, B. MTLFuseNet: A Novel Emotion Recognition Model Based on Deep Latent Feature Fusion of EEG Signals and Multi-Task Learning. Knowl.-Based Syst. 2023, 276, 110756. [Google Scholar] [CrossRef]
  11. Li, X.; Song, D.; Zhang, P.; Zhang, Y.; Hou, Y.; Hu, B. Exploring EEG Features in Cross-Subject Emotion Recognition. Front. Neurosci. 2018, 12, 15. [Google Scholar] [CrossRef] [PubMed]
  12. Liu, Y.; Sourina, O. EEG-Based Dominance Level Recognition for Emotion-Enabled Interaction. In Proceedings of the IEEE International Conference on Multimedia and Expo, Melbourne, VIC, Australia, 9–13 July 2012; pp. 1039–1044. [Google Scholar] [CrossRef]
  13. Jehosheba Margaret, M.; Masoodhu Banu, N.M. Performance Analysis of EEG Based Emotion Recognition Using Deep Learning Models. Brain-Comput. Interfaces 2023, 10, 79–98. [Google Scholar] [CrossRef]
  14. Margaret, M.J.; Masoodhu Banu, N.M. A Survey on Brain Computer Interface Using EEG Signals for Emotion Recognition. AIP Conf. Proc. 2022, 2518, 040002. [Google Scholar]
  15. Mowla, M.R.; Cano, R.I.; Dhuyvetter, K.J.; Thompson, D.E. Affective Brain-Computer Interfaces: Choosing a Meaningful Performance Measuring Metric. Comput. Biol. Med. 2020, 126, 104001. [Google Scholar] [CrossRef] [PubMed]
  16. Nandini, D.; Yadav, J.; Rani, A.; Singh, V. Design of Subject Independent 3D VAD Emotion Detection System Using EEG Signals and Machine Learning Algorithms. Biomed. Signal Process. Control. 2023, 85, 104894. [Google Scholar] [CrossRef]
  17. Liu, N.; Fang, Y.; Li, L.; Hou, L.; Yang, F.; Guo, Y. Multiple Feature Fusion for Automatic Emotion Recognition Using EEG Signals. In Proceedings of the 2018 IEEE International Conference on Acoustics, Speech and Signal Processing (ICASSP), Calgary, AB, Canada, 15–20 April 2018; IEEE: Piscataway, NJ, USA, 2018; pp. 896–900. [Google Scholar]
  18. Ozdemir, M.A.; Degirmenci, M.; Izci, E.; Akan, A. EEG-Based Emotion Recognition with Deep Convolutional Neural Networks. Biomed. Tech. 2021, 66, 43–57. [Google Scholar] [CrossRef]
  19. Pandey, P.; Seeja, K.R. Subject Independent Emotion Recognition from EEG Using VMD and Deep Learning. J. King Saud Univ.-Comput. Inf. Sci. 2022, 34, 1730–1738. [Google Scholar] [CrossRef]
  20. Sharma, A. Emotion Recognition Using Deep Convolutional Neural Network with Large Scale Physiological Data; University of South Florida: Tampa, FL, USA, 2018; Available online: https://scholarcommons.usf.edu/etd/7570 (accessed on 16 September 2023).
  21. Zangeneh Soroush, M.; Maghooli, K.; Setarehdan, S.K.; Nasrabadi, A.M. A Novel Approach to Emotion Recognition Using Local Subset Feature Selection and Modified Dempster-Shafer Theory. Behav. Brain Funct. 2018, 14, 17. [Google Scholar] [CrossRef] [PubMed]
  22. Theobald, O. Machine Learning for Absolute Beginners; Scatterplot Press: London, UK, 2017; Volume 4. [Google Scholar]
  23. Wang, J.; Wang, W. Review of the Emotional Feature Extraction and Classification Using EEG Signals. Cogn. Robot. 2021, 1, 29–40. [Google Scholar] [CrossRef]
  24. Yan, J.; Chen, S.; Deng, S. A EEG-Based Emotion Recognition Model with Rhythm and Time Characteristics. Brain Inform. 2019, 6, 7. [Google Scholar] [CrossRef]
  25. Yang, Y.; Wu, Q.M.J.; Zheng, W.-L.; Lu, B.-L. EEG-Based Emotion Recognition Using Hierarchical Network with Subnetwork Nodes. IEEE Trans. Cogn. Dev. Syst. 2017, 10, 408–419. [Google Scholar] [CrossRef]
Figure 1. Block diagram of EEG-based emotion recognition for machine learning models.
Engproc 82 00041 g001
Figure 2. ROC curve for the 2-class classification of machine learning models: (a) decision tree, (b) KNN, (c) random forest, (d) naive Bayes, (e) LDA, and (f) SVM.
Engproc 82 00041 g002
Figure 3. ROC curve for 4-class classification of machine learning models: (a) decision tree, (b) KNN, (c) random forest, (d) naive Bayes, (e) LDA, and (f) SVM.
Engproc 82 00041 g003
Figure 4. ROC curve for 16-class classification of machine learning models: (a) decision tree, (b) KNN, (c) LDA, (d) naive Bayes, (e) random forest, and (f) SVM.
Engproc 82 00041 g004
Figure 5. Comparison of different machine learning models in terms of accuracy.
Engproc 82 00041 g005
Table 1. Emotional class and its categories.
No. of ClassCategories
2—(V) (A)Valence(V), Arousal(A)
4—(VA)High Arousal High Valence (HAHV), High Arousal Low Valence (HALV), Low Arousal High Valence (LAHV), and Low Arousal Low Valence (LALV)
16—(VAD)Sadness, Shame, Guilt, Envy, Satisfaction, Relief, Hope, Interest, Fear, Disgust, Contempt, Anger, Pride, Elation, Joy, and Surprise
Table 2. Experimental Setup.
Name/DescriptionVersion
CPUIntel® Core™ i5
RAM8 GB
OSWindows 10
PythonPython 3.11.5
TensorFlowTensorFlow 2.14.0
Scikit-learnScikit-learn 1.3.1
Anaconda2021.05
Table 3. Performance evaluation of the SVM model.
ModelSVM-Linear
AccuracyPrecisionRecallF1-Score
2- Class73.81%72%64%65%
4-Class48.26%46%42%42%
16-Class37.01%35%37%35%
SVM-RBF
2- Class67.35%34%50%40%
4-Class38.75%10%25%14%
16-Class24.4%2%7%3%
Table 4. Performance evaluation of the LDA model.
ModelLDA
AccuracyPrecisionRecallF1-Score
2-Class73.69%70%66%67%
4-Class49.97%49%43%44%
16-Class33.86%28%29%25%
Table 5. Performance evaluation of the KNN model.
ModelKNN
AccuracyPrecisionRecallF1-Score
2-Class95.81%95%95%95%
4-Class91.78%92%92%92%
16-Class89.26%89%90%89%
Table 6. Performance measure of the Decision Tree.
ModelDecision Tree
AccuracyPrecisionRecallF1-Score
Without EntropyWith
Entropy
Without EntropyWith
Entropy
Without EntropyWith
Entropy
Without EntropyWith
Entropy
2-Class86.71%87.56%85%86%85%86%85%86%
4-Class76.39%77.05%75%76%76%77%76%77%
16-Class69.68%70.08%67%68%68%68%67%68%
Table 7. Performance measure of Naive Bayes.
ModelNaive Bayes
AccuracyPrecisionRecallF1-Score
2- Class58.46%59%60%57%
4-Class38.29%29%28%24%
16-Class7.55%18%26%7%
Table 8. Performance measure of Random Forest.
ModelRandom Forest
AccuracyPrecisionRecallF1-Score
2- Class93.20%93%91%92%
4-Class87.59%89%87%87%
16-Class84.70%87%82%84%
Table 9. Statistical Analysis for 2-class, 4-class, and 16-class.
Statistical Analysis for 2-class, 4-class, and 16-class
2-class
Friedman Test Statistic19.60431
p-value0.001482
4-class
Friedman Test Statistic19.49275
p-value0.001555
16-class
Friedman Test Statistic20.0
p-value0.001249
Disclaimer/Publisher’s Note: The statements, opinions and data contained in all publications are solely those of the individual author(s) and contributor(s) and not of MDPI and/or the editor(s). MDPI and/or the editor(s) disclaim responsibility for any injury to people or property resulting from any ideas, methods, instructions or products referred to in the content.

