Abstract
This research focuses on improving construction project workflow efficiency using a hybrid scheme of Lean Six Sigma and monitoring sensors. Real-time data and automated monitoring improve project timeframes by detecting waste and eliminating inefficiencies. The study found that delays were primarily caused by long lead times, delayed order placements, and job rework. The sensor-enhanced EOQ model and CiteOps software reduced delays, highlighting the importance of continuous technology integration for long-term efficiency and sustainability in building projects.
1. Introduction
The success of construction projects is largely dependent on their efficient administration. Construction projects are prone to unforeseen events, wasteful and unnecessary expenditures, and overspending, which can raise the risk of project delays and errors that lower the quality of work completed [1]. Construction companies seek to improve process efficiency by streamlining workflows and focusing resources on tasks that directly impact project success while reducing costs. This is achieved through the application of the Lean Six Sigma approach. Lean Six Sigma (LSS) integrates Six Sigma and Lean concepts to reduce waste and enhance process quality. LSS can be used to find and fix inefficiencies in the construction industry, like delays, rework, and material waste. LSS uses an organized method called DMAIC (Define, Measure, Analyze, Improve, and Control) to accomplish these objectives [2].
This study’s main goal is to investigate, classify, and identify the different inefficiencies that exist in the construction sector while also developing an all-encompassing framework that is founded in lean six-sigma methodology and smart technology. The quality, cost, and schedule efficiency of lean construction methods are to be measured and contrasted using this framework [3]. The integration of Lean Six Sigma with cutting-edge technical tools like monitoring sensors, IoT solutions, and soft robotics is essential to improving the workflow efficiency of construction projects. In the study, under review, inefficiencies are found and eliminated to enhance project deadlines through the use of real-time data and automated monitoring [4]. CiteOps 25.2 software and IoT sensors were used in the study to improve real-time project parameter monitoring and enable dynamic alterations that greatly improved overall efficiency. By using these advances, the research identifies important inefficiencies in building operations and provides cutting-edge solutions to mitigate them.
The DMAIC framework finds wide application in construction optimization projects. It is often used to enhance precast manufacturing quality, identifying defects and their causes [5]. A Brazilian construction firm adopted Lean Six Sigma to restructure its management system, reducing waste and variability [6]. DMAIC was employed to improve groundwork quality, eliminating errors and inefficiencies [7]. The SME’s productivity and quality were enhanced by employing DMAIC, yielding significant improvements [8]. DMAIC was also applied to study and improve construction project performance [9]. These studies highlight DMAIC’s effectiveness across various construction processes.
Real-time and automated monitoring of several construction processes is now possible because of advancements in sensor technology and the Internet of Things (IoT) [10]. Construction waste management is made possible by real-time monitoring enabled by sensing and IoT, which improves environmental sustainability and lessens environmental impact. Sensors are positioned around construction sites to capture data in real-time, enabling continuous monitoring of many aspects such as labor productivity, machine performance, material availability, and environmental conditions [10]. Through the use of CiteOps software, the perception sensors identify inefficiencies and notify project managers of problems, including equipment failures, work-flow bottlenecks, and material delays.
In this perspective, the integration of IoT technologies with CiteOps software is especially noteworthy. As a command center, CiteOps gathers data from a range of IoT-enabled devices and provides project managers with these data in a format that they can use [10].This facilitates prompt decision-making, the capacity to predict project obstacles, and the adaptability to adjust workflows. Moreover, the program facilitates automated task execution, which enables the system to modify some procedures on its own without requiring human input. In conventional construction environments, inefficiencies like protracted lead times for material acquisition, postponed order placements, and job rework because of mistakes or misunderstanding are frequently blamed for project delays. These issues tend to compound, leading to major delays and increased project costs. Through the use of IoT sensors and real-time monitoring, the research found that such delays can be dramatically reduced [10].
2. Methodology
In order to maximize railway fence construction project performance, the research integrates cutting-edge technology, including IoT sensors and CiteOps software for real-time monitoring and problem detection. It also uses the DMAIC Lean Six Sigma framework. This framework integrates techniques for gathering and analyzing data in order to pinpoint inefficiencies, evaluate their consequences, and suggest solutions.
Phases for data gathering and analysis make up the research design. IoT sensors are integrated into the building site to track workflows, equipment, and material movements. These sensors provide feedback data to CiteOps software, which detects inefficiencies like material delays, workflow bottlenecks, and equipment problems and instantly alerts project managers.
Time studies are used to calculate the difference between planned and actual activity. The gathered data are validated using descriptive statistics, which also help to determine distribution curves, dispersion, and central tendency. The data are analyzed using the DMAIC framework, where the first stage of the framework consists of defining and identifying the cause of the problem, in this case, project inefficiencies. The value stream map is designed using Microsoft Visio; it is used to identify non-value-adding activities that could potentially result in project inefficiencies. The second stage of the DMAIC framework is the analyze phase. In this phase, the previously identified activities are analyzed and quantified to determine their impact on project inefficiencies, and they are ranked accordingly. To efficiently analyze these activities, a control chart is used to quantify these inefficiencies. Factor analysis is then used with data recovered from IoT sensors to determine the impact of these inefficiencies and rank the most significant causes of inefficiencies. The Economic Order Quantity (EOQ) model is used in the “Improve” phase of the DMAIC framework to forecast the optimum quantity and timing of material orders in order to maximize construction inventory management. For real-time performance tracking, data from sensors and manual inputs are gathered into a centralized database and presented using Microsoft Power BI. Software for scheduling and planning increases output and worker accountability, while IoT-based data helps with decision-making.
The data gathered during this time is presented in the tables and figures below. It is validated using statistical methods. Table 1 and Table 2 below show the mean, median, standard deviation, mode, variance, and range for all the project delay factors identified.

Table 1.
Description statistics for data validation.
Table 2.
Description statistics for data validation.
The data presented in Table 1 above shows the measures of central tendency, such as the mean, median, and the mode, for lead time, delays in ordering time, as well as the number of days it takes to complete assigned tasks. The mean signifies the average value of each of the factors presented in the tables. This is the balance point of the dataset, the typical value and behavior of the dataset.
The median is the middle value of the dataset for each of the factors presented in Table 1. This is the point where the dataset is divided into two parts; half of the values lie below these values, and the other half lie above this value. This is important for skewed distributions. The mode shows the most common value in the dataset; this is also presented in Table 1. It is used to describe the most typical observation.
Factors such as inspection delays, training days, delays due to changes in weather, and limited equipment availability are shown in Table 2 above. Table 2 shows the measures of central tendency for these factors. These measures are used to determine the data skewness, which is presented in the figures below. It may be expected for the lead time delays, days spent on training, delays due to changes in weather, and delayed ordering time to be positively skewed and inspection delays negatively skewed.
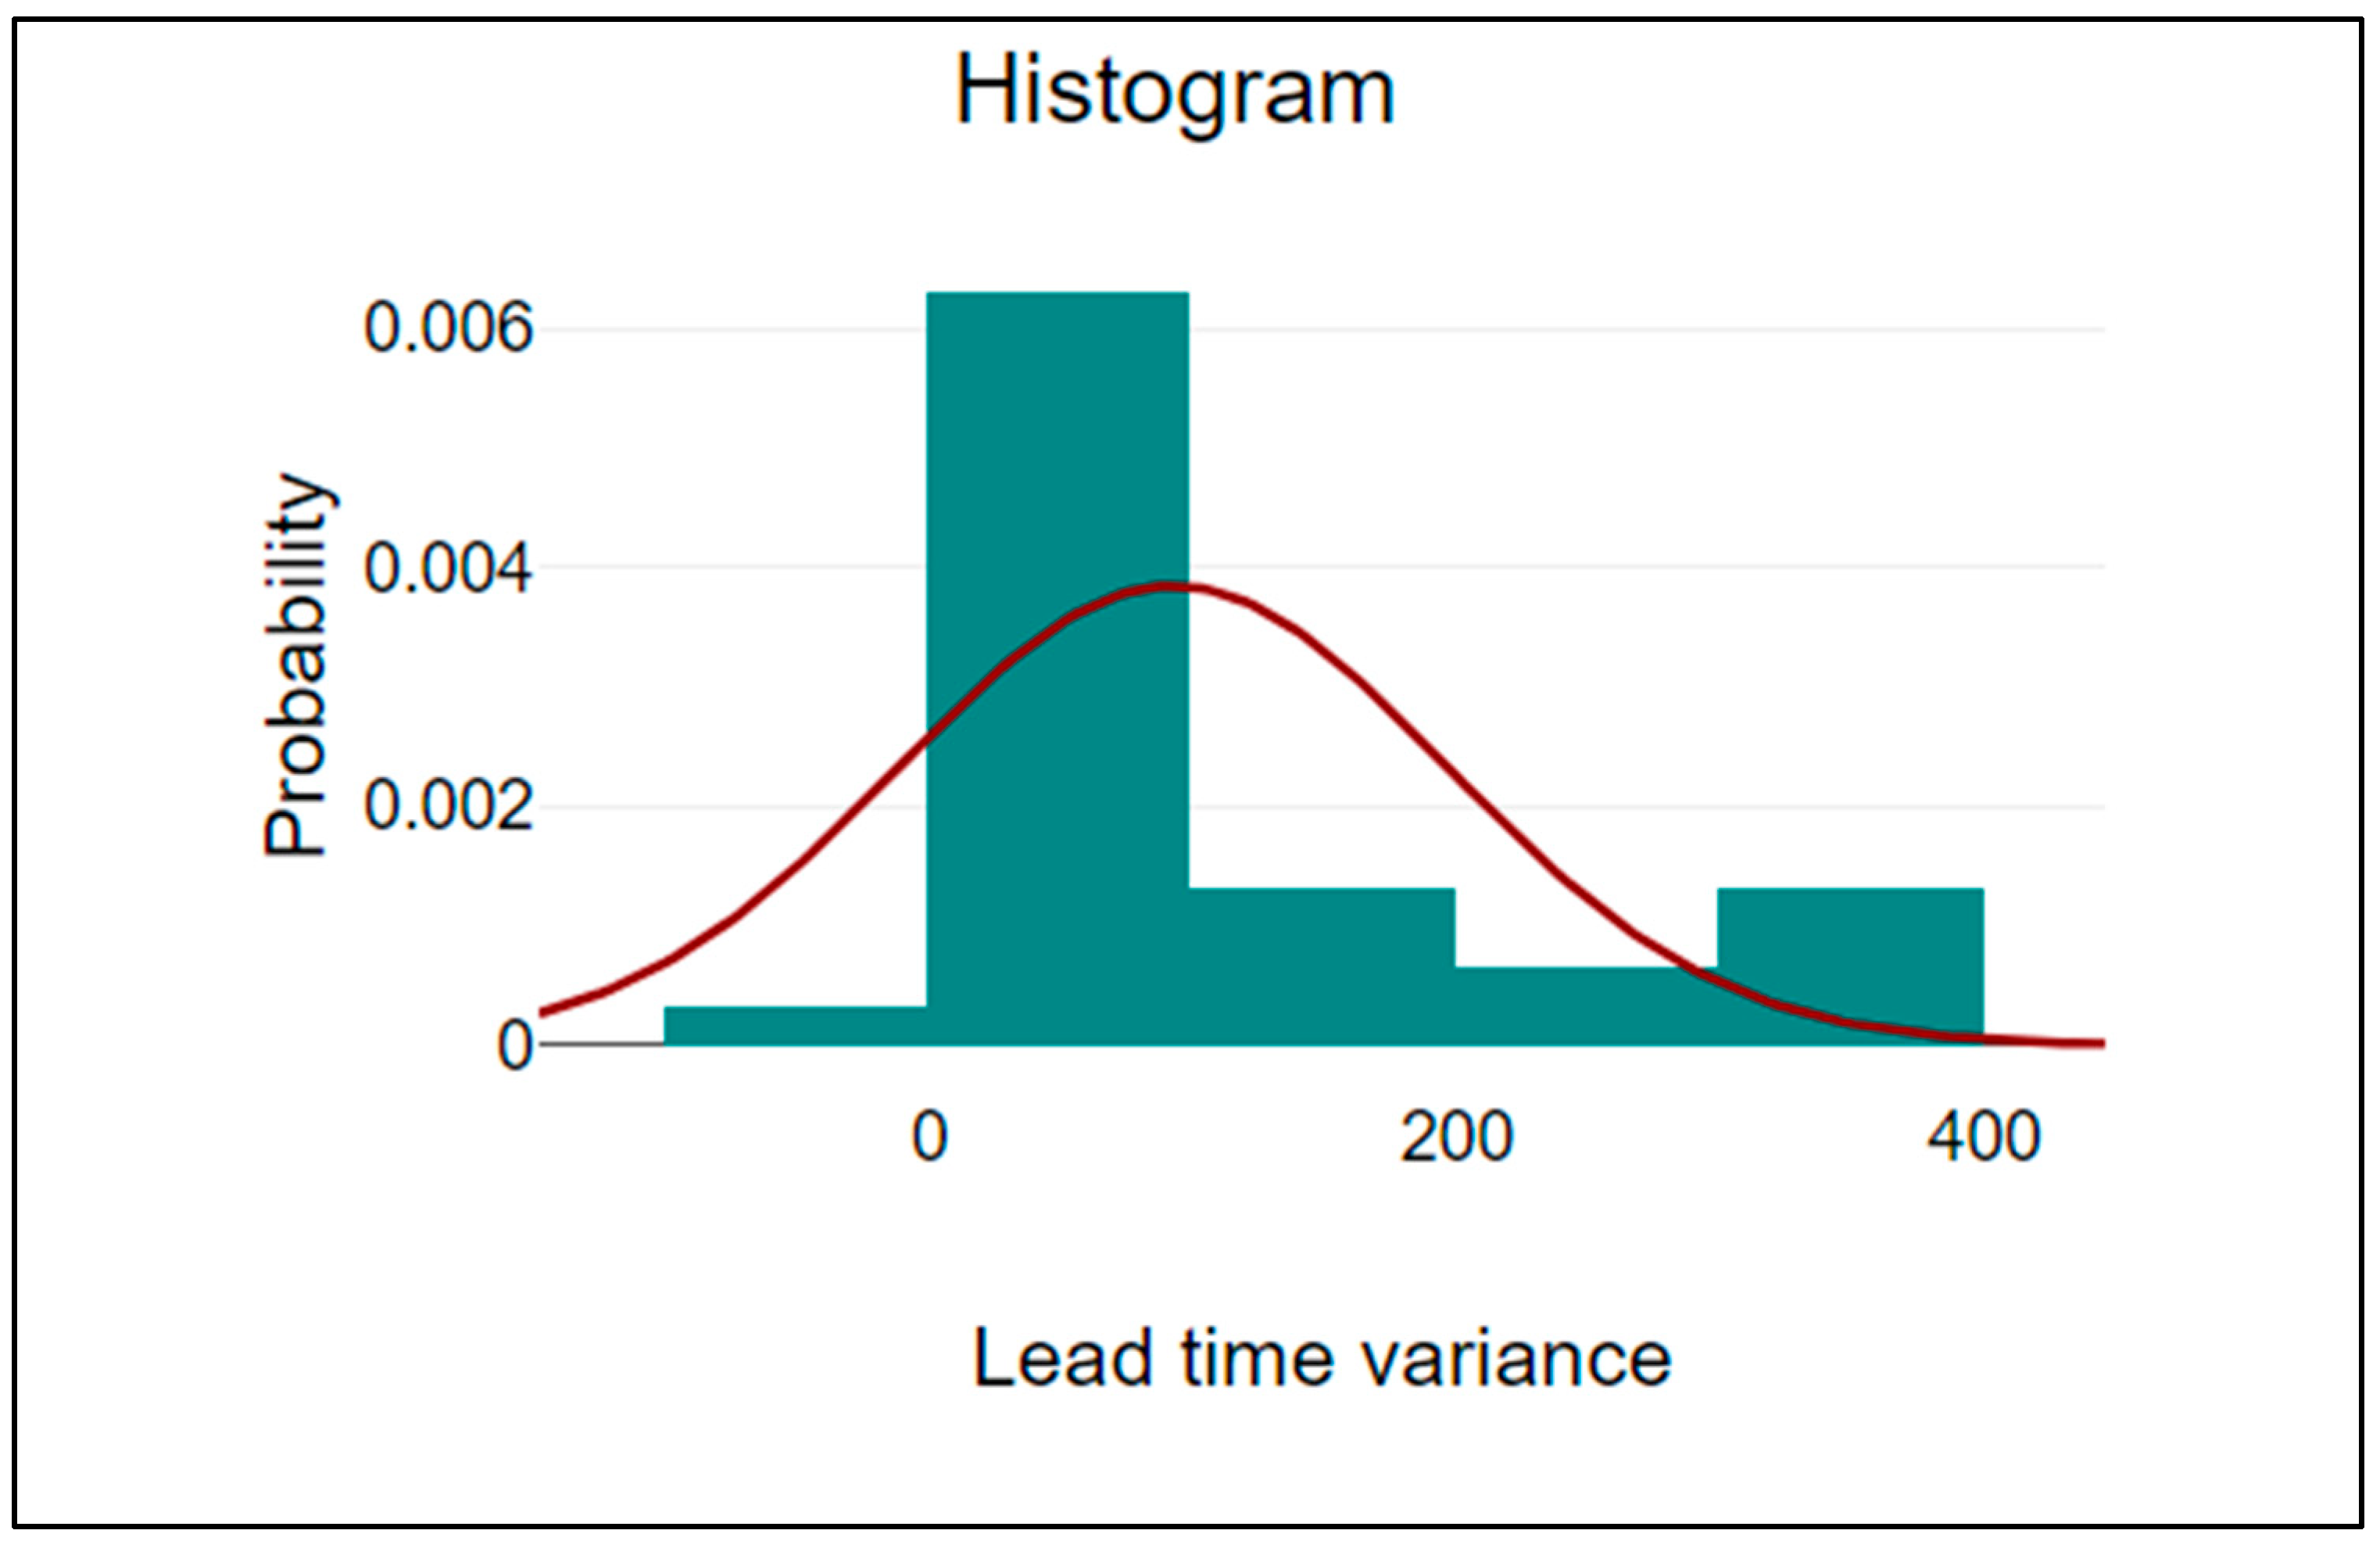
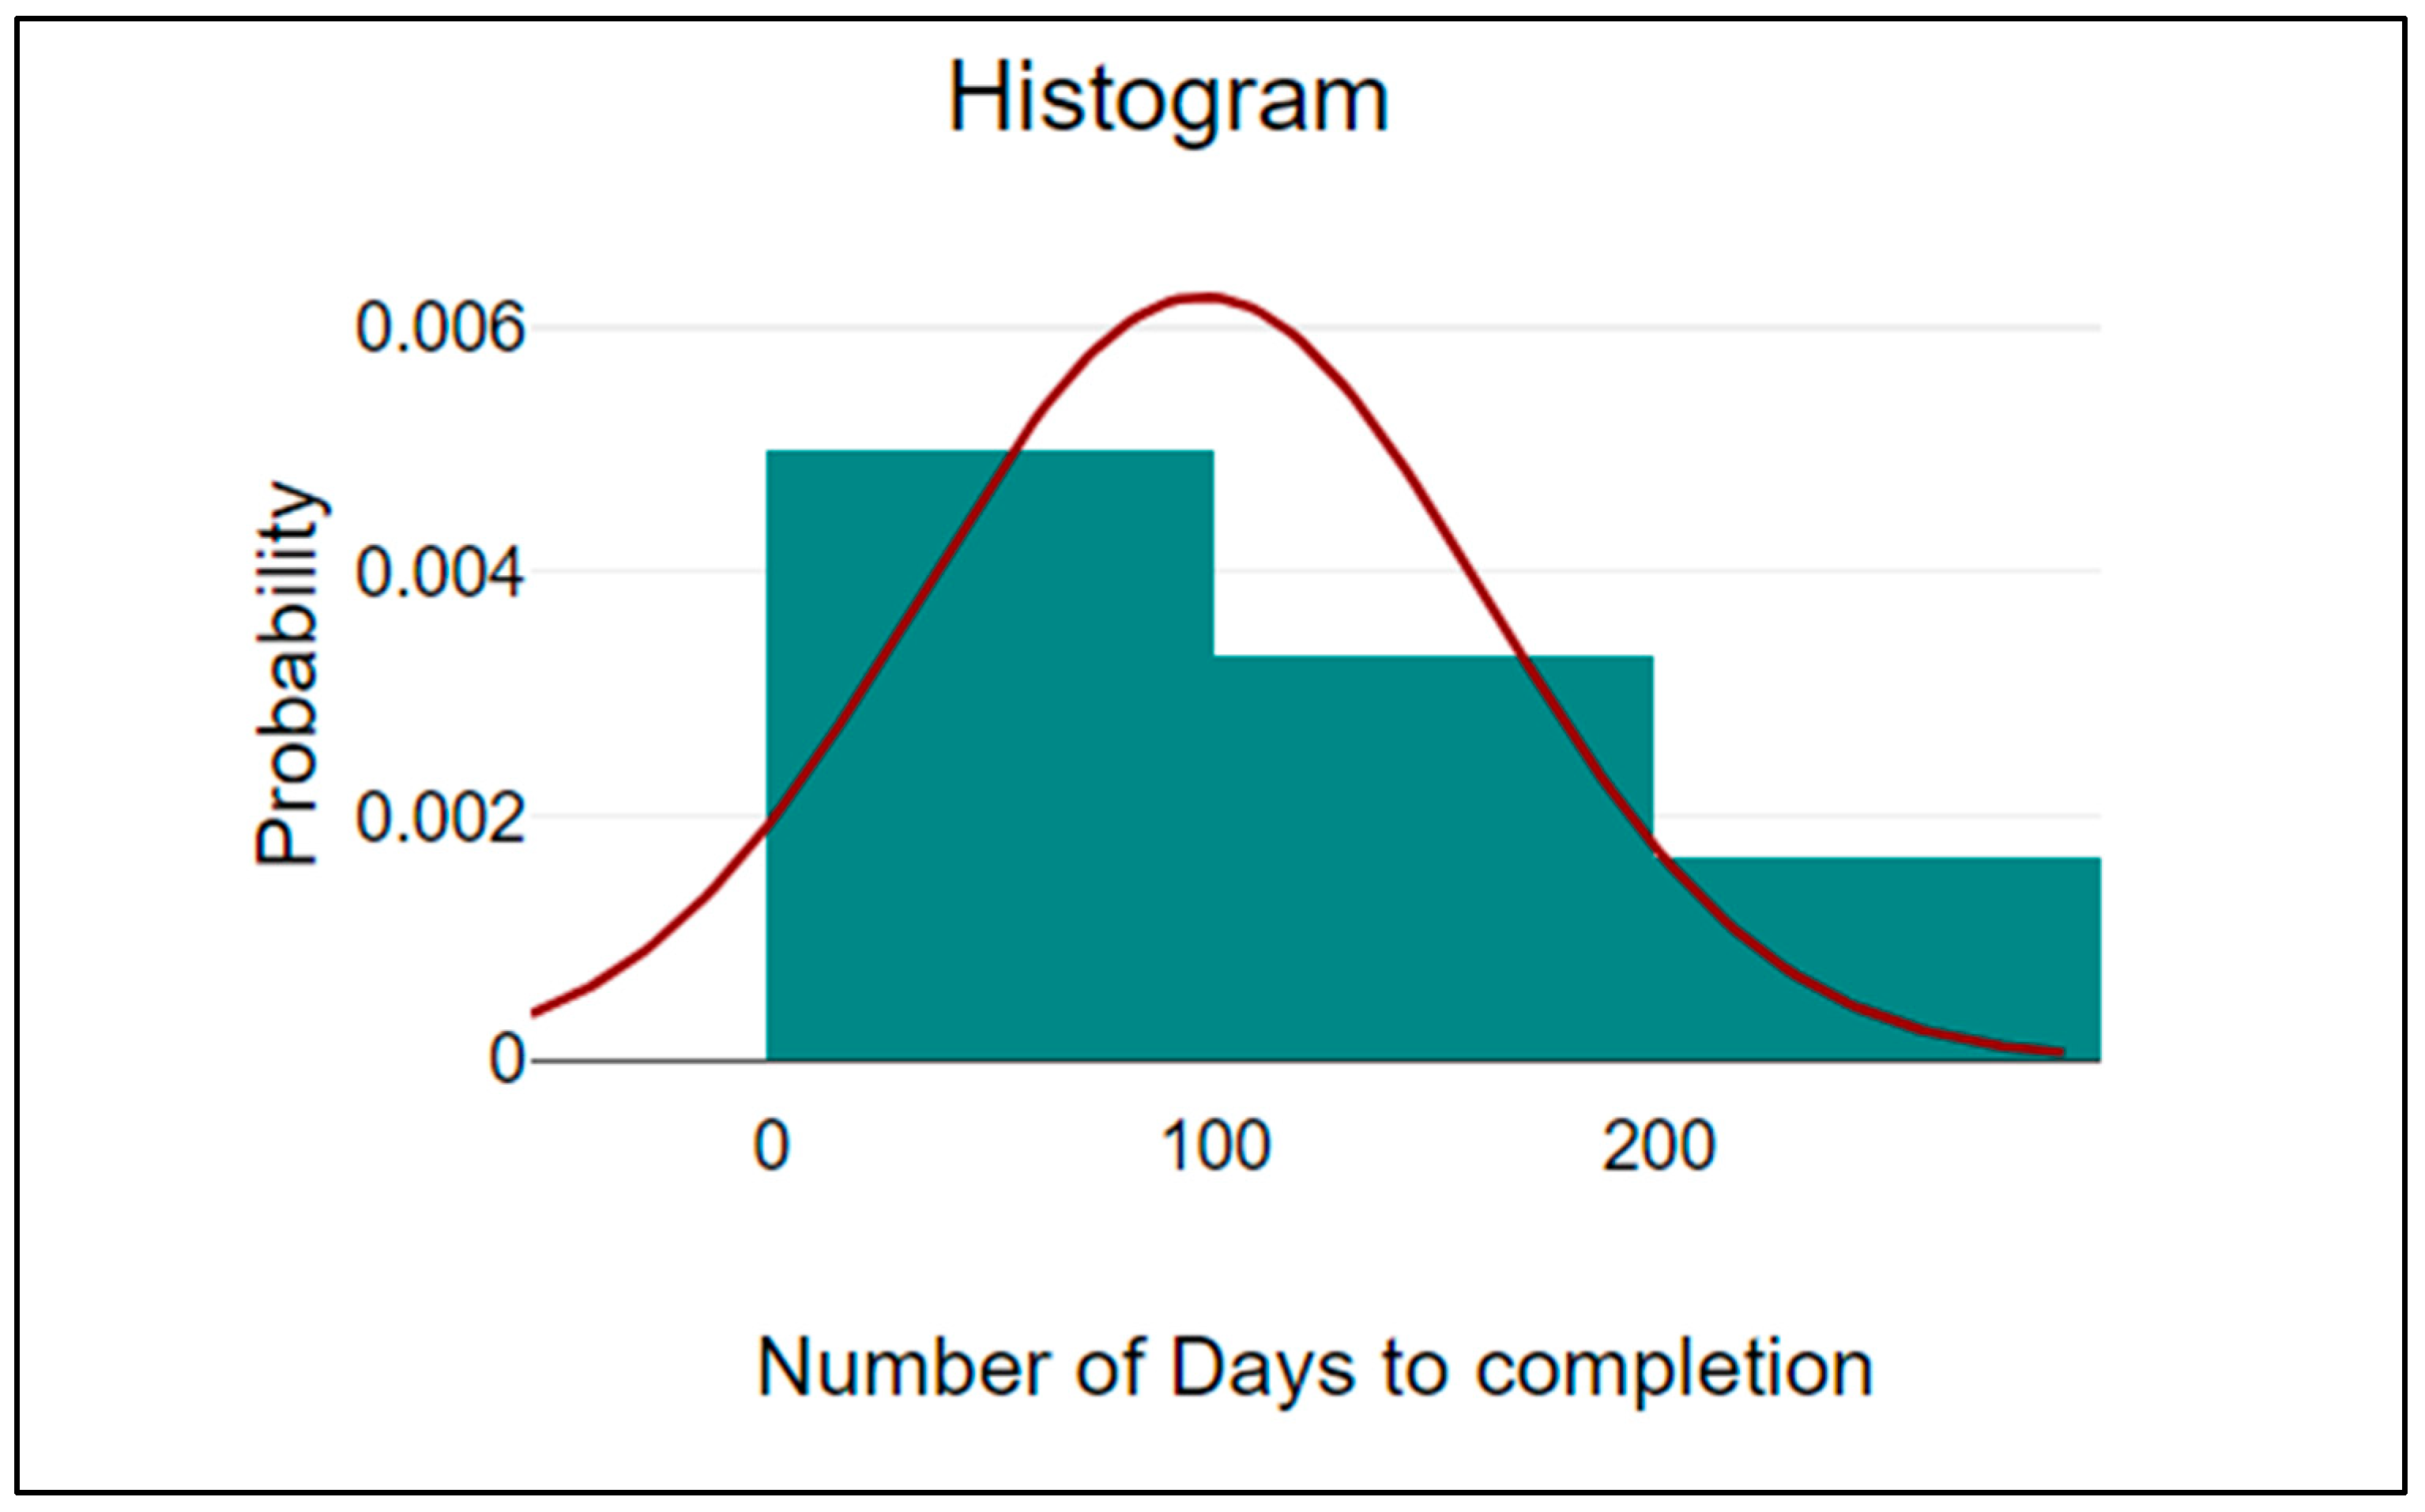
Figure 1, Figure 2 and Figure 3 present the skewness of lead time, delay in job completion, delays in order placement, and equipment availability. All these figures indicate that the data for these factors is positively skewed. In this case, it is expected for the mean to be greater than the median and the mode. There may be a few outliers pushing the mean higher than the median. The skewness of the data indicates that the distribution is not symmetrical, and the bulk of the data are concentrated towards the lower end, with a few exceptionally high values on the right side.

Figure 1.
Histogram showing positive skewness for lead time variance.
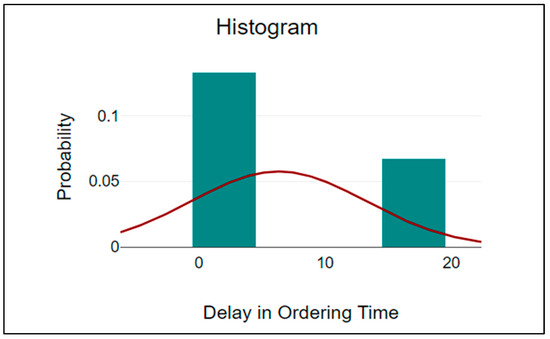
Figure 2.
Histogram showing positive skewness for delays in ordering time.
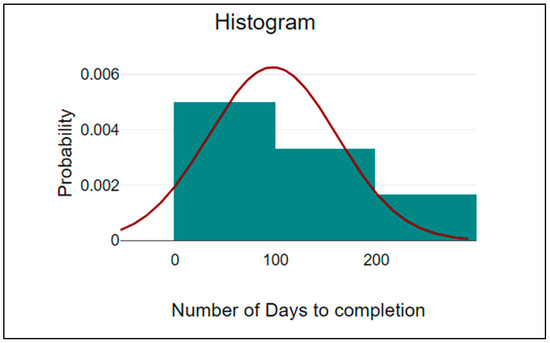
Figure 3.
Histogram showing positive skewness for number of days to complete jobs.
Figure 4 presents the factor that consists of negatively skewed data. This skewness indicates that the distribution is also not symmetrical, and the bulk of the data are concentrated towards the higher end, with a few exceptionally low values on the left side. The skewness of the data may signify data randomness. Data typically follows a normal distribution, but imperfections in the data collection can introduce randomness. A skewness close to zero indicates a normal distribution with fewer outliers and less variation. Factors like lead time, inspection frequency, and weather conditions can introduce randomness in the dataset. This dataset’s skewness and few outliers ensure data validity.
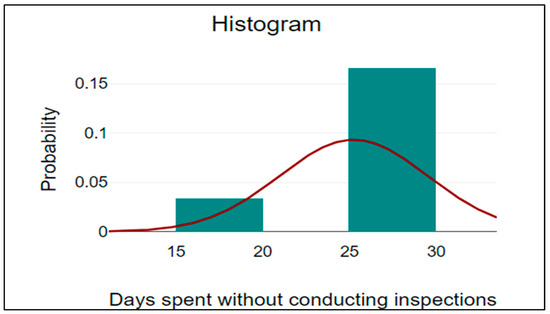
Figure 4.
Histogram showing negative data skewness for days spent without conducting inspections.
3. Results
The first phase of the DMAIC approach concentrates on defining the problem and diagnosing inefficiencies. At four crucial project stages—the design phase, excavation and clearing, foundation formation, and fence construction—waste is identified using a value stream map, or VSM. Project managers are notified of inefficiencies, including equipment failures, workflow obstructions, and material delays, when IoT sensors coupled with CiteOps software monitor equipment, workflows, and material movements in real time. Due to erroneous measurements and equipment malfunctions, the design and excavation phases saw the most delays.
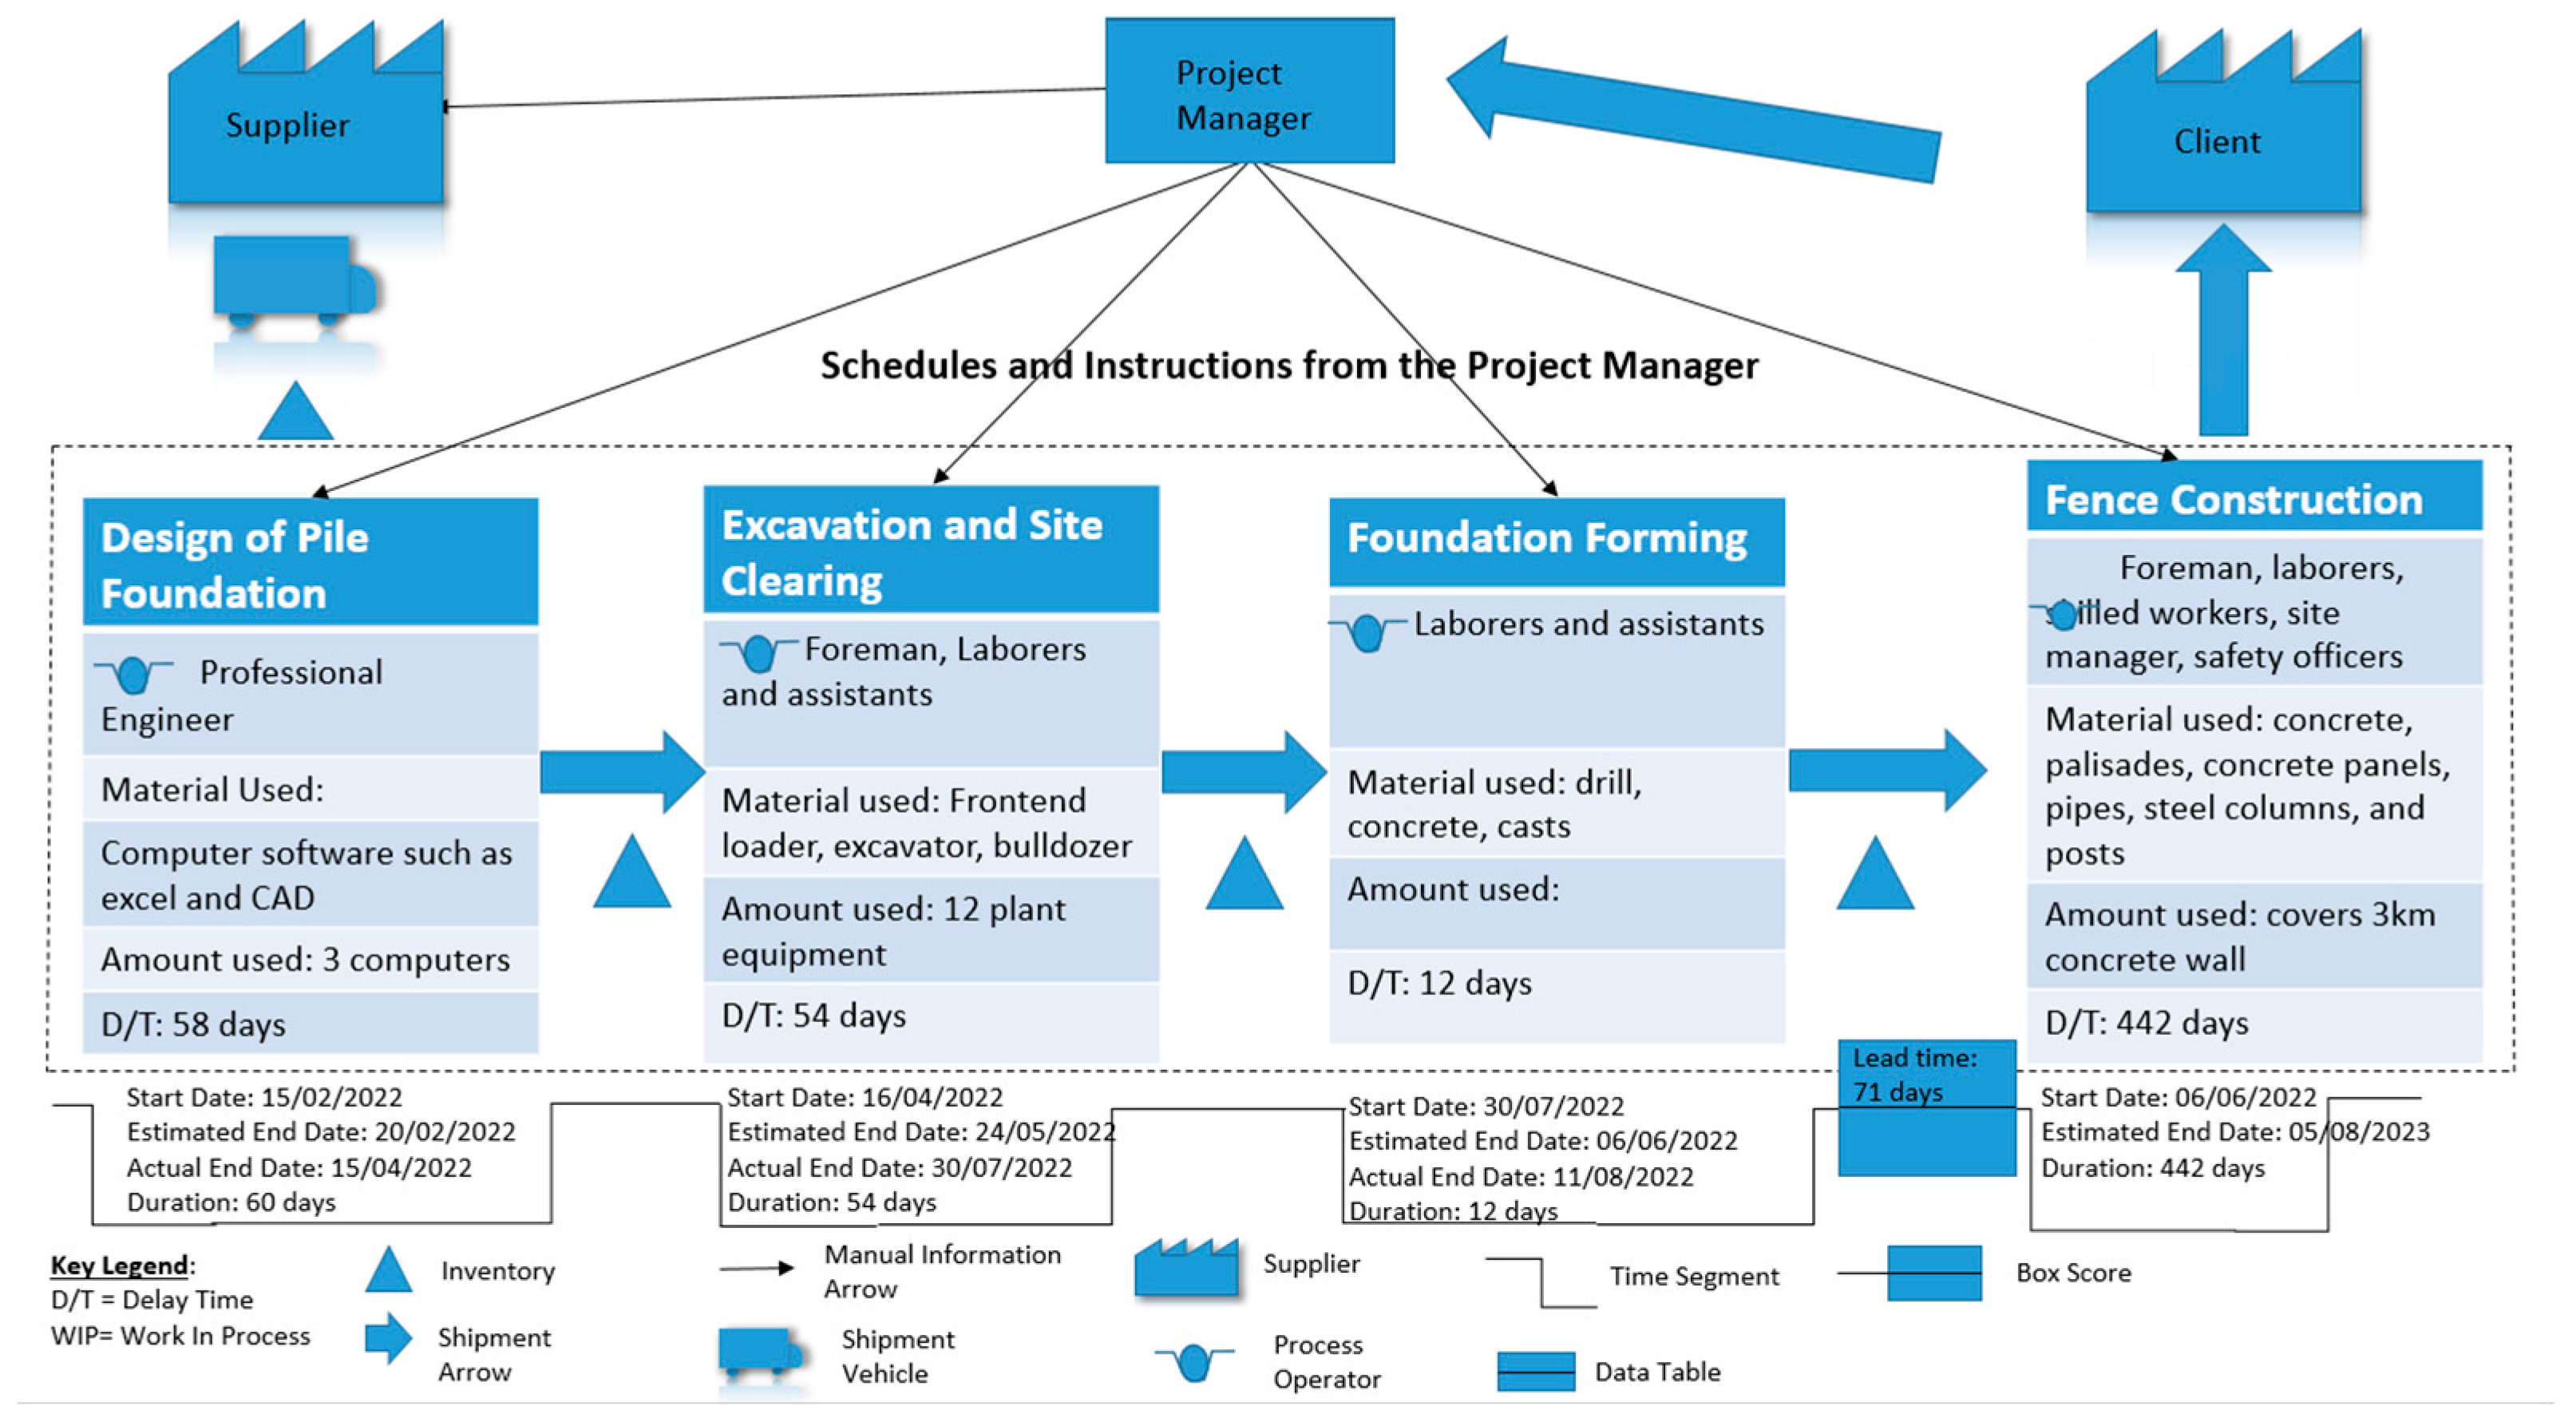
Figure 5 presents the value stream map (VSM) showing each stage of the construction project and identifying factors that could potentially introduce inefficiencies. A project redesign and a drawn-out approvals process resulted in major delays throughout the design phase. Bottlenecks in communication may have been identified sooner by IoT devices. Frequent machine breakdowns were found during the excavation phase, but delays were prolonged by unscheduled maintenance and shortages of parts. Erroneous methods caused delays in the foundation-forming phase, necessitating rework. There were also reports of other delays, such as protracted material lead times and problems with project fund release. IoT sensors were used to monitor any weather-related delays in the ongoing fence building. When combined with IoT data, the VSM in Figure 5 offers a thorough understanding of the project, empowering project managers to spot inefficiencies early on and take appropriate action to improve decision-making and cut down on delays.
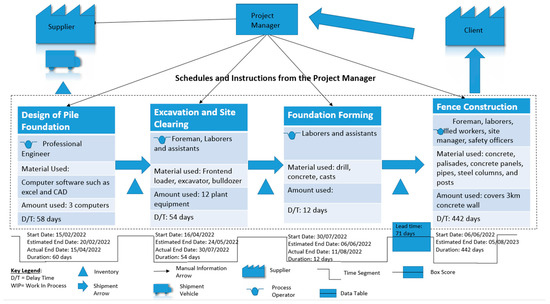
Figure 5.
Value stream map showing non-value-adding activities in the construction project.
The project involved collecting real-time data from IoT sensors to monitor equipment, material movements, and workflows. The data shown in Table 3 illustrates the number of delays per project activity. These sensors provide detailed insights into inefficiencies, such as equipment breakdowns or material shortages, and help identify, measure, and understand the extent of the problem.
Table 3.
Delay days shown for each project activity.
Control charts, shown in Figure 6, are used to visualize and analyze the delay data, plotting delay days, type of delay, mean, and lower and upper control limits. These charts help detect issues and find solutions for delays, tracking process variability to determine if a process is out of statistical control. IoT sensors continuously feed data into the CiteOps software to create these charts, capturing variations in real-time, such as sudden equipment failures. The control variation (CV) is calculated using the formula:
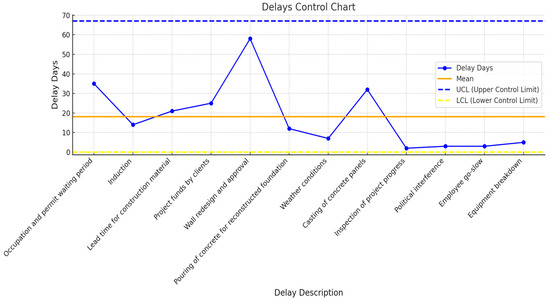
Figure 6.
Project delays quantified by means on control charts.
Which is the standard deviation ( divided by the average delay days ( multiplied by 100. This percentage gives an indication of how variable the process is. The control variation for this procedure, with an average of 18 and a standard deviation of 17, is 95%, which is much too high. The permissible deviation should ideally not go above 40%. Lean Six Sigma approaches will be used to lower the high variation and the frequency of delays, with the help of IoT sensors continuing to deliver real-time insights and enabling quicker process adjustments. Factor analysis was used in the “Analyze” phase of the DMAIC framework. The purpose of this is to identify and pinpoint the reasons behind the delays encountered in this particular project. It also involves determining the inefficiencies that have the biggest impact on the project.
The eigenvalues shown in Table 4 are important in figuring out how many elements need to be looked at in more detail. A factor is deemed irrelevant if its eigenvalue is less than one, and it is eliminated from additional analysis because it does not significantly contribute to the overall percentage variance. Finding and analyzing the elements that have the biggest effects on the variance is the main goal. Using the following formula, the percentage of variance was determined:
Table 4.
Eigenvalues for each project activity.
A factor is deemed irrelevant if its eigenvalue is less than one, and it is eliminated from additional analysis because it does not significantly contribute to the overall percentage variance. Finding and analyzing the variables that have the most effects on the variance is the main goal. It is clear from the data in Table 4 that factors 1, 2, and 3 account for the majority of the variation in total. Therefore, there will be much greater control over the entire process by lowering the variability related to these components. The project’s planning procedure will consequently see a notable improvement.
The analysis phase aims to improve the identified factors, revealing that lead time for materials significantly impacts project delays and is significantly influenced by order placement duration. In the “Improve” phase of the DMAIC framework, the EOQ model is used to calculate the optimal time and quantity for placing orders using differential equations. This model specifically assumes that items do not deteriorate over time. Notations used for the model are as follows:
- Q*:optimal quantity of inventory;
- D: demand of the inventory (How much is being used during construction);
- t: material storage time before use;
- p: purchase price for the item;
- V: quantity after the effects of demand or deterioration or both.
The company had specified a budget for material of R30 000 000 out of the total project cost of R52 000 000. Using the following information, the EOQ model is applied using Equations (3) and (4) below:
The values represented in Table 5 were determined using these formulae for frequently used inventory.
Table 5.
Recommended optimum order quantity and order time.
By utilizing T and Q*, individuals are able to ascertain the optimal timing for ordering additional materials. This strategic approach facilitates improved project planning and effectively reduces the delay period for the delivery of construction materials, thereby preventing any interruptions in the project’s progress.
The following phase in the DMAIC framework is the control phase, where the improved processes are monitored in real time and controlled. When combined with IoT sensors, CiteOps software significantly improves job management inside the company. To cut down on misunderstandings, workers are linked via a mobile app that delivers real-time notifications regarding the duties they have been allocated, as shown in Figure 7. Employees mark tasks in the app when they are finished, and each shift has a work plan. IoT sensors also keep an eye on the status of the workflow and the equipment, automatically sending data into the system to give updates on task completion and equipment conditions. The job schedule shows managers and supervisors how activities are completed visually and includes sensor input. The schedule can be viewed remotely. Tasks that are not finished are indicated, and sensors identify delays or malfunctions in the machinery, allowing workers to explain their work and management to take immediate action. This system provides precise workflow status data, which facilitates early problem diagnosis, accountability, and productivity gains. The organization guarantees productivity and timely work completion through the use of sensor data and remote task monitoring.
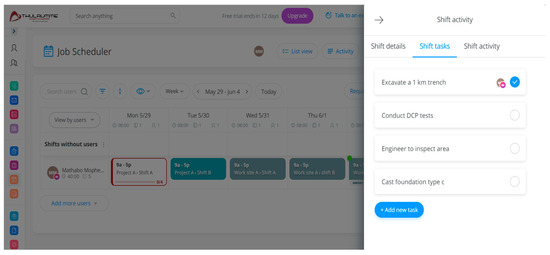
Figure 7.
CiteOps job scheduler.
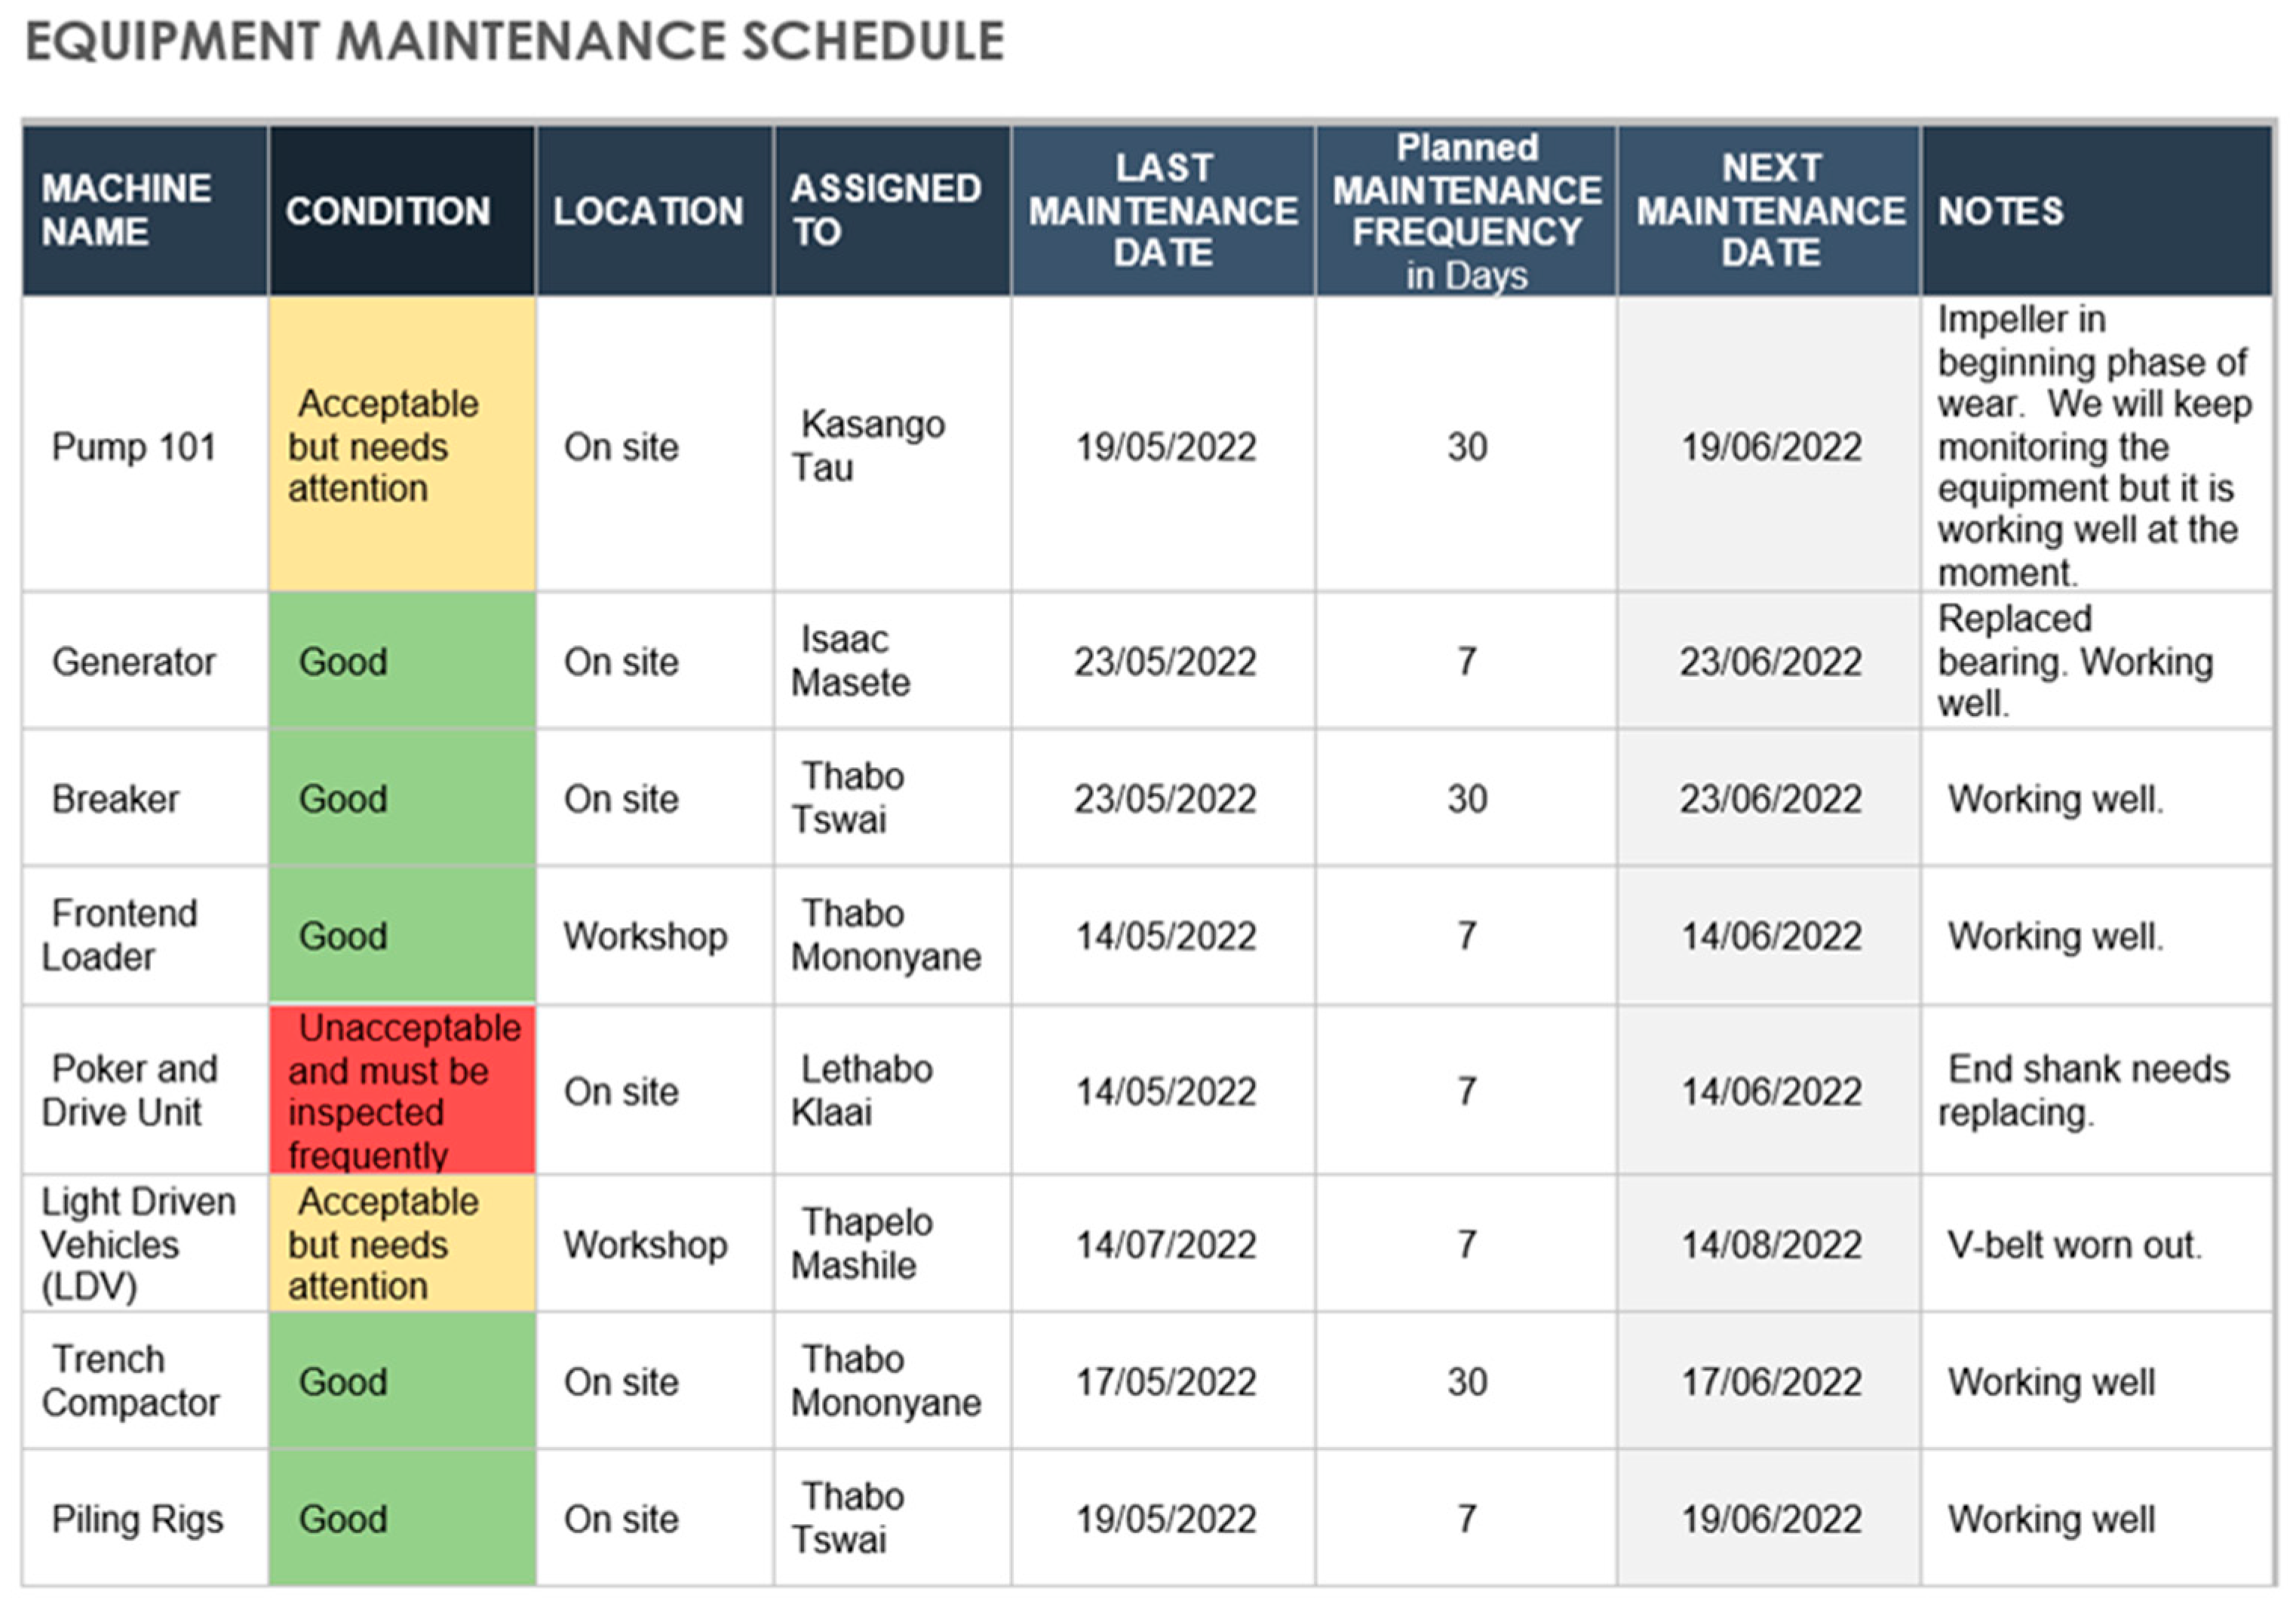
Figure 8 is an essential monitoring tool for managing equipment use and maintenance at the project site when combined with IoT sensors and CiteOps software. IoT sensors automatically monitor the state of the equipment and send real-time data to the platform, allowing for the early detection of problems that need maintenance or repairs. This system keeps track of the condition of critical spare parts and creates a thorough timetable to guarantee prompt maintenance, lowering the chance of malfunctions. IoT sensors allow a proactive strategy that maximizes equipment efficiency and reduces downtime. Authorized staff may monitor the status of the equipment and the progress of maintenance in real-time from remote locations, which helps them respond quickly to crises or urgent repairs. The importance of routine inspections is highlighted by the sensors, which monitor wear and tear and send data into Figure 8 for proactive maintenance and documentation. In summary, the incorporation of sensors with Figure 8 facilitates efficient equipment management, lowers malfunctions, and boosts operational effectiveness via automated tracking and real-time monitoring, guaranteeing better equipment longevity.
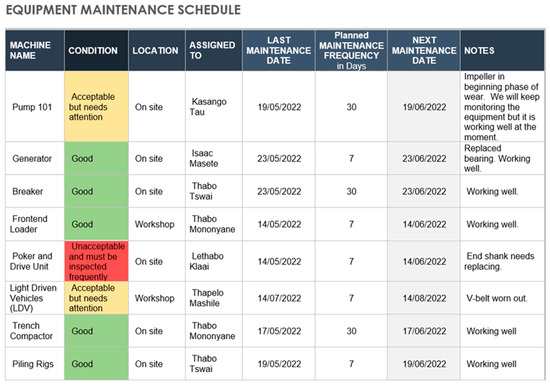
Figure 8.
CiteOps equipment maintenance schedule. The colour codes symbolize the condition of the equipment where red symbolizes unacceptable, yellow symbolizes acceptable but needs attention and green shows that the machine is in good condition.
4. Conclusions
CiteOps software was used to improve employee management in a construction project, enhancing communication and coordination among team members. The software allows on-site supervisors to assign tasks and track progress in real-time, preventing delays or inefficiencies. It also tracks employee productivity, providing insights into bottlenecks and areas needing additional training. Regular meetings foster accountability and teamwork, leading to improved overall performance. To address inefficiencies, a modified Lean Six Sigma DMAIC framework was implemented, highlighting factors like material availability, equipment delays, and insufficient inspections. An Economic Order Quantity model was created to optimize material orders and minimize delays. IoT sensors were used to remotely track progress, ensuring timely interventions and reducing over-inspections. This integrated method lowers delays, boosts project oversight, and increases overall building process efficiency by fusing real-time IoT sensor data with DMAIC.
Author Contributions
Conceptualization, M.M. and M.A.; Software, M.M.; validation, M.M. and M.A.; formal analysis, M.M.; investigation, M.M.; resources, M.M.; data curation, M.M.; writing–original draft preparation, M.M.; writing–review and editing, M.M. and M.A.; visualization, M.M.; supervision, M.A.; project administration, M.M. All authors have read and agreed to the published version of the manuscript.
Funding
This research received no external funding.
Institutional Review Board Statement
Not applicable.
Informed Consent Statement
Not applicable.
Data Availability Statement
The data that supports this study can be found in the following link: https://doi.org/10.25403/UPresearchdata.25370374.v1 (accessed on: 29 August 2024).
Conflicts of Interest
The authors declare no conflict of interest.
References
- Van den Bos, A.; Kemper, B.; de Waal, V. A study on how to improve the throughput time of lean six sigma projects in a construction company. Int. J. Lean Six Sigma 2014, 5, 212–226. [Google Scholar] [CrossRef]
- Al-Aomar, R. A Lean Construction Framework with Six Sigma Rating. Int. J. Lean Six Sigma 2012, 3, 299–314. [Google Scholar] [CrossRef]
- Abdelhamid, T. Six Sigma in Lean Construction Systems: Opportunities and Challenges. In Proceedings of the 11th Annual Conference for Lean Construction, Blacksburg, VA, USA, 22–24 July 2003; pp. 55–86. [Google Scholar]
- Rane, N.; Choudhary, S.; Rane, J. Artificial Intelligence (AI) and Internet of Things (IoT)—Based Sensors for Monitoring and Controlling in Architecture, Engineering, and Construction: Applications, Challenges, and Opportunities. SSRN, 2023. Available online: https://papers.ssrn.com/sol3/papers.cfm?abstract_id=4642197 (accessed on 29 August 2024).
- Agenbag, H.; Amoah, C. The impact of modern construction technology on the workforce in the construction industry. In Proceedings of the ASOCSA 14th Built Environment Conference, Durban, South Africa, 21–22 September 2021; IOP Conference Series: Earth and Environmental Science. pp. 1–10. [Google Scholar]
- Bravo, M.; Euphrosino, C.; Fontanini, P. DMAIC manual for an integrated management system: Application in a construction company. In Proceedings of the 28th Annual Conference of the International Group for Lean Construction, Berkeley, CA, USA, 6–10 July 2020; Volume 28, pp. 169–181. [Google Scholar]
- Nowotarski, P.; Szymanski, P.; Rzepecka, P. DMAIC method of quality improvement of ground works processes: Case study. In Proceedings of the World Multidisciplinary Earth Sciences Symposium, Prague, Czech Republic, 3–7 September 2018; IOP Conference Series: Earth and Environmental Science. pp. 61–131. [Google Scholar]
- Soundararajan, K.; Reddy, K. Productivity and quality improvement through DMAIC in SME. Int. J. Product. Qual. Manag. 2020, 31, 271–294. [Google Scholar] [CrossRef]
- Maryam, M.; Tehrani, I. Performance improvement in construction project based on six sigma principles. Int. J. Lean Six Sigma 2010, 5, 66–105. [Google Scholar]
- Bucchiarone, A.; De Sanctis, M.; Hevesi, P. Smart Construction: Remote and Adaptable Management of Construction Sites through IoT. Internet Things Mag. 2019, 4, 38–45. [Google Scholar] [CrossRef]


Disclaimer/Publisher’s Note: The statements, opinions and data contained in all publications are solely those of the individual author(s) and contributor(s) and not of MDPI and/or the editor(s). MDPI and/or the editor(s) disclaim responsibility for any injury to people or property resulting from any ideas, methods, instructions or products referred to in the content. |
© 2024 by the authors. Licensee MDPI, Basel, Switzerland. This article is an open access article distributed under the terms and conditions of the Creative Commons Attribution (CC BY) license (https://creativecommons.org/licenses/by/4.0/).