Abstract
Based on the crack propagation rate test of LY12CZ aluminum alloy flat plate, the distribution characteristics of Paris formula parameters were characterized by the three-parameter logarithmic normal distribution, and a LY12CZ random crack propagation analysis method was established. By using the Monte-Carlo method to simulate the randomness of crack growth, a prediction model of the random crack propagation life of a thin porous plate with multiple site damage (MSD) was established and programmed. The model can accurately predict the crack growth life and failure probability of thin porous plates with MSD, which provides an effective engineering analysis method for the MSD evaluation of the thin plate structure with multiple holes.
1. Introduction
Multiple site damage (MSD) often occurs in the multi-detail structure of aircrafts, such as fuselage panel structures with a large number of rivet holes and the joint of bolt holes, which will seriously reduce the residual strength of the structure and pose a great threat to the structural safety of the aircraft. In actual use, a large number of aircraft structures have damage defects, and assembly defects, and have experienced multiple incidences of damage caused by various damage sources. Therefore, it is of great engineering significance to carry out multi-crack growth analysis and predict the crack growth life of MSD structure [1,2,3].
Based on the single crack propagation test of LY12CZ aluminum alloy, the random characteristics of parameters related to crack propagation rate were studied; a probabilistic model for crack propagation life of multi-damage structures with holes was established and programmed; the random life of crack propagation under different stress levels was calculated and analyzed; and the failure probability curve of the structure was established.
2. Crack Growth Rate Test
In order to research the fatigue crack propagation characteristics of LY12-CZ aluminum alloy, a LY12-CZ aluminum alloy thin plate was prepared, a round hole with a diameter of 3 mm was made in the center of the thin plate, and an incision with a length of 3.5 mm was prefabricated on the left and right sides of the round hole. The size of the specimen is shown in Figure 1.
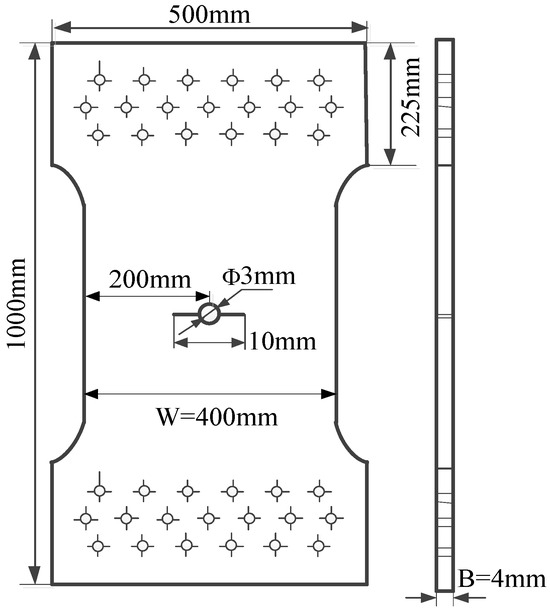
Figure 1.
Size of test specimen.
The test specimen was installed on a 1000 kN Instron8801 hydraulic servo fatigue testing machine for the fatigue test. When a crack of 1 mm was generated in the incision, the crack growth rate test was carried out. ai-Ni test data of the cracks on both sides of the hole were recorded every 5000 cycles until the specimen broke. The test load is as follows: the maximum load Pmax = 90.7 kN, the stress ratio R = 0.06, the load spectrum is sinusoidal wave of constant amplitude, and the loading frequency f = 10 Hz.
A total of six specimens were tested. ai-Ni test data of all specimens are shown in Figure 2. It can be seen that the crack growth dispersion of the right and left side of the hole in the same specimen is small, while the crack growth of different specimen has a certain dispersion. The five-point increasing polynomial method was used to process the ai-Ni test data [4], the crack growth rate (da/dN)i was calculated, and the variable range of crack stress intensity factor is calculated as follows:
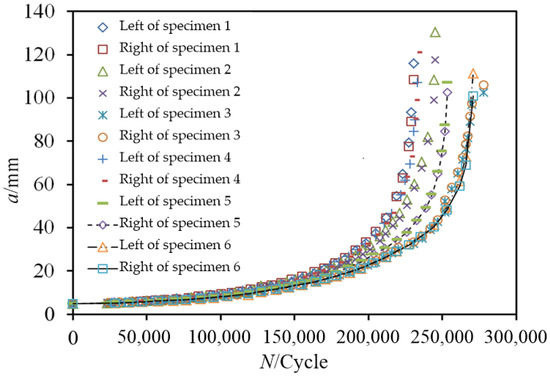
Figure 2.
Crack growth test data.
In Formula (1), F is the comprehensive shape factor, and the specific value is obtained by querying the Stress Intensity Factor Manual [5]; ΔP = Pmax − Pmin.
3. Prediction Model of Random Crack Propagation Life
3.1. Crack Propagation Parameter Calculation
Paris–Erdogan model is the most widely used fatigue crack growth rate model in engineering.
In Equation (2), Ci and ni are the crack growth rate parameters. The randomness in the crack growth process is simulated by controlling Ci and ni. Taking logarithms of both sides of Equation (2), there is a linear relationship between the logarithmic crack growth rate lg (da/dN) and the vari-range logarithmic lg (ΔK) of the crack tip stress intensity factor, namely:
After da/dN and ΔK data are obtained, the crack propagation parameters Ci and ni can be calculated by linear regression analysis. As shown in Figure 3, the analytical results of the crack on the left side of specimen 1.
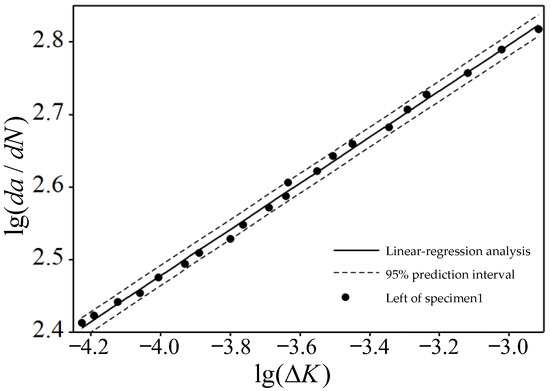
Figure 3.
Linear relationship of lg(da/dN)−lg(ΔK) of crack on the left side of specimen 1.
After the above processing and analysis of the test data of the remaining specimens, the fatigue crack growth formula parameters ni and lgCi values of each specimen can be obtained. The fitting results of the crack growth rate parameters of all specimens are shown in Table 1.

Table 1.
The fitting results of crack growth rate parameters.
3.2. Random Crack Growth Model
Linear regression analysis was performed on fatigue crack growth parameters n and lgC in Table 1 (as shown in Figure 4), and it was found that the crack growth characteristics of LY12CZ aluminum alloy were the same as those of other materials [6,7]. Also, there was a strong linear relationship between the two fatigue crack parameters. The linear relationship between the fatigue crack propagation parameters of LY12CZ aluminum alloy was obtained by fitting.
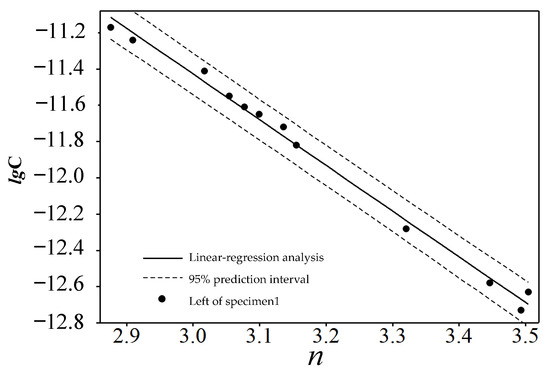
Figure 4.
Linear relationship of n−lgC.
The three-parameter lognormal distribution can well express the variability of the random parameter ni, and its probability density function is expressed in the form of the three-parameter lognormal distribution [8].
In Equation (5), is the positional parameter, is the shape parameter, and is the dispersion parameter. According to the parameter estimation method of three-parameter lognormal distribution proposed in the literature [9] and the test data in Table 1, the parameters are estimated as follows:
According to the correlation properties of normal distribution, the random value of fatigue crack growth parameter ni can be obtained by Equation (7).
In Equation (7), n0i is the random number generated by the random generator, which follows the standard normal distribution, and the lower corner mark 0 indicates the initial value of ni. After the random parameter ni is obtained, the random value of the parameter Ci is obtained by combining with Formula (3).
3.3. Residual Strength Evaluation
The residual strength evaluation of MSD structures is one of the key problems in crack propagation life prediction. The failure of a multi-crack structure should take into account both the instability failure of local cracks and the failure of the whole structure. Therefore, both the net section yield criterion and the critical stress intensity factor criterion should be considered when evaluating the residual strength of an MSD structure.
The true stress of the cracked structure is as follows:
In Equation (8), An and Ag are the net area and gross area of the section where the crack is located, respectively; σ is the distal stress.
When the true stress σ′ of the structure is greater than the yield stress of the material, or the K value of the crack ai is greater than KIC, the number of cycles is the crack growth life of the structure. According to the manual, the fracture toughness of LY12-CZ is generally between 33 and 37 MPa [10]. For the sake of conservatism, the minimum value is 33 MPa.
3.4. Multiple Crack Interaction Propagation
The problem of mutual interference in multiple crack propagations is analyzed by cyclic load separation method, and the crack propagation life is predicted by this method. The length of crack growth in the same cycle interval is calculated until the crack grows to the point that the structure does not meet the residual strength, which is the crack growth life. The derivation of the Paris formula used in the calculation of the life prediction is as follows:
In Equation (9), the multi-crack stress-intensity factor variation ΔK can be obtained by combining method [11,12], and the calculated expression is as follows:
In Equation (10), f is the comprehensive configuration factor of the MSD structure, which is based on the basic principle of the combination of continuous multiplication, as follows:
In Formula (11), fh is the boundary correction factor of the crack initiation to crack; foh is the boundary correction factor of several holes adjacent to the crack tip to crack; fw is the boundary correction factor of the finite plate width to crack; fl is the boundary correction factor of the finite plate length to crack.
When the structure is subjected to uniform tensile stress, the expressions of each boundary correction factor can be obtained from the Stress Intensity Factor Manual and the literature [13,14].
By integrating Equation (9), Equation (12) can be obtained.
3.5. Prediction of Crack Propagation Life by Monte-Carlo Method
The prediction model of the random crack growth life of MSD structures is established by using the analysis method proposed in Section 3.1, Section 3.2 and Section 3.3 and the Monta-Carlo method. The main steps are as follows:
- (1)
- Building the calculation model according to the geometric dimensions.
- (2)
- The stress intensity factor K and its variation were calculated by using the combination method.
- (3)
- A set of random numbers conforming to the standard normal distribution is generated by the random number generator. The random number and a given number of cycles are obtained by Equations (3) and (7). The propagation length of each crack in the cycle is calculated by Equation (12).
- (4)
- According to the crack propagation length, the calculation model is modified, so as to enter the next cycle. The condition of the exit calculation is the residual strength evaluation method described in Section 3.3, and the simulated crack growth life can be obtained.
- (5)
- Repeat the above calculation for L times and obtain (j = 1, 2, …, L) life data, and the logarithmic life mean and logarithmic life variance of the structure can be obtained by calculating the data results.
The calculation program is compiled according to the above steps, and the relevant examples are calculated and analyzed.
4. Analysis of Examples
The multi-hole structure has similar details, which is easy to produce MSD, and the crack size is not different. The typical riveted panel structure of the aircraft–finite collinear seven-hole symmetric crack plate structure is used to simulate the calculation, and related tests are carried out. For the studied collinear seven-hole plate (hole serial number from left to right is 1~7; each side of the seven holes has the same length of prefabricated cracks), the geometric size is shown in Figure 5, and the material is LY12CZ. Multiple crack propagation tests were carried out on the same size test pieces, and the a-N data of each crack was recorded during the test. The stress level and test results are shown in Table 2.
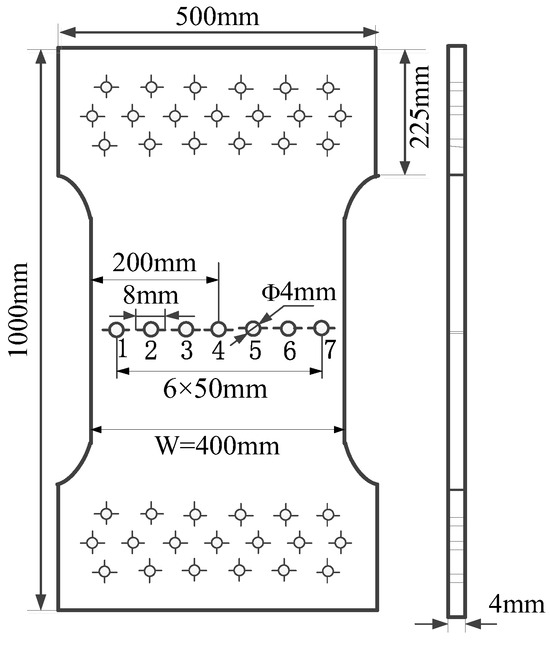
Figure 5.
Geometric size of the col linear seven−hole plate structure.
Table 2.
Test stress level and results.
After the completion of the test, 10,000 sample simulation calculations were carried out on the structure using the calculation program established above. The center hole of structural symmetry, namely, hole-4, was studied and analyzed, and the simulation calculation data of the maximum, median, and minimum life in the simulation calculation results were selected for comparison and analysis with the test data. Figure 6 shows the a-N test data and simulation calculation results of cracks on both sides of hole-4 under three different stress levels. It can be seen from Figure 6 that the random crack growth life prediction model can simulate well the crack growth characteristics and the dispersion under different stress levels.
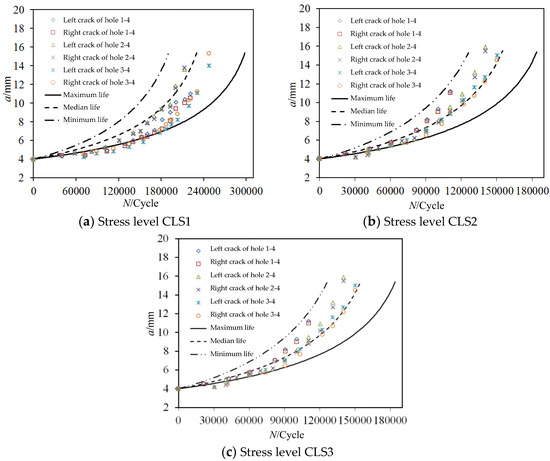
Figure 6.
a-N test data and simulation results of cracks on both sides of center hole under different stress levels.
The distribution of the simulated crack growth life N of the seven-hole plate structure under three different stress levels is shown in Figure 7. By comparing the logarithmic life mean and logarithmic life standard deviation with the test values, it is proved that the calculation model is accurate to calculate the crack growth life of the structure. The calculation results are shown in Table 3.
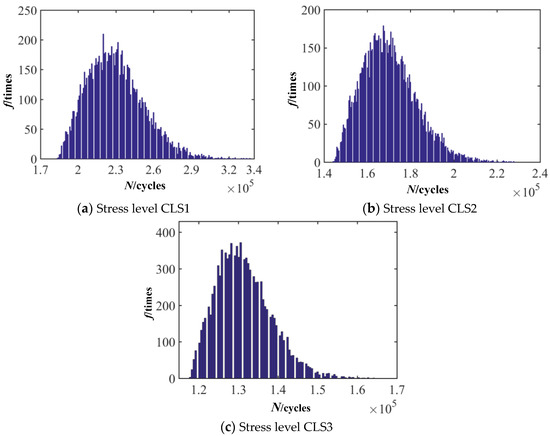
Figure 7.
Simulated calculation of crack propagation life distribution of seven-hole plate under different stress levels.
Table 3.
Comparison of calculation results and test results of seven-hole plate.
It can be seen from Table 3 that with the increase in stress level, the crack growth life of the structure decreases significantly, which indicates that the stress has a significant effect on the crack growth life of the MSD structure with multiple holes. Figure 8 shows the cumulative probability of structural crack growth life under three stress levels. The cumulative probability curve of the underwater crack growth life of the three stresses, from which the failure probability P and the reliability 1-P of the specific life can be obtained.
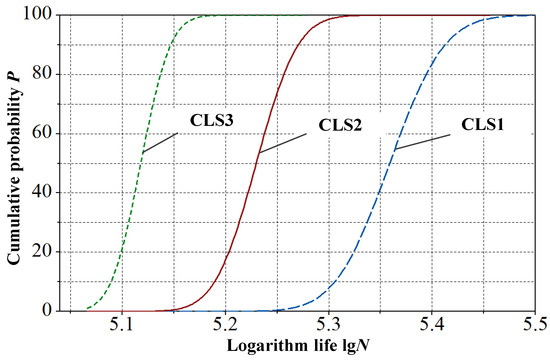
Figure 8.
Failure probability of crack propagation of MSD seven-hole plate under different stress levels.
5. Discussion and Conclusions
Through the crack growth rate test of aluminum alloy LY12CZ, parameters C and n of the Paris formula were calculated. Through research and analysis, it was found that there was a strong linear relationship between parameters n and lgC. Based on this, a random crack growth model was established by using the correlation probability analysis method. The randomness of crack growth was simulated by the Monte-Carlo method. The residual strength evaluation method of MSD structures was used to obtain the crack growth life of the structure failure, and the prediction model of the random crack growth life of MSD structures with multiple holes was established. The model can effectively and accurately calculate the crack propagation life of MSD structures with multiple holes and establish the failure probability curve of their lifespans, through which the failure probability and reliability of their specific lifespans can be obtained.
Author Contributions
Writing—review and editing, H.S.; data curation, X.C.; investigation J.Y. All authors have read and agreed to the published version of the manuscript.
Funding
This research received no external funding.
Institutional Review Board Statement
Not applicable.
Informed Consent Statement
Informed consent was obtained from all subjects involved in the study.
Data Availability Statement
Data are contained within the article.
Conflicts of Interest
Authors are employed by the company China Aviation Industry Corporation and declare that the research was conducted in the absence of any commercial or financial relationships that could be construed as a potential conflict of interest. The China Aviation Industry Corporation had no role in the design of the study; in the collection, analyses, or interpretation of data; in the writing of the manuscript, or in the decision to publish the results.
References
- Santgerma, A.; Beaufils, J.Y.; Rosemberg, B. An example of widespread fatigue damage assessment in A300 susceptible structure. In The Fourth Joined DoD/FAA/NASA Conference on Aging Aircraft; Saint Louis University: St. Louis, MO, USA, 2000; pp. 413–422. [Google Scholar]
- Feng, Y.; Ying, Z.; Xue, X.; Feng, Y. A new method for computing fatigue life based on stochastic modeling of multi-crack propagation. J. Northwest. Polytech. Univ. 2008, 26, 436–440. [Google Scholar]
- Kebir, H.; Roelandt, J.M.; Gaudin, J. Monte Carlo simulations of life expectancy using the dual boundary element method. Eng. Fract. Mech. 2001, 68, 1371–1384. [Google Scholar] [CrossRef]
- GB/T 6398-2000; Beijing Institute of Aeronautical Materials. Standard Test Method for Fatigue Crack Growth Rates of Metallic Materials. Standards Press of China: Beijing, China, 2000.
- China Aviation Research Institute. Stress Intensity Factor Handbook (Updated); Science Press: Beijing, China, 1993. [Google Scholar]
- Tian, X.; Du, H.; Sun, Z. Curve fitting of the fatigue crack growth characteristic of metals. Eng. Mechan 2003, 20, 136–140. [Google Scholar]
- Bergner, F.; Zouhar, G. A new approach to the correlation between the coefficient and the exponent in the power law equation of fatigue crack growth. Int. J. Fatigue 2000, 22, 229–239. [Google Scholar] [CrossRef]
- Shkarayev, S.; Krashanitsa, R. Probabilistic method for the analysis of widespread fatigue damage in structures. Int. J. Fatigue 2005, 27, 223. [Google Scholar] [CrossRef]
- Zhang, Z. Parameter estimation of three-parameter lognormal distribution. Appl. Math. A J. Chin. Univ. 1993, 8, 386–395. [Google Scholar]
- Gao, Z.; Liu, W.; Yue, Z.; Yang, Z. Fatigue crack propagation in polyethylene methacrylate. J. Mater. Sci. Eng. 2008, 26, 90–93. [Google Scholar]
- Cartwright, D.J.; Rooke, D.P. Approximate stress intensity factor compounding from known solution. Eng. Fract. Mech. 1974, 6, 563–571. [Google Scholar] [CrossRef]
- Rooke, D.P. Stress intensity factors for cracks at a row of holes. Int. J. Fract. 1982, 18, 31–36. [Google Scholar] [CrossRef]
- Schijve, J. Stress intensity factors of hole edge cracks. comparison one crack and two symmetric cracks. Int. J. Fract. 1983, 23, 111–115. [Google Scholar] [CrossRef]
- Zhao, J.; Xie, L.; Liu, J.; Zhao, Q. Calculation of stress intensity factor of infinite porous plate MSD. J. Northeast. Univ. (Nat. Sci.) 2010, 31, 1011–1014. [Google Scholar]


Disclaimer/Publisher’s Note: The statements, opinions and data contained in all publications are solely those of the individual author(s) and contributor(s) and not of MDPI and/or the editor(s). MDPI and/or the editor(s) disclaim responsibility for any injury to people or property resulting from any ideas, methods, instructions or products referred to in the content. |
© 2025 by the authors. Licensee MDPI, Basel, Switzerland. This article is an open access article distributed under the terms and conditions of the Creative Commons Attribution (CC BY) license (https://creativecommons.org/licenses/by/4.0/).