Abstract
The applicability of active thermography as a non-destructive method to distinguish heat treated from not-treated boron steel has been investigated. While the usual hardness semi-destructive tests influence the inspected surface, laser thermography is capable of verifying the effectiveness of heat treatment in boron steel in a non-destructive way without any surface modification. The procedure has been verified on two plates of boron steels with different structures (100% ferritic–pearlitic and 100% martensitic).
1. Introduction
The possibility to verify the effectiveness of material heat treatment in a fast and non-destructive way is always one of the main requirements for industrial applications. Nowadays, these controls are done by semi-destructive or destructive methods as the hardness tests (Rockwell, Brinell, Vickers, etc.) that are based on the measure of the depth, or the size of the impression left by an indenter on the surface. Clearly, this evaluation cannot be done for all the surface and all components, thus the hardness test does not permit us to evaluate the uniformity of heat treatment, and a random spot-check must be done with a consequent significant modification of the surface of component.
Active thermography that is widely used as a non-destructive method for defect detection and process monitoring [,,,] represents an interesting alternative approach since it allows to measure the thermal diffusivity of material [,,,,] and then evaluating the structure before and after heat treatment. To obtain the required accuracy in the measurement of the thermal diffusivity and to correctly set the test parameters, a numerical approach is proposed in this work. Hence, experimental tests have been carried out on the effectiveness of the material heat treatment on two different boron steel plates, the first one with a 100% ferritic–pearlitic microstructure and the other one with a 100% martensitic micro-structure.
2. Materials and Methods
As described in other work [] the thermo-physical properties of materials are related to their microstructure, and then the thermal properties can be used as an index for monitoring microstructure changes. Thus, the main idea is to consider thermal diffusivity (α) of material as a suitable index to indicate that heat treatment has taken place. To measure this thermal property by active thermography, several methods have been developed with different capabilities, excitation sources, and configurations. The most common method, considered as a reference because it is the method used in standard ISO 22007-4, ISO18755, and ASTM E1461, is the Parker’s method [] that must be used in transmission mode. However, it is not always possible to have access to both surfaces of components, hence the method developed by Bison et al. [] that requires a reflection set-up, has been used in this work. Furthermore, Parker’s method is based on the evaluation of the half-rise time, which may be subject to error because of the acquisition frequency (fs), thus must be applied with a minimum thickness of specimen, otherwise a correction on half-rise time must be used [].
2.1. Specimens
The specimens used for this study are two 1 mm thick Usibor®1500 plates with dimensions of 150 × 200 mm2 that can be considered isotropic and homogeneous. The microstructure of material exhibits a ferritic–pearlitic matrix. One of this two plates has been heated in the oven at a temperature of about 950 °C for 4 min and, subsequently, it has been quenched in water to obtain a martensitic microstructure. To avoid the influence of the absorptivity and emissivity in the transmission measurement, a thin layer of black high temperature resistant paint has been applied on both surfaces for both specimens.
2.2. Thermographic Setup and Data Analysis
Two different thermographic set-ups have been used: the first one in transmission mode, for the application of Parker’s method, the other one in reflection mode for the application Bison’s. For transmission measurements, Figure 1a, one flash lamp using 6 kJ electrical energy (Hensel Studio Technik, EH Pro 6000) irradiated the back surface of specimen (distance 50 mm, angle 0°) for a time of ~2 ms. The flash has been aligned to create an homogeneous heating and obtain higher energy density. Thermal signal on the front surface has been recorded by MWIR-camera (Flir X6540 sc) with a NEDT of 25 mK, for 3 s using a frame rate of 530 Hz and a subframe of 188 × 320 pxl2. The camera equipped with a 50 mm lens, 480 mm from the specimen has been placed with a spatial resolution of 0.18 mm/pxl.
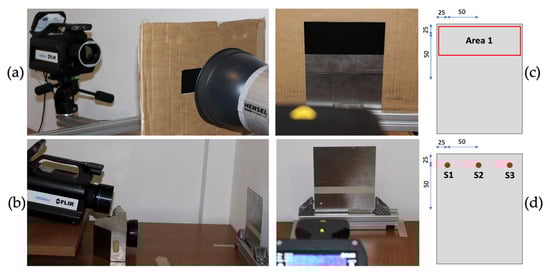
Figure 1.
Experimental set up in (a) transmission mode, and (b) reflection mode. Scheme of the inspected areas for (c) transmission and (d) reflection measurements (lengths are in mm).
For reflection configuration measurements, Figure 1b, Ytterbium pulsed fiber laser (YLP-V2 1 mJ series) with nominal power of 50 W with circular spot diameter of 4 mm has been used with excitation duration of 6 ms. The laser has been placed frontally to the surface to avoid distortion of circular and gaussian distribution of energy. The same MWIR-camera described above, equipped with the same lens, positioned at distance of 455 mm with and angle of 19° to the laser line has been used, and a spatial resolution of 0.15 mm/pxl has been obtained. The thermal sequences have been recorded with a frame rate of 540 Hz. An integration time of 1.7310 ms and the related calibration range of 5–45 °C for both configurations have been used.
Consequently, Bison’s method FEM model has been developed fixing the characteristics of equipment (Laser power, excitation time and laser spot diameter) and considering different values of fs and spatial resolution. The thermal maps obtained have been imported in MATLAB®, adding a peculiar noise of the thermal camera. Whereas the values of thermal diffusivity of the model and the value measured applying Bison’s method from FEM results, the percentual error has been considered. It is possible to see from the graph in Figure 2 that there is a value over/below the percentual error that can be assumed as constant, which means it is not useful to overcome that limit to reduce error.
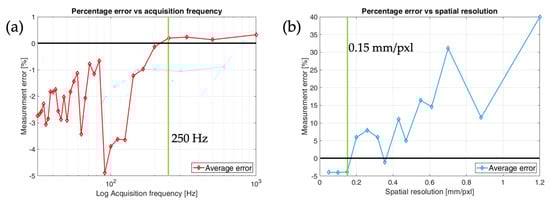
Figure 2.
Curves that show error in function of (a) fs and (b) spatial resolution. Black line shows the 0% of error, and green lines show the limit value for a constant percentage of the error.
Tests in transmission mode have been performed 5 times in the area shown in Figure 1c. In the same area, tests in reflection configurations have been performed in 3 different points, 5 times for each one as shown in Figure 1d. These measurements for both specimens have been repeated in order to obtain an average value of thermal diffusivity for each one and the correspondent standard deviation.
To confirm different microstructures between the two plates, after thermographic tests, Vickers micro-hardness tests have been performed in the same areas analyzed by thermography, in particular: 5 replications for 3 different areas, then 15 times for each plate. The plate has been previously properly grinded and polished to obtain a planar surface and to remove the superficial coating. For micro-hardness tests, a load equal to 1 kg with a dwell time of 5 s has been adopted.
3. Results
Results of measurements of thermal diffusivity by Parker’s method and Bison’s method are shown in Table 1. As can be seen, there is a difference between the average value of thermal diffusivity obtained for the ferritic structure and the martensitic one, which is 35%. It is possible to observe that there is a difference between values of thermal diffusivity measured in transmission mode and those obtained in the reflection mode. In the table, values of hardness have been reported to verify the goodness of heat-treatment and to show the difference of mechanical properties of inspected specimens.

Table 1.
Results of thermographic measurements by Bison’s method and Parker’s method.
4. Discussion
Results shows a significant difference between values of thermal diffusivity obtained for ferritic plate and martensitic one. It is clear that these values are strongly different, and it is possible to associate a thermal diffusivity value with each of the two structures with both thermographic methods. In the results in Table 1, it is possible to see that there is a difference between the values of thermal diffusivity obtained by different methods; this is reasonable for two reasons. Firstly, isotropic material has been assumed, but it is not possible to be sure that properties are the same in all the direction, in fact is possible to compare thermal diffusivity obtained on the surface with values obtained through the depth only if this hypothesis is verified. Secondly, in the transmission measurements, both faces have been painted with a very thin layer of paint; these layers can slightly influence the measurement. Nevertheless, in both cases, the difference of thermal diffusivity between the two different structures is significant and measurable. Clearly, Bison’s method could be more suitable for industrial applications because in reflection mode, less space and only one face access are required, and it is easier to apply locally on components.
5. Conclusions
A thermographic non-destructive method has been shown to be capable of discerning the difference between a ferritic structure and a martensitic one for boron steel Usibor® 1500. In particular, the evaluation of thermal diffusivity of material has been revealed as a suitable index to recognize the different structures. Among several thermographic methods for measuring thermal diffusivity, Bison’s method has been considered and compared with Parker’s method, which is the reference used in several standards. For setting the test parameters for Bison’s method application, a FEM model has been developed considering the error of measurement in the function of fs and spatial resolution in order to minimize the measurement error. Experimental measurements of thermal diffusivity showed a difference of 35% between specimens of 100% ferritic structure and 100% martensitic ones.
Funding
This work is founded by the Italian MIUR Project: Pico e Pro-Processi Integrati e Connessi 38 per l’Evoluzione Industriale nella Produzione, cod. ARS01_01061 (PON Ricerca ed Innovazione 39 2014-2020) 40.
Data Availability Statement
The data presented in this study are available on request from the corresponding author.
Conflicts of Interest
The authors declare no conflict of interest. The funders had no role in the design of the study; in the collection, analyses, or interpretation of data; in the writing of the manuscript, or in the decision to publish the results.
References
- Maierhofer, C.; Krankenhagen, R.; Röllig, M.; Heckel, T.; Brackrock, D.; Gaal, M. Quantification of impact damages in CFRP and GFRP structures with thermography and ultrasonics. Mater. Sci. 2018. [Google Scholar] [CrossRef]
- D’Accardi, E.; Palumbo, D.; Tamborrino, R.; Galietti, U. Quantitative analysis of thermographic data through different algorithms. Procedia Struct. Integr. 2018, 8, 354–367. [Google Scholar] [CrossRef]
- Dell’Avvocato, G.; Palumbo, D.; Pepe, R.; Galietti, U. Non-destructive evaluation of resistance projection welded joints (RPW) by flash thermography. IOP Conf. Ser. Mater. Sci. Eng. 2021, 1038, 012003. [Google Scholar] [CrossRef]
- Müller, J.P.; Dell’Avvocato, G.; Krankenhagen, R. Assessing overload-induced delaminations in glass fiber reinforced polymers by its geometry and thermal resistance. NDT E Int. 2020, 116, 102309. [Google Scholar] [CrossRef]
- Bison, P.; Cernuschi, F.; Capelli, S. A thermographic technique for the simultaneous estimation of in-plane and in-depth thermal diffusivities of TBCs. Surf. Coat. Technol. 2011, 205, 3128–3133. [Google Scholar] [CrossRef]
- Parker, W.J.; Jenkins, R.J.; Butler, C.P.; Abbott, G.L. Flash Method of Determining Thermal Diffusivity, Heat Capacity, and Thermal Conductivity. J. Appl. Phys. 1961, 32, 1679–1684. [Google Scholar] [CrossRef]
- Bedoya, A.; González, J.; Rodríguez-Aseguinolaza, J.; Mendioroz, A.; Sommier, A.; Batsale, J.; Pradere, C.; Salazar, A. Measurement of in-plane thermal diffusivity of solids moving at constant velocity using laser spot infrared thermography. Measurement 2018, 134, 519–526. [Google Scholar] [CrossRef]
- Pech-May, N.; Mendioroz, A.; Salazar, A. Simultaneous measurement of the in-plane and in-depth thermal diffusivity of solids using pulsed infrared thermography with focused illumination. NDT E Int. 2016, 77, 28–34. [Google Scholar] [CrossRef]
- Azumi, T.; Takahashi, Y. Novel finite pulse-width correction in flash thermal diffusivity measurement. Rev. Sci. Instrum. 1981, 52, 1411–1413. [Google Scholar] [CrossRef]
- Klein, S.; Roncery, L.M.; Walter, M.; Weber, S.; Theisen, W. Diffusion processes during cementite precipitation and their impact on electrical and thermal conductivity of a heat-treatable steel. J. Mater. Sci. 2016, 52, 375–390. [Google Scholar] [CrossRef]
Publisher’s Note: MDPI stays neutral with regard to jurisdictional claims in published maps and institutional affiliations. |
© 2021 by the authors. Licensee MDPI, Basel, Switzerland. This article is an open access article distributed under the terms and conditions of the Creative Commons Attribution (CC BY) license (https://creativecommons.org/licenses/by/4.0/).