Proceeding Paper

Four-Dimensional Reconstruction of Leaked Gas Cloud Based on Computed Tomography Processing of Multiple Optical Paths Infrared Measurement †

Department of Mechanical Engineering, Kobe University, Kobe 657-8501, Japan
*
Author to whom correspondence should be addressed.
Presented at the 16th International Workshop on Advanced Infrared Technology & Applications, 26–28 October 2021; Available online: https://aita2021.sciforum.net/.
Eng. Proc. 2021, 8(1), 33; https://doi.org/10.3390/engproc2021008033
Published: 27 December 2021

Abstract

:
Currently, gas leakage source detection is conducted by the human senses and experience. The development of a remote gas leakage source detection system is required. In this research, an infrared camera was used to detect gas leakage. The gas can be detected by the absorption of infrared rays by the gas and the infrared rays emitted from the gas itself. A three-dimensional reconstruction of a leaked gas cloud was performed to identify the gas leakage source and the flow direction of the gas. The so-called four-dimensional reconstruction of the leaked gas cloud, i.e., reconstruction of three-dimensional images of a gas cloud varying with time, was successfully performed by applying the ART (Algebraic Reconstruction Techniques) method to the multiple optical paths of infrared measurement.

1. Introduction

An explosion due to a gas leak is one of the serious accidents at a gas plant. Detection of gas leak sources is done by human senses and experience. In the future, the retirement of skilled workers and the aging of factory equipment will be a problem. Continuous and remote gas leak monitoring technology is required. Leaked gas can be detected by the absorption of infrared rays by the gas and the infrared rays emitted from the gas itself. You can use an infrared camera to remotely monitor various gas leaks. In addition, the technology to reconstruct the 3D gas flow from 2D camera images helps identify the cause of the gas leak and ensure the operator’s safety from the leaked gas. The computed tomography (CT) technique is applied to visualize the three-dimensional flow of leakage gas. It is difficult to measure an infrared image of a gas cloud from multiple optical paths for CT imaging in the field. To obtain the three-dimensional gas flow from a few infrared images, the algebraic reconstruct technique (ART) [1] was applied [2]. In this study, the so-called four-dimensional image, i.e., reconstruction of three-dimensional images varying with time, was obtained by applying the ART (Algebraic Reconstruction Techniques) method to the multiple optical paths of the infrared measurement. The effectiveness of the 4D imaging scheme was examined using numerical simulations.

2. Measurement Principle

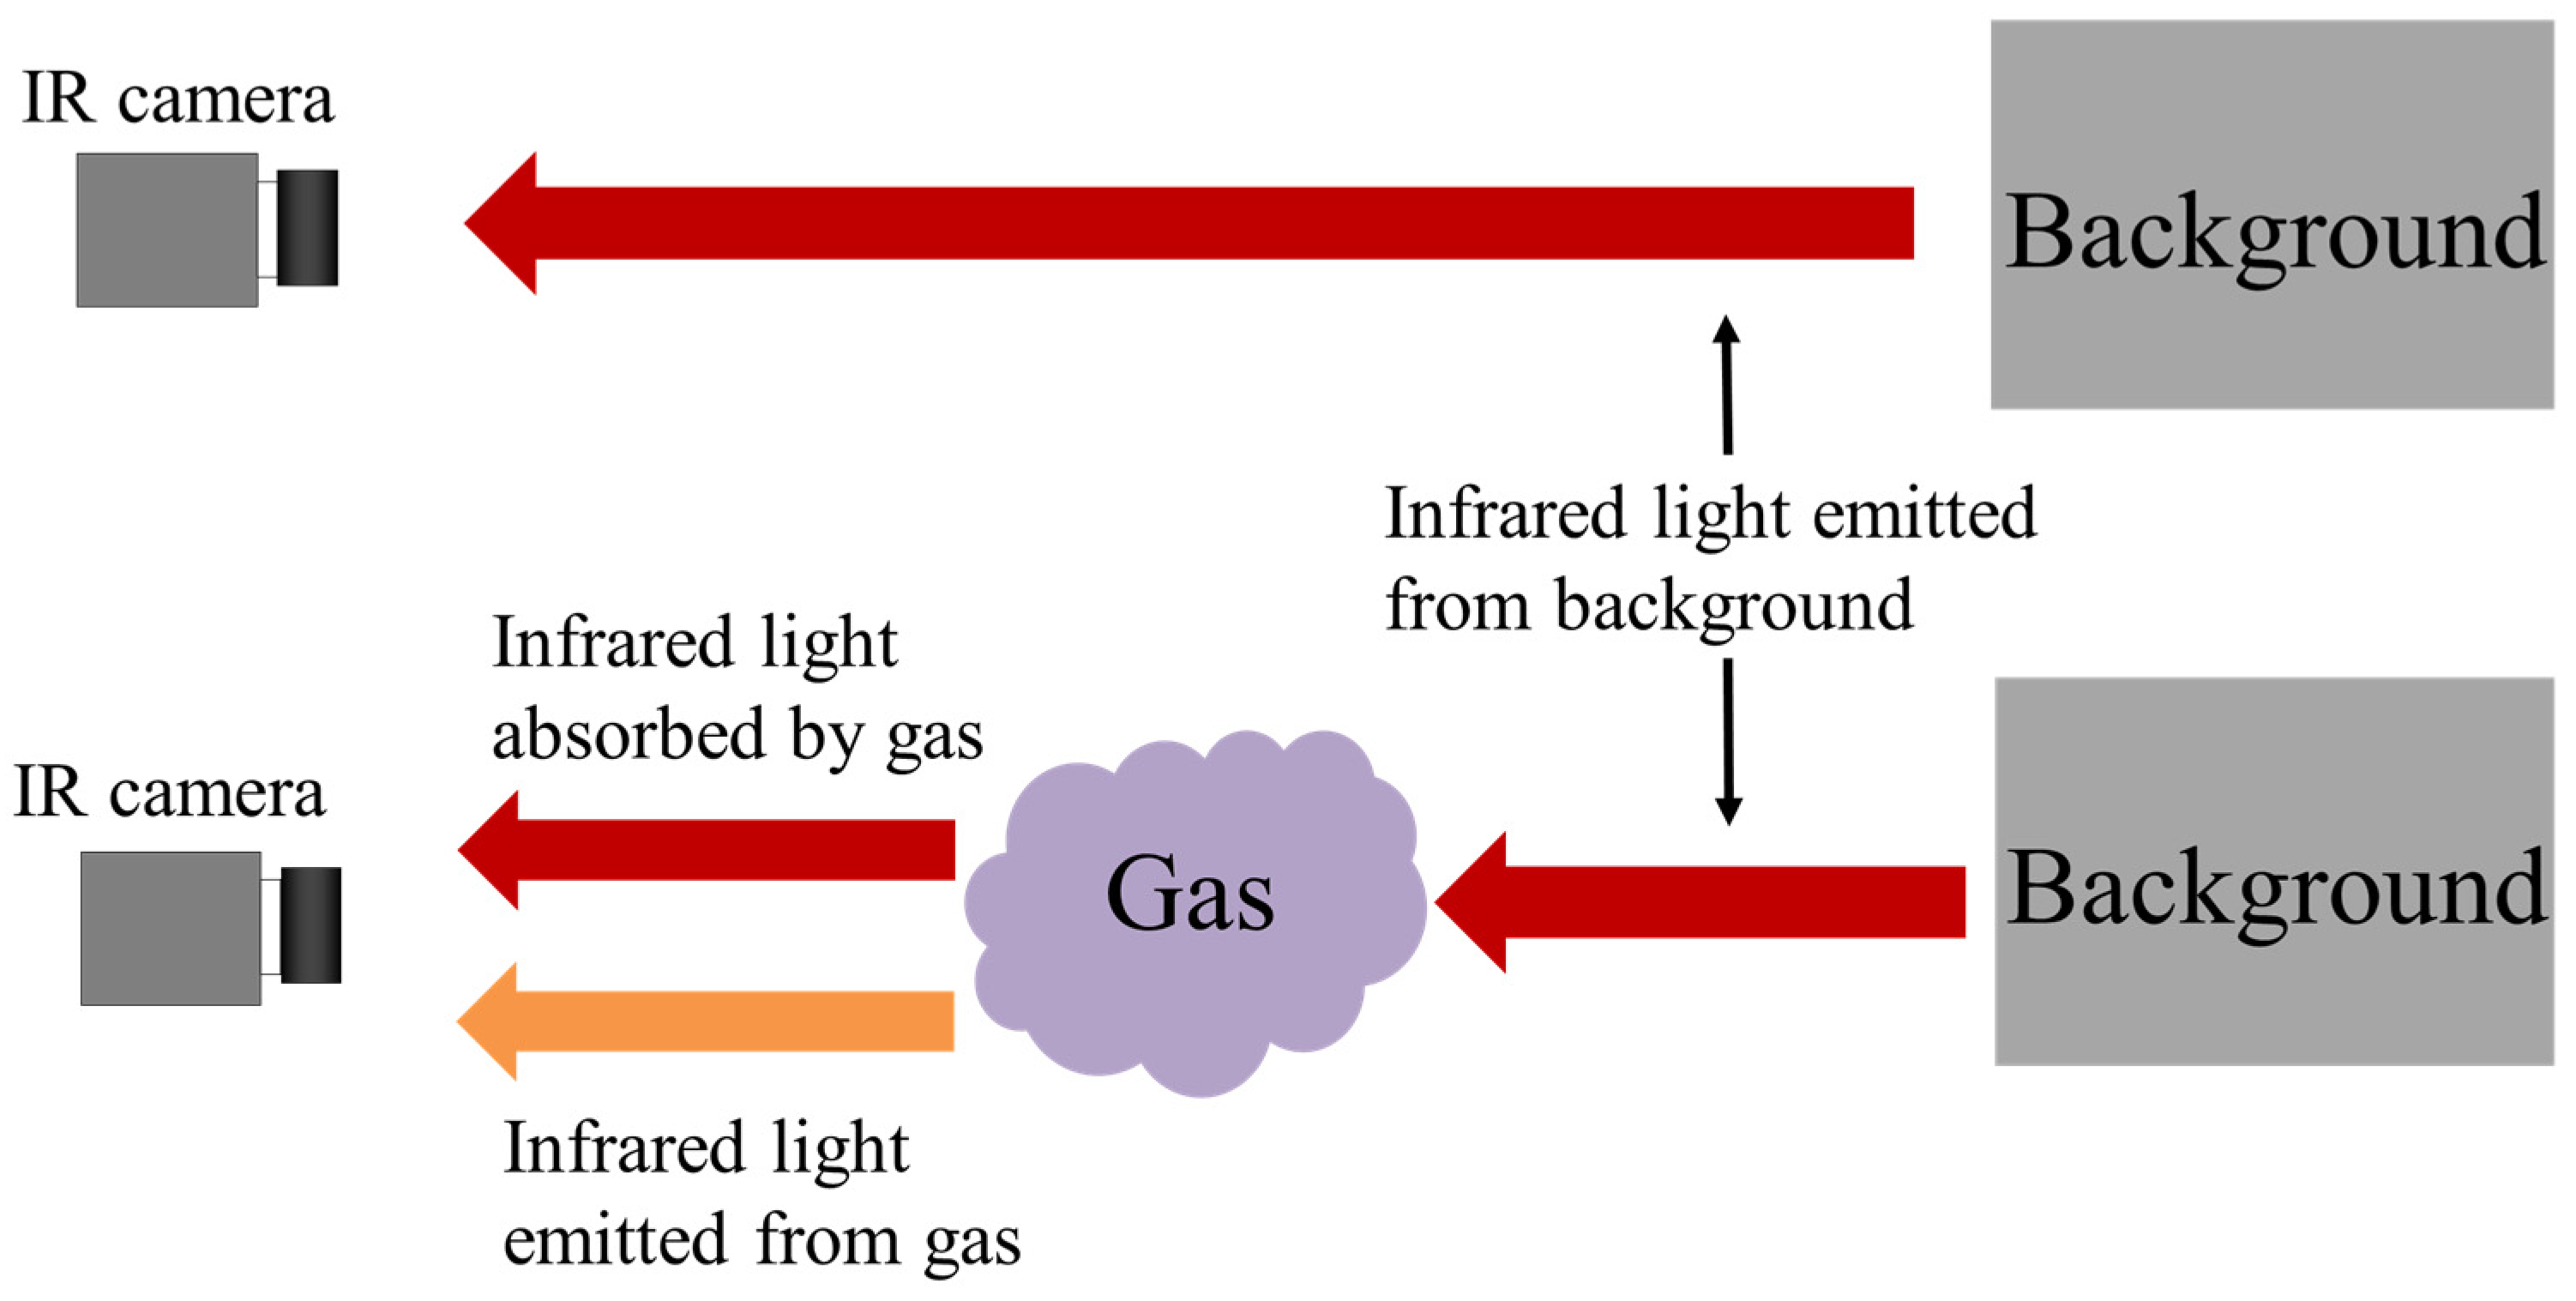
2.1. Gas Visualization Principle

The gas visualization principle is shown in Figure 1. The gas is not visible on the optical image, but it can be visualized on the infrared image. When gas is observed with an infrared camera, the infrared ray coming from the background of the gas is partly ab-sorbed by the gas, and the intensity of the infrared rays is weakened. In addition, in-frared rays due to the temperature of the gas itself are observed. The gas absorption characteristics depend on the type of gas. For example, since the fluorocarbon absorp-tion band shows the range of 3.2 to 3.4 μm, it can be detected with a mid-wavelength infrared camera. In order to emphasize the absorption by gas, a filter in this wave-length band is used. A filter attached to the infrared camera is used according to the type of gas to be detected.

2.2. ART Reconstructed Method

In a gas plant, it is difficult to acquire data in many directions, as in X-ray CT. Therefore, the ART reconstructed method was applied to the identification of 3D gas distribution. The ART method is one of the image reconstruction algorithms. The gas concentration distribution coincides with the distribution of the infrared absorption rate. The distribution of the infrared absorption rate in the infrared path is estimated from the projected images obtained by multiple cameras and the ART method [1]. The estimated infrared absorption rate distribution x ^ obtained by ART is expressed as follows:
x ^ = arg min C ( x )
C ( x ) = i = 1 M ( y i ( A x ) i ) 2
where x is the assumed distribution of the infrared absorption rate in the analysis process, A is the system matrix, Ax is the forward projection image for x, y is the measured projection image, the subscript i indicates the i-th projection image, and M is the total number of projected images. The projection image for the assumed x is calculated, and the evaluation function C, which is the difference between Ax and the measured image y, is calculated. Next, x is modified to reduce the evaluation function C. By repeating these calculations, x that minimizes C(x) is defined as the output image x ^ of ART.
A three-dimensional image is created by stacking the reconstructed cross-sectional distribution of the infrared absorption rate in the height direction. This scheme is performed for each frame, and by stacking the three-dimensional images, a four-dimensional image including time changes is created. A four-dimensional image makes it possible to observe the three-dimensional movement of the leakage gas cloud.

3. Reconstruction Simulation

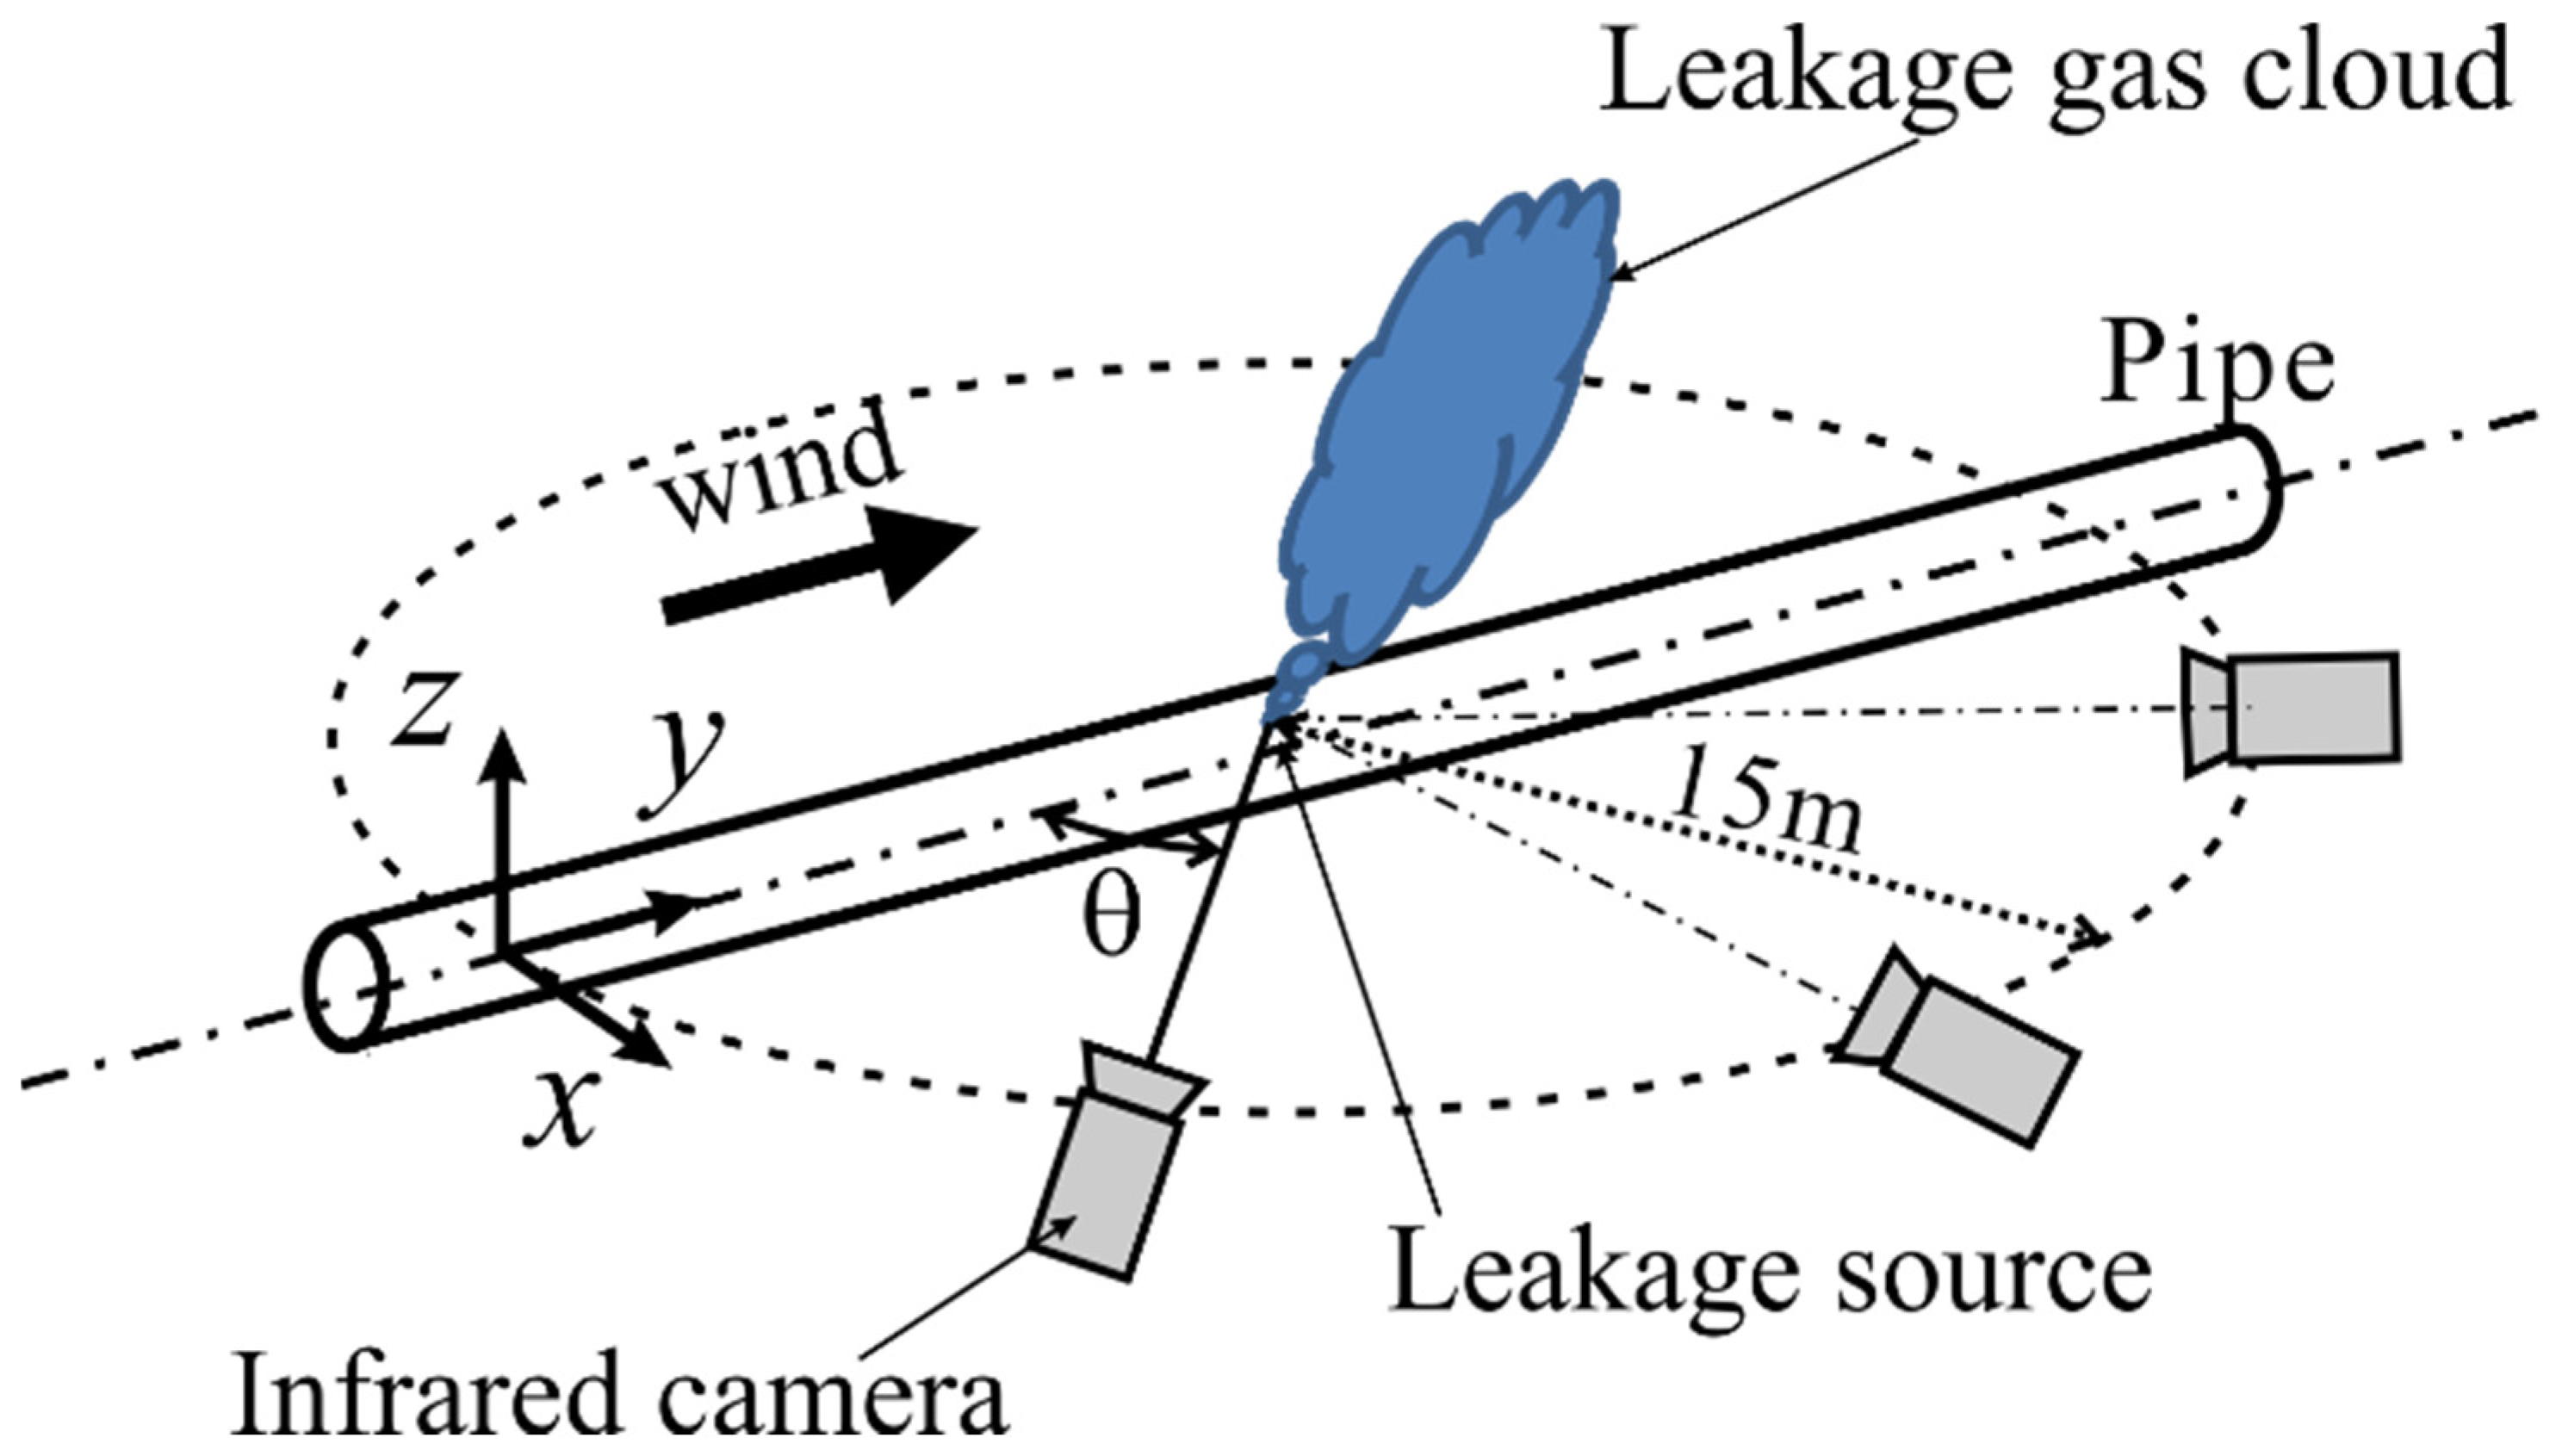
3.1. Numerical Simulation of Leakage Gas Flow

Figure 2 shows a schematic model of the numerical simulation. The finite volume method was used for the numerical simulation of the leaked gas cloud. The gas pipes are arranged parallel to the y-axis, and methane gas is ejected upward from the top of the pipes. The gas flow rate is 20 L/min. It is assumed that wind with a wind speed of 1 m/sec is blowing in the positive direction of the y-axis parallel to the pipe. A two-dimensional infrared image group of multiple optical paths is obtained by a synchronous measurement with multiple infrared cameras in 12 directions in 15° increments with the leakage source as the center of rotation, with the distance between the leakage gas source and the infrared camera being 15 m. The image was taken in the direction parallel to the gas pipe. Examples of the image of the gas cloud obtained captured in 45° increments are shown in Figure 3. The width and height of the infrared image are 320 pixels and 120 pixels, respectively. The pixel size of the infrared image is 9.4 mm/pixel. Since methane gas is lighter than the air, it flows upward, and there is no piping effect on the gas flow. The frame speed is set to be 30 frames/sec, and the frame speed is set to 30 frames/sec, and the movement of the gas cloud is recorded in the video from each direction.

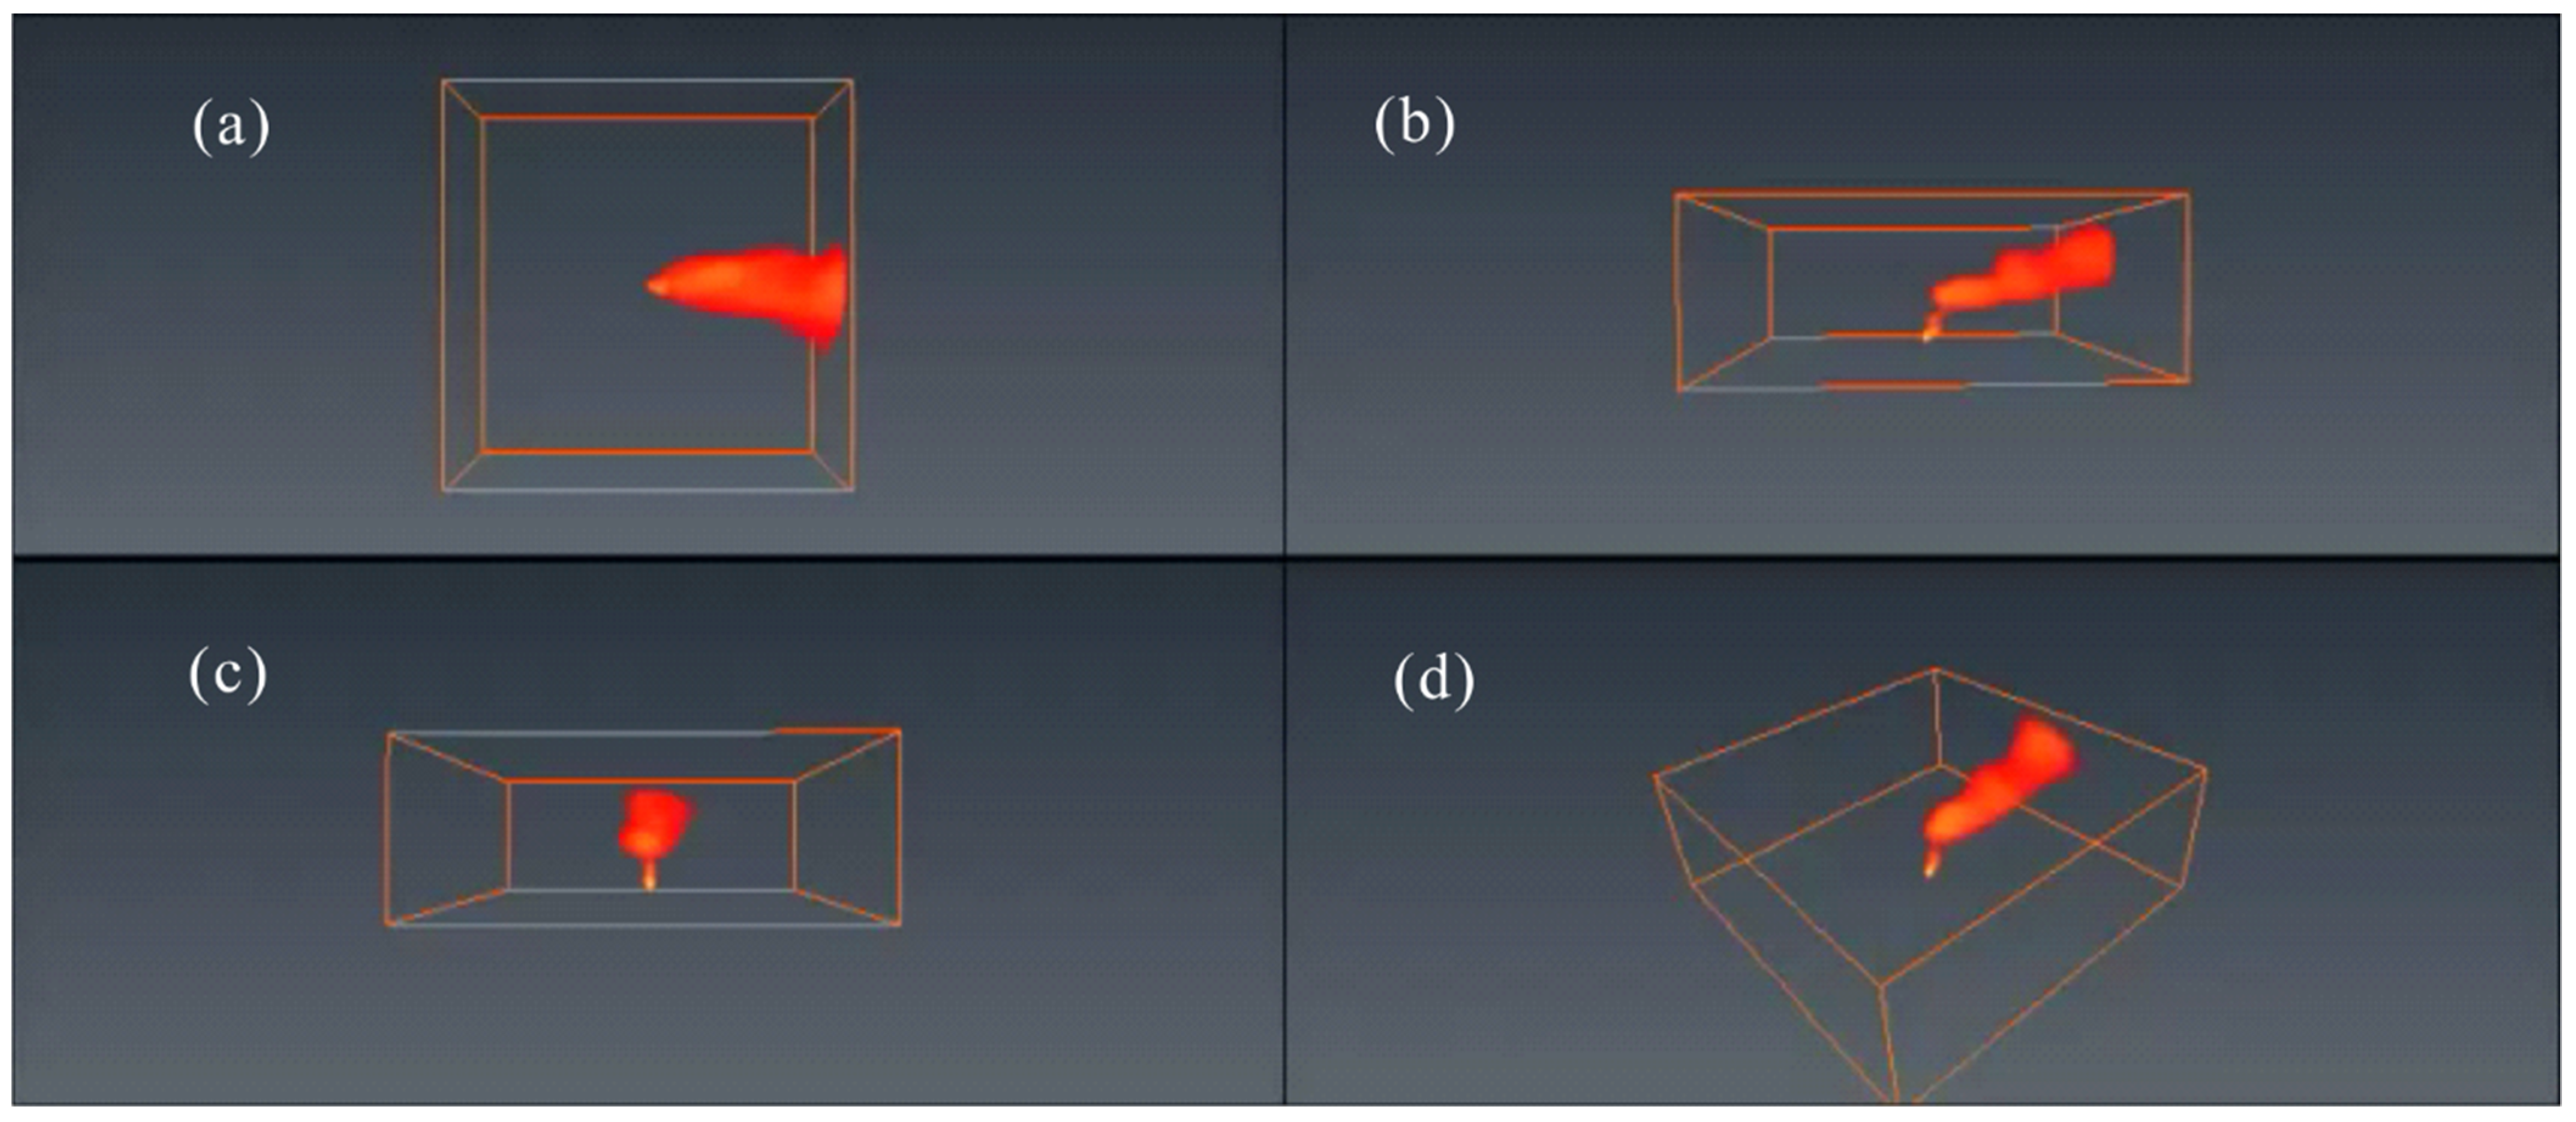
3.2. 4D Reconstruction

A four-dimensional image of a leakage gas cloud was obtained based on the captured images of the optical path in 12 directions. An example of a three-dimensional image of a gas cloud is shown in Figure 4 (Video S5). A three-dimensional image with a width of 320 pixels, a depth of 320 pixels, and a height of 120 pixels was obtained by reconstruction. The voxel size is 9.4 mm/voxel. The reconstructed 3D image contains artifacts that are noisy during reconstruction. In general, the intensity of the artifact is smaller, increasing with the number of optical paths. In Figure 4, only voxels showing intensity above the threshold value are displayed to remove the artifact and to make it easier to see the flow of gas clouds. Twenty frames of 3D images, which is equivalent to 3 s, are obtained by reconstruction and created a movie. It is found that the characteristics of the three-dimensional flow of the leakage gas cloud can be reconstructed.

4. Conclusions

In order to ensure the safety of workers from the leaked gas, it is necessary to detect the leakage gas source and gas flow by remote and wide range measurements. Since infrared rays of a specific wavelength are absorbed by the gas, the gas can be visualized using an infrared camera. The observation method that presented the three-dimensional movement of the leaked gas cloud from those infrared images using CT technology was proposed. The movement of gas clouds was reconstructed as a four-dimensional image from a small number of infrared images using the ART method. It was found from the numerical simulation that the three-dimensional shape of the gas cloud and the movement of the gas could be reconstructed from infrared images of multiple optical paths from 12 directions.

Supplementary Materials

The following are available online at https://www.mdpi.com/article/10.3390/engproc2021008033/s1, Video S1: Infrared difference image from background image which captured from a direction parallel to the pipe, θ = 0°, Video S2: Infrared image captured from a direction at θ = 45°, Video S3: Infrared image captured from a direction perpendicular to the pipe, θ = 90°, Video S4: Infrared image captured from a direction at θ = 135°), Video S5: Three-dimensional reconstruction image of leakage gas cloud.

Acknowledgments

The authors would like to acknowledge that a part of this study is supported by the New Energy and Industrial Technology Development Organization (NEDO).

References

  1. Kudo, H. Iterative Methods for Tomographic Image Reconstruction: Foundations and Surprising Examples. Med. Imaging Technol. 2005, 23, 23–29. [Google Scholar]
  2. Uchida, M.; Shiozawa, D.; Sakagami, T.; Kubo, S. Three-Dimensional Reconstruction of Leaked Gas Cloud Image Based on Computed Tomography Processing of Multiple Optical Paths Infrared Measurement Data, Advances in Condition Monitoring and Structural Health Monitoring; Springer Nature: Singapore, 2021; pp. 751–756. [Google Scholar]
Figure 1. Illustration of gas visualization using an infrared camera.
Engproc 08 00033 g001
Figure 2. Schematic model of the numerical simulation.
Engproc 08 00033 g002
Figure 3. Infrared difference image from background image, (a) captured from a direction parallel to the pipe, θ = 0°, (b) captured from a direction at θ = 45°, (c) captured from a direction perpendicular to the pipe, θ = 90°, (d) captured from a direction at θ = 135°).
Engproc 08 00033 g003
Figure 4. Three-dimensional reconstruction image of leakage gas cloud (a) view from a top direction, (b) view from a direction at θ = 90°, (c) view from a direction at θ = 0°, (d) plane view.
Engproc 08 00033 g004
Publisher’s Note: MDPI stays neutral with regard to jurisdictional claims in published maps and institutional affiliations.

