Proceeding Paper

Detection of Disease-Specific Volatile Organic Compounds Using Infrared Spectroscopy †

1
Max-Planck-Institut für Quantenoptik, Hans-Kopfermann-Straße 1, 85748 Garching, Germany
2
Lehrstuhl für Experimental Physik, Ludwig-Maximilians-Universität München, Am Coulombwall 1, 85748 Garching, Germany
3
Research Unit of the Buhl-Strohmaier Foundation for Cerebral Palsy and Paediatric Neuroorthopaedics, Klinikum rechts der Isar, Technical University of Munich, 81675 Munich, Germany
4
Markus Würth Professorship, Technical University of Munich, 81675 Munich, Germany
5
Institute of Automation and Electrometry SB RAS, 630090 Novosibirsk, Russia
*
Author to whom correspondence should be addressed.
Presented at the 16th International Workshop on Advanced Infrared Technology & Applications, 26–28 October 2021; Available online: https://aita2021.sciforum.net/.
Eng. Proc. 2021, 8(1), 15; https://doi.org/10.3390/engproc2021008015
Published: 22 November 2021

Abstract

:
Many life-threatening diseases at an early stage remain unrecognized due to a lack of pronounced symptoms. It is also accepted that the early detection of disease is a key ingredient for saving many lives. Unfortunately, in most of the cases, diagnostics implies an invasive sample collection, being problematic at the asymptomatic stage. Infrared spectroscopy of breath offers reliable noninvasive diagnostics at every stage and has already been tested for several diseases. This approach offers not only the detection of specific metabolites, but also the analysis of their imbalance and transportation. In this article, the power of infrared spectroscopy is demonstrated for diabetes, cerebral palsy, acute gastritis caused by bacterial infection, and prostate cancer.

1. Introduction

In the human body, each living cell undergoes constant biochemical reactions to keep it alive [1]. During these biochemical processes, many biomolecules are produced as a product or byproduct of these reactions. They can have a large heterogeneity of size from diatomic carbon monoxide to large proteins containing hundreds of atoms. Irrespective of the size, these biomolecules carry out the characteristic information of the cell state [2]. These biomolecules are produced throughout the body and are picked up and distributed in the bloodstream and other biofluids. Small biomolecules (typically of a mass not exceeding 130 a.u.), commonly called volatile organic compounds (VOCs), can (i) escape from the bloodstream through the alveolar membrane to the inner space of the lungs and (ii) finally release from the body as exhaled air. There is strong evidence that exhaled VOCs not only provide information about the internal chemistry of the body, but also about overall health, thus having great potential as indicators of disease onset and progression [2]. Therefore, the identification and/or quantification of VOCs is an essential task for clinical applications.
There have been many experimental techniques developed to identify VOCs from breath including infrared spectroscopy [3], e-nose [4], gas-chromatography mass spectrometry (GC-MS) [5], etc. Each technique has its own advantages and dis-advantages; however, infrared spectroscopy seems to be a promising one due to several reasons [6]. The recent development of gas-phase infrared spectroscopy that we pursue, aiming to identify disease-specific VOCs from breath, is presented in this article.

2. Detection of Biomarkers Using Infrared Spectroscopy

Infrared spectroscopy has already proven its potential to study chemical substances in the liquid, as well as the gas phase [3,7]. The major advantage of infrared spectroscopy in the gas phase is its capability of simultaneously detecting many molecules in a single experiment [6]. Infrared spectroscopy probes the intrinsic molecular vibrational and rotational modes without changing their original chemical state [8,9]. As a result, unlike GC-MS, there is no chance of molecular fragmentation during measurement and false identification of the molecule [10]. Another advantage is that the number of preparatory steps with the sample is minimal. Because of the unique vibrational character of the constituent bonds, each molecule is therefore represented by a unique spectral structure in the infrared spectral region. This structure is called the fingerprint of the molecule [11]. The identification of VOCs in the complex breath spectra is achieved by (i) matching the fingerprints of known molecules and (ii) subtracting them to visualize the spectra of other molecules with low absorption [10,11].

3. Disease-Specific Biomarkers
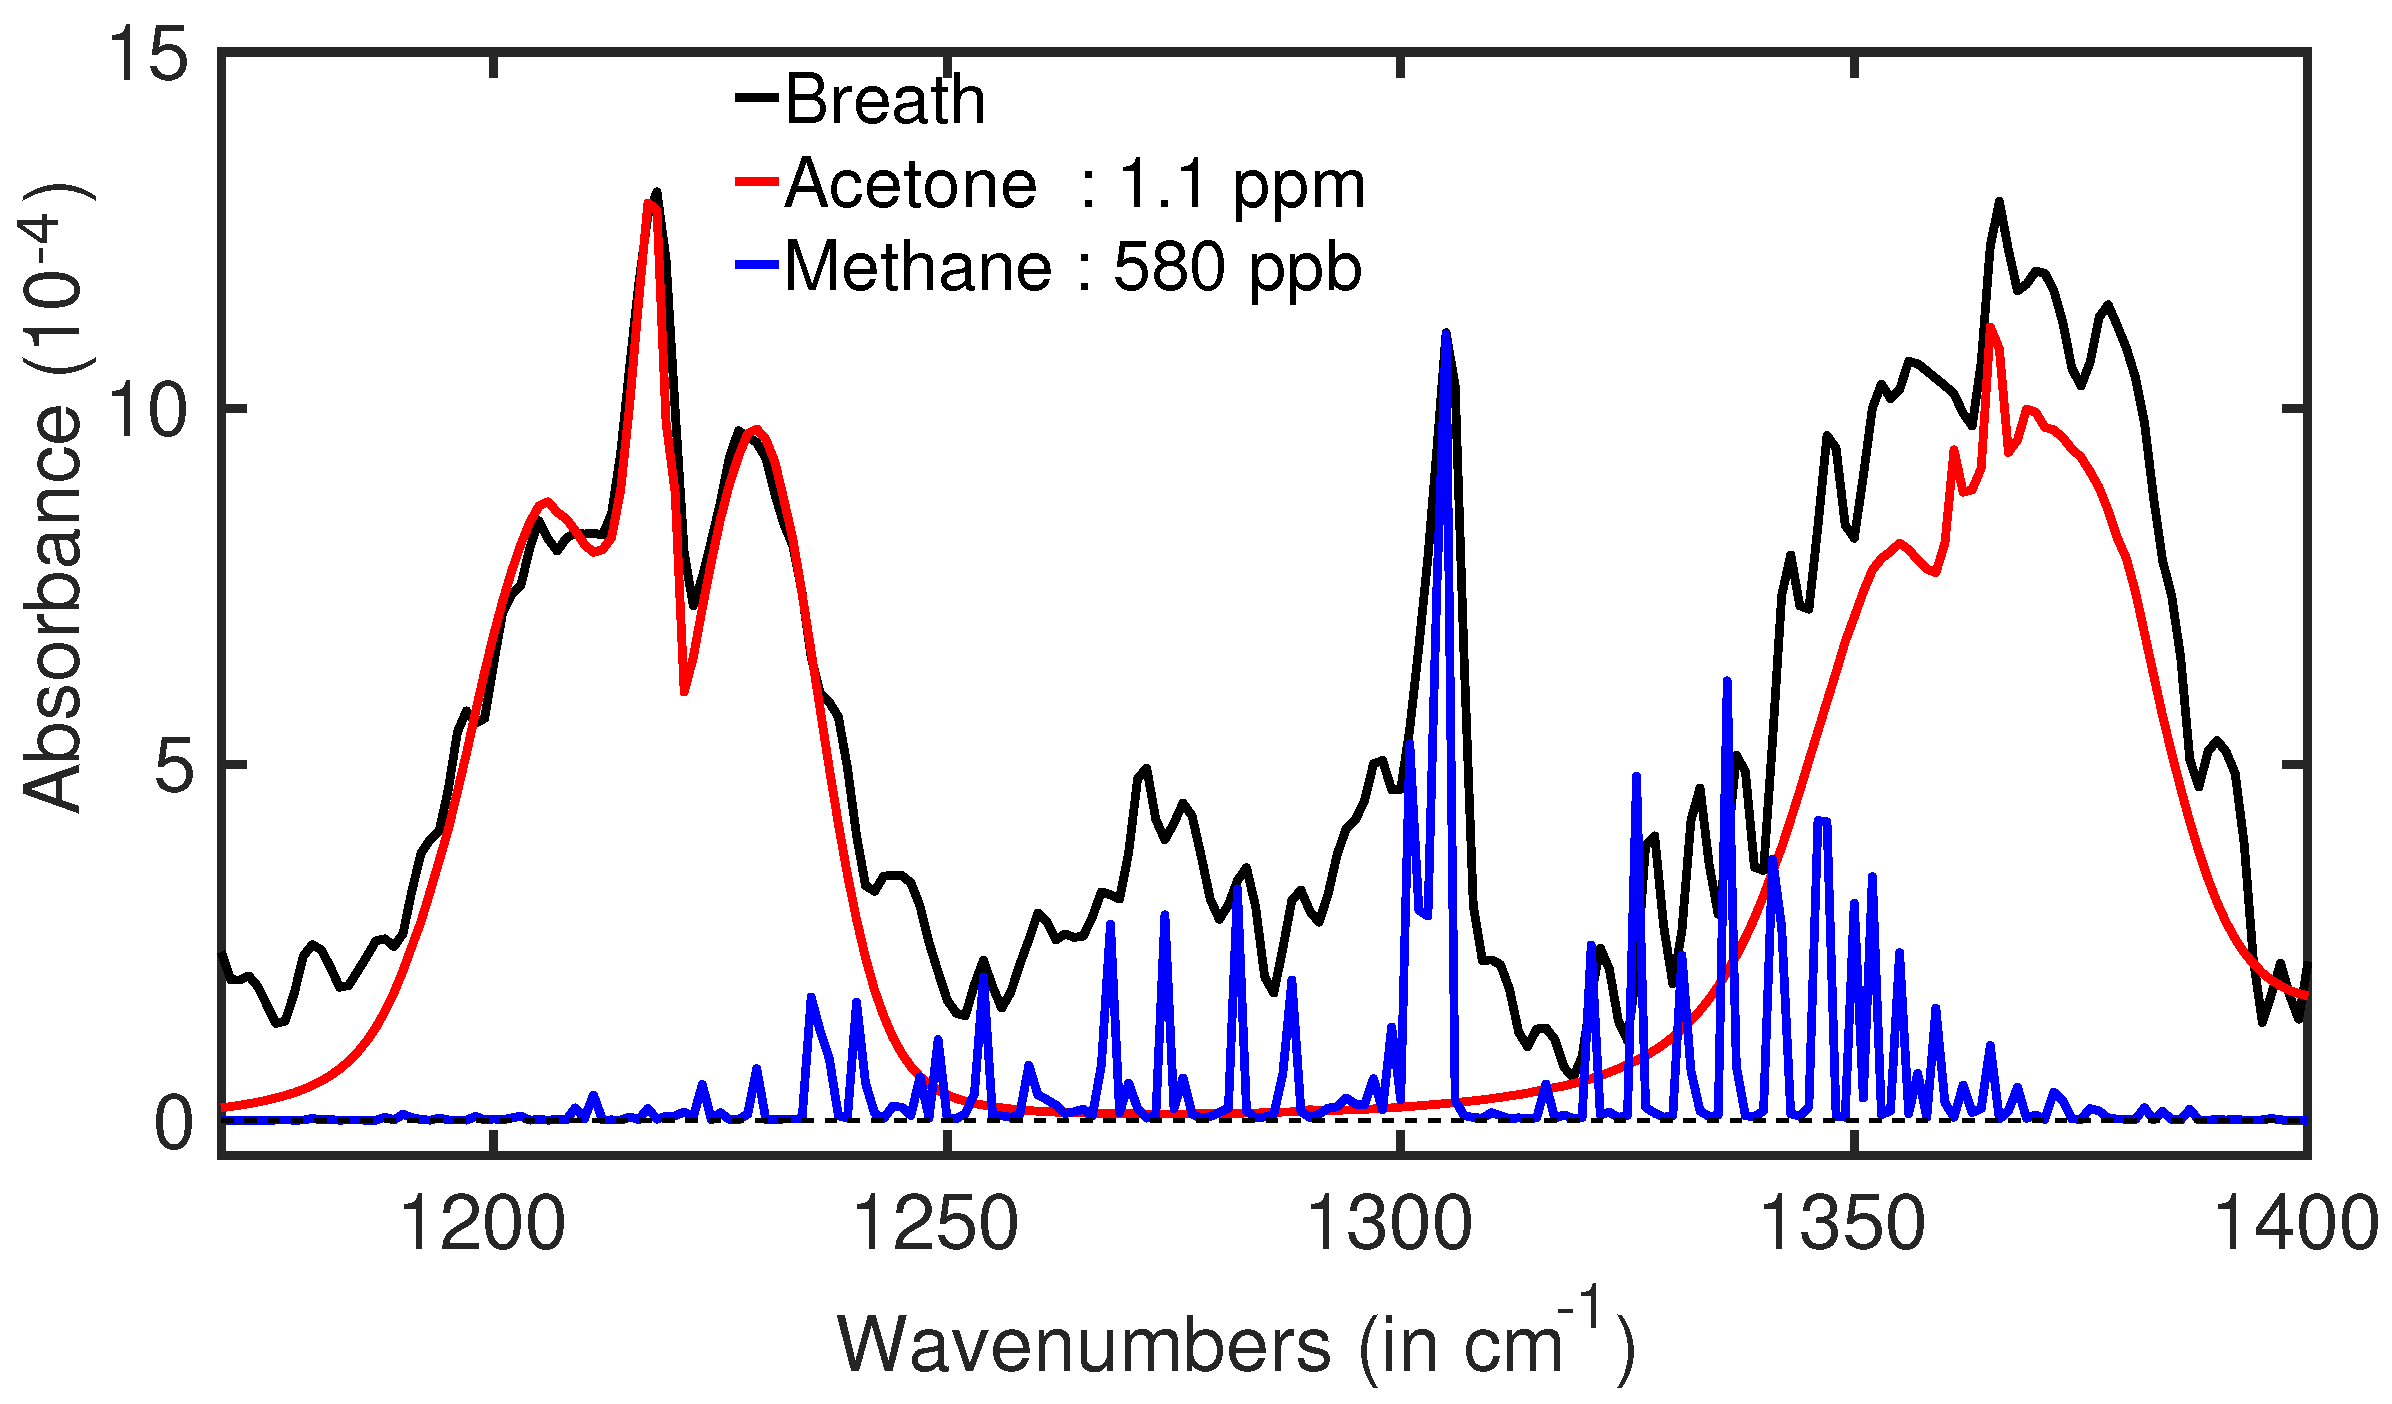
So far, several hundred VOCs have been identified using different analytical methods [12]. A majority of them have been identified by GC-MS [12]. In that sense, the detection of VOCs by infrared spectroscopy is still in its infancy, capable of identifying only a few tens of them. Its capability became stronger after the development of a high-duty-cycle water suppression technique applied to gas-phase biological samples [13]. The upgraded instrument, called the ultrabroadband midinfrared Fourier transform infrared (FTIR) spectrometer, has already been applied in small studies of cancer, cerebral palsy, bacterial infections, etc. The corresponding results are presented in the following subsections.

3.1. Diabetes

A large population in modern society suffers from metabolic disorder, commonly called diabetes. It is characterized by a high blood sugar level over a prolonged period of time. It is well known from ancient times that the breath of diabetic patients smells sweet due to acetone in their biofluids. Indeed, it has been found that the acetone level in the breath of diabetic patients is significantly elevated [14]. We have shown that infrared spectroscopy is capable of detecting and quantifying acetone in breath samples [13]. In experiments, it can be identified unambiguously by two broad peaks centered at 1217 cm−1 and 1365 cm−1, shown in Figure 1. A fitting curve for acetone is represented by the red line along with the breath spectrum (black) of a healthy volunteer. The measured corresponding concentration of acetone is ∼1.1 ppm. According to the literature, the concentration of acetone for patients suffering from type 1 diabetes ranges between 1.5 ppm and 2.2 ppm. Monitoring the diabetic stage via acetone can be considered as a noninvasive, fast procedure.

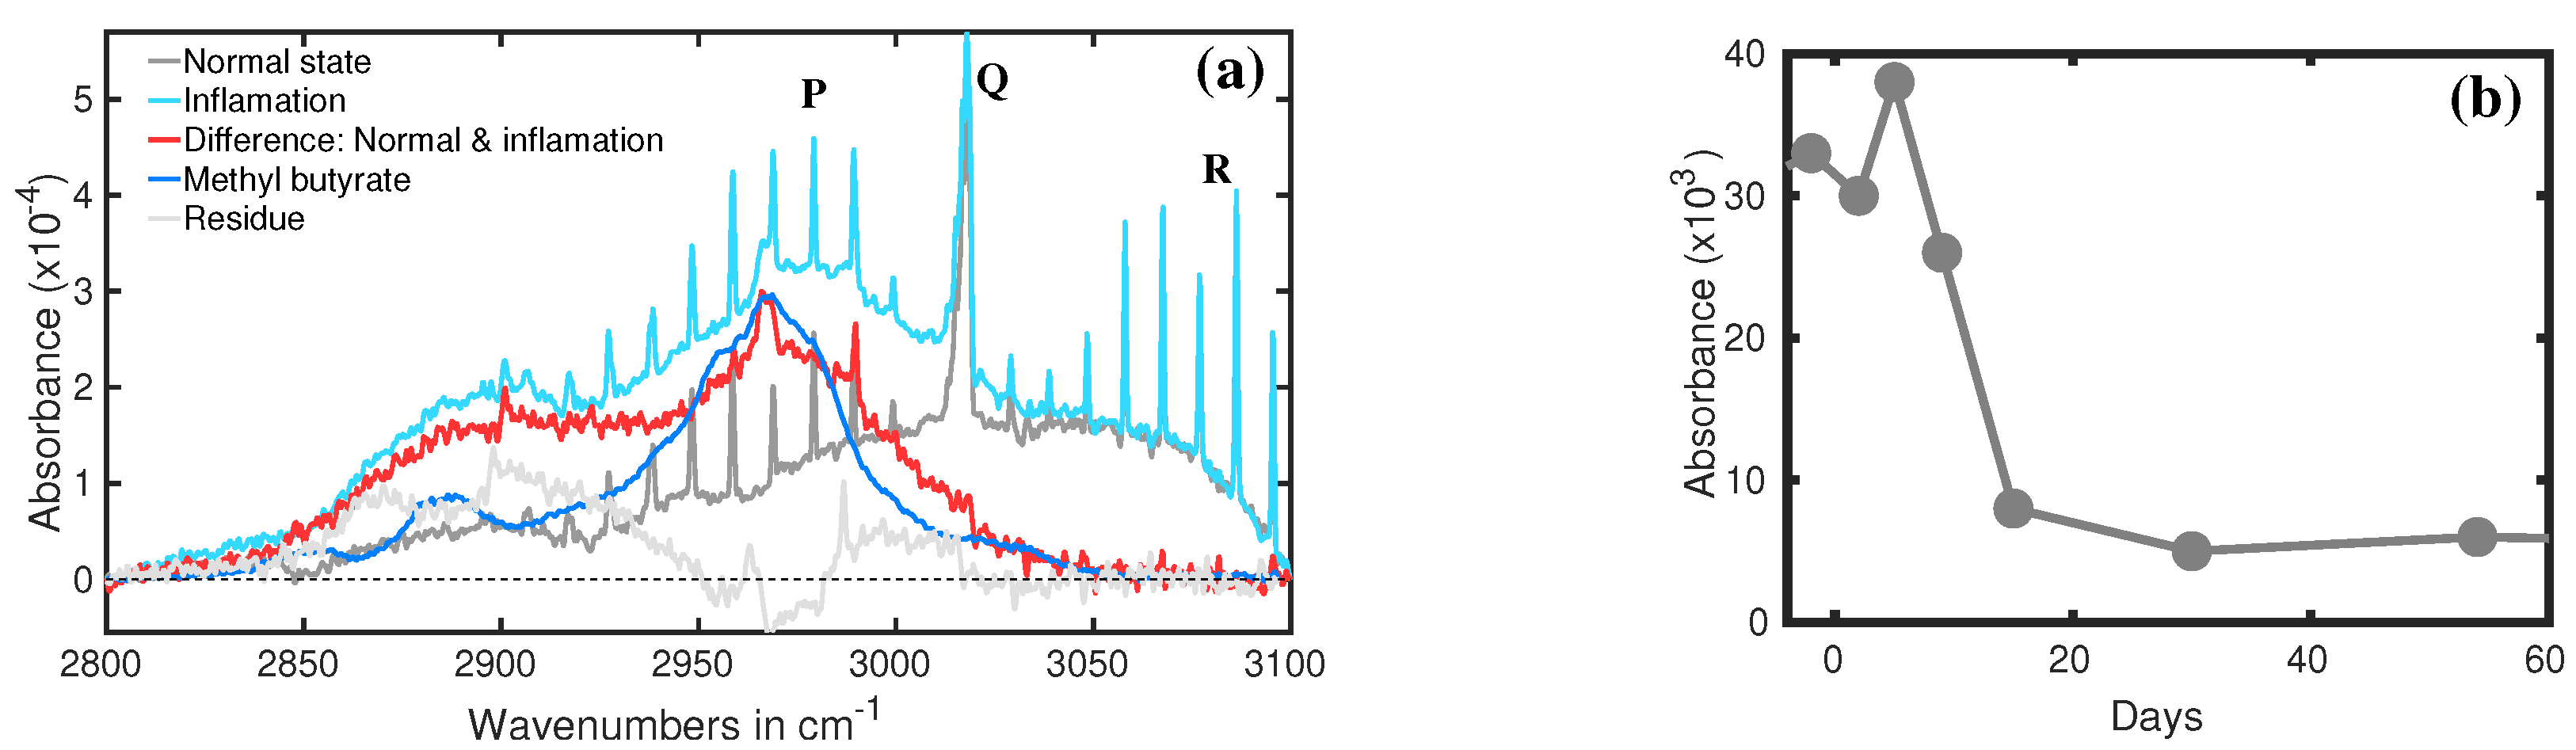
3.2. Antibiotic Treatment
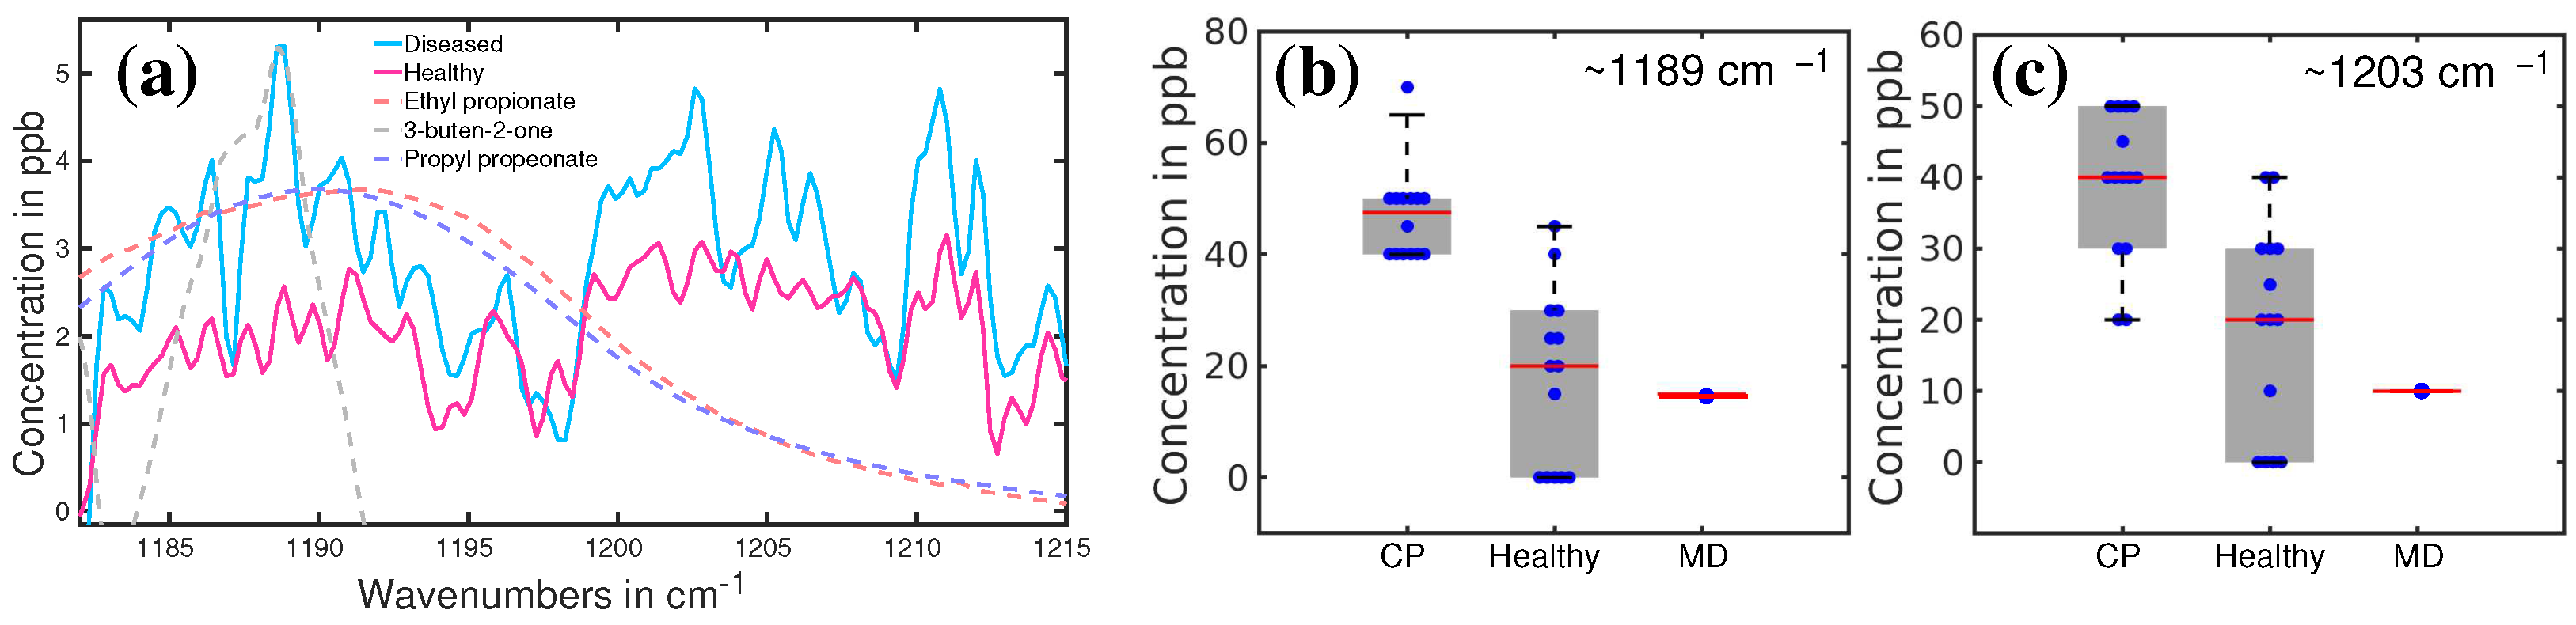
Current knowledge about the deviations of human microbiota caused by antibiotic treatment is substandard [15]. To improve this, the breath deviations of a volunteer affected by quadruple antibiotic therapy against Helicobacter pylori have been studied. Two spectral regions were identified where the corresponding spectral structures strongly deviated during the treatment [16]. One of them is shown in Figure 2. They were identified as methyl ester of butyric acid and ethyl ester of pyruvic acid. Both acids, generated by bacteria in the gut, are involved in fundamental metabolic processes. Therefore, these metabolites could serve to monitor acute gastritis and anti-Helicobacter pylori antibiotic treatment.

3.3. Cerebral Palsy

Cerebral palsy (CP) cannot be diagnosed with certainty in the first year of life because with the increasing development of the brain structure, pathological abnormalities become visible [17]. Cerebral palsy is caused by nonprogressive damage to the developing brain in early childhood. The damage occurs before, during, or shortly after birth [18]. An infrared-spectroscopy-based pilot study identified two distinguishable spectral regions for CP and healthy volunteers (Figure 3). More than 90% accuracy was achieved in identifying the above two groups [19]. Muscular dystrophy (MD) was separated out from the CP group (Figure 3b,c).

3.4. Prostate Cancer

Early detection of urogenital cancers is a real challenge. The available low-invasive diagnostics (PSA) of prostate cancer (PCa) suffers from unsatisfactory accuracy (<70%), even at advanced stages. To improve the accuracy, a pilot study was carried out using the exhaled breath of 63 volunteers representing three groups: (1) 19 healthy, (2) 28 with prostate cancer, (3) kidney and bladder cancer (KC and BC), each with 8 volunteers. Eight spectral regions were revealed that differentiated the groups (Figure 4), with eight corresponding VOCs. The resulting accuracy for distinguishing the groups exceeded 95% [20,21].

4. Conclusions

A brief review of disease-specific metabolite-based spectroscopic diagnostics was presented in this article. The state-of-the-art gas-phase biofluid analysis by means of infrared spectroscopy performed in our group was shown. Intrinsic molecular vibrations were used as fingerprints to detect specific metabolites from a complex molecular mixture, namely the breath. We demonstrated that by analyzing the breath, infrared spectroscopy is capable to detecting diabetes, cerebral palsy, bacterial infection, prostate cancer, etc. This technique is noninvasive and patient friendly and allows straightforward verification. To become an established diagnostic method for pathology diagnostics, it requires extensive studies with a large number of samples. Last but not least, many critical questions have to be answered. These include the following: (i) How accurately can the metabolites be identified in breath samples? (ii) Can small metabolites unambiguously be used to distinguish healthy and diseased states?

Institutional Review Board Statement

Not applicable.

Informed Consent Statement

Not applicable.

References

  1. Metzler, D.E. Biochemistry: The Chemical Reactions of Living Cells; Academic Press: Cambridge, MA, USA, 2003. [Google Scholar]
  2. Maiti, K.S.; Lewton, M.; Fill, E.; Apolonski, A. Human beings as islands of stability: Monitoring body states using breath profiles. Sci. Rep. 2019, 9, 16167. [Google Scholar] [CrossRef] [PubMed] [Green Version]
  3. Apolonski, A.; Roy, S.; Lampe, R.; Maiti, K.S. Molecular identification of bio-fluids in gas phase using infrared spectroscopy. Appl. Opt. 2020, 59, E36–E41. [Google Scholar] [CrossRef] [PubMed]
  4. Natale, C.D.; Paolesse, R.; Martinelli, E.; Capuano, R. Solid-state gas sensors for breath analysis: A review. Anal. Chim. Acta 2014, 824, 1–17. [Google Scholar] [CrossRef] [PubMed]
  5. Lamote, K.; Van Cleemput, J.; Nackaerts, K.; Vandermeersch, L.; Van Langenhove, H.; van Meerbeeck, J.P. Breath analysis by gas chromatography-mass spectrometry can be used to screen for pleural mesothelioma. Eur. Respir. J. 2016, 48, OA499. [Google Scholar] [CrossRef]
  6. Apolonski, A.; Roy, S.; Lampe, R.; Maiti, K.S. Application of Vibrational Spectroscopy in Biology and Medicine. Breath Analysis. Proceedings 2019, 27, 26. [Google Scholar] [CrossRef] [Green Version]
  7. Yu, M.C.; Rich, P.; Foreman, L.; Smith, J.; Yu, M.S.; Tanna, A.; Dibbur, V.; Unwin, R.; Tam, F.W.K. Label Free Detection of Sensitive Mid-Infrared Biomarkers of Glomerulonephritis in Urine Using Fourier Transform Infrared Spectroscopy. Sci. Rep. 2017, 7, 4601. [Google Scholar] [CrossRef] [PubMed] [Green Version]
  8. Maiti, K.S. Vibrational spectroscopy of Methyl benzoate. Phys. Chem. Chem. Phys. 2015, 17, 19735–19744. [Google Scholar] [CrossRef] [PubMed] [Green Version]
  9. Maiti, K.S. Broadband two dimensional infrared spectroscopy of cyclic amide 2-Pyrrolidinone. Phys. Chem. Chem. Phys. 2015, 17, 24998–25003. [Google Scholar] [CrossRef] [PubMed]
  10. Apolonski, A.; Maiti, K.S. Towards a standard operating procedure for revealing hidden volatile organic compounds in breath: The Fourier-transform IR spectroscopy case. Appl. Opt. 2021, 60, 4217–4224. [Google Scholar] [CrossRef] [PubMed]
  11. Gelin, M.F.; Blokhin, A.P.; Ostrozhenkova, E.; Apolonski, A.; Maiti, K.S. Theory helps experiment to reveal VOCs in human breath. Spectrochim. Acta Part Mol. Biomol. Spectrosc. 2021, 258, 119785. [Google Scholar] [CrossRef] [PubMed]
  12. de Lacy Costello, B.; Amann, A.; Al-Kateb, H.; Flynn, C.; Filipiak, W.; Khalid, T.; Osborne, D.; Ratcliffe, N.M. A review of the volatiles from the healthy human body. J. Breath Res. 2014, 8, 014001. [Google Scholar] [CrossRef] [PubMed]
  13. Maiti, K.S.; Lewton, M.; Fill, E.; Apolonski, A. Sensitive spectroscopic breath analysis by water condensation. J. Breath Res. 2018, 12, 046003. [Google Scholar] [CrossRef] [PubMed]
  14. Saasa, V.; Malwela, T.; Beukes, M.; Mokgotho, M.; Liu, C.P.; Mwakikunga, B. Sensing Technologies for Detection of Acetone in Human Breath for Diabetes Diagnosis and Monitoring. Diagnostics 2018, 8, 12. [Google Scholar] [CrossRef] [PubMed] [Green Version]
  15. Váradi, L.; Luo, J.L.; Hibbs, D.E.; Perry, J.D.; Anderson, R.J.; Orenga, S.; Groundwater, P.W. Methods for the detection and identification of pathogenic bacteria: Past, present, and future. Chem. Soc. Rev. 2017, 46, 4818–4832. [Google Scholar] [CrossRef] [PubMed]
  16. Maiti, K.S.; Apolonski, A. Monitoring the Reaction of the Body State to Antibiotic Treatment against Helicobacter pylori via Infrared Spectroscopy: A Case Study. Molecules 2021, 26, 3474. [Google Scholar] [CrossRef] [PubMed]
  17. Stotz, S.; von Zawadzky, R.M. Therapie der infantilen Cerebralparese: Das Münchner Tageskonzept (Pflaum Physiotherapie); Richard Pflaum Verlag GmbH & Co. KG: Munich, Germany, 2000. [Google Scholar]
  18. Alpay Savasan, Z.; Yilmaz, A.; Ugur, Z.; Aydas, B.; Bahado-Singh, R.O.; Graham, S.F. Metabolomic Profiling of Cerebral Palsy Brain Tissue Reveals Novel Central Biomarkers and Biochemical Pathways Associated with the Disease: A Pilot Study. Metabolites 2019, 9, 27. [Google Scholar] [CrossRef] [PubMed] [Green Version]
  19. Maiti, K.S.; Roy, S.; Lampe, R.; Apolonski, A. Breath indeed carries significant information about a disease. Potential biomarkers of cerebral palsy. J. Biophotonics 2020, 13, e202000125. [Google Scholar] [CrossRef] [PubMed]
  20. Maiti, K.S.; Fill, E.; Strittmatter, F.; Volz, Y.; Sroka, R.; Apolonski, A. Accurate diagnosis of prostate cancer via infrared spectroscopy of breath. In Proceedings of the European Conferences on Biomedical Optics 2021 (ECBO), Munich, Germany, 20–24 June 2021; p. ETu1A.3. [Google Scholar]
  21. Maiti, K.S.; Fill, E.; Strittmatter, F.; Volz, Y.; Sroka, R.; Apolonski, A. Towards reliable diagnostics of prostate cancer via breath. Sci. Rep. 2021, 11, 18381. [Google Scholar] [CrossRef] [PubMed]
Figure 1. The acetone in the breath of a healthy volunteer (black line). The red plot is the fitting curve of the acetone spectrum [13].
Engproc 08 00015 g001
Figure 2. (a) Infrared spectra of breath: healthy volunteer (gray) and with bacterial infection (cyan). The red curve is the spectral difference between the above two spectra. The blue plot is the IR spectrum of methyl butyrate. (b) The recovery dynamics of acute gastritis via the quadruple course (QAC) [16].
Engproc 08 00015 g002
Figure 3. (a) The average absorption spectra of healthy (red) and CP (blue) volunteers. Dashed lines: fitting curves of three main VOC candidates; (b,c) plot boxes for healthy, CP, and a patient with muscular dystrophy (MD), with the corresponding median values and error bars [19].
Engproc 08 00015 g003
Figure 4. (a) The average absorption spectra of healthy (red) and PCa (blue) volunteers. Dashed line: fitting curves of acetic anhydride, identified as a biomarker. (b) The result of the principal component analysis. Ellipses are drawn for the visualization of the three groups [21].
Engproc 08 00015 g004
Publisher’s Note: MDPI stays neutral with regard to jurisdictional claims in published maps and institutional affiliations.

