Proceeding Paper

A Physics-Informed Neural Network Method for Defect Identification in Polymer Composites Based on Pulsed Thermography †

1
Department of Chemical Engineering, National Tsinghua University, Hsinchu 300044, Taiwan
2
Department of Industrial and Information Engineering and Economics, University of L’Aquila, I-67100 L’Aquila, Italy
*
Author to whom correspondence should be addressed.
Presented at the 16th International Workshop on Advanced Infrared Technology & Applications, 26–28 October 2021; Available online: https://aita2021.sciforum.net/.
Eng. Proc. 2021, 8(1), 14; https://doi.org/10.3390/engproc2021008014
Published: 22 November 2021

Abstract

:
Defect detection in composite materials using active thermography is a well-studied field, and many thermographic data analysis methods have been proposed to facilitate defect visibility enhancement. In this work, we introduce a deep learning method that is constrained by known heat transfer phenomena described by a series of governing equations, also known in the literature as the physics-informed neural network (PINN). The accurate reconstruction of background information based on thermal images facilitates the identification of subsurface defects and reduction in noises caused by an uneven background and heating. The authors illustrate the method’s feasibility through experimental results obtained after pulsed thermography (PT) on a carbon fiber-reinforced polymer (CFRP) specimen.

1. Introduction

Nondestructive testing (NDT) is widely adopted as an inspection method for flaws in expensive products to preserve their integrity. Active infrared thermography (AIRT) is one such testing procedure as it is easy to implement, cheap, rapid, and efficient in covering large areas of inspection. It reduces the surrounding influence during testing and exploits the difference in physical phenomena between defect and sound regions. When the heat front passes through the defect region, the difference in material properties causes inhomogeneity in the subsurface temperature [1]. This inhomogeneity is used as a visual indication of the presence of defects.
However, in many cases, such temperature discontinuity is not always visible. Existing methods to enhance defect visibility make use of either physics-driven or statistics-driven methods for feature extraction, background elimination, and dimensionality reduction. These methods often require several physical assumptions to hold true which are difficult to satisfy and are adversely affected by uneven backgrounds. This work aimed to address these shortcomings by introducing a gray box model capable of considering the physics- and data-driven aspects in the field of thermography.

2. Methodologies

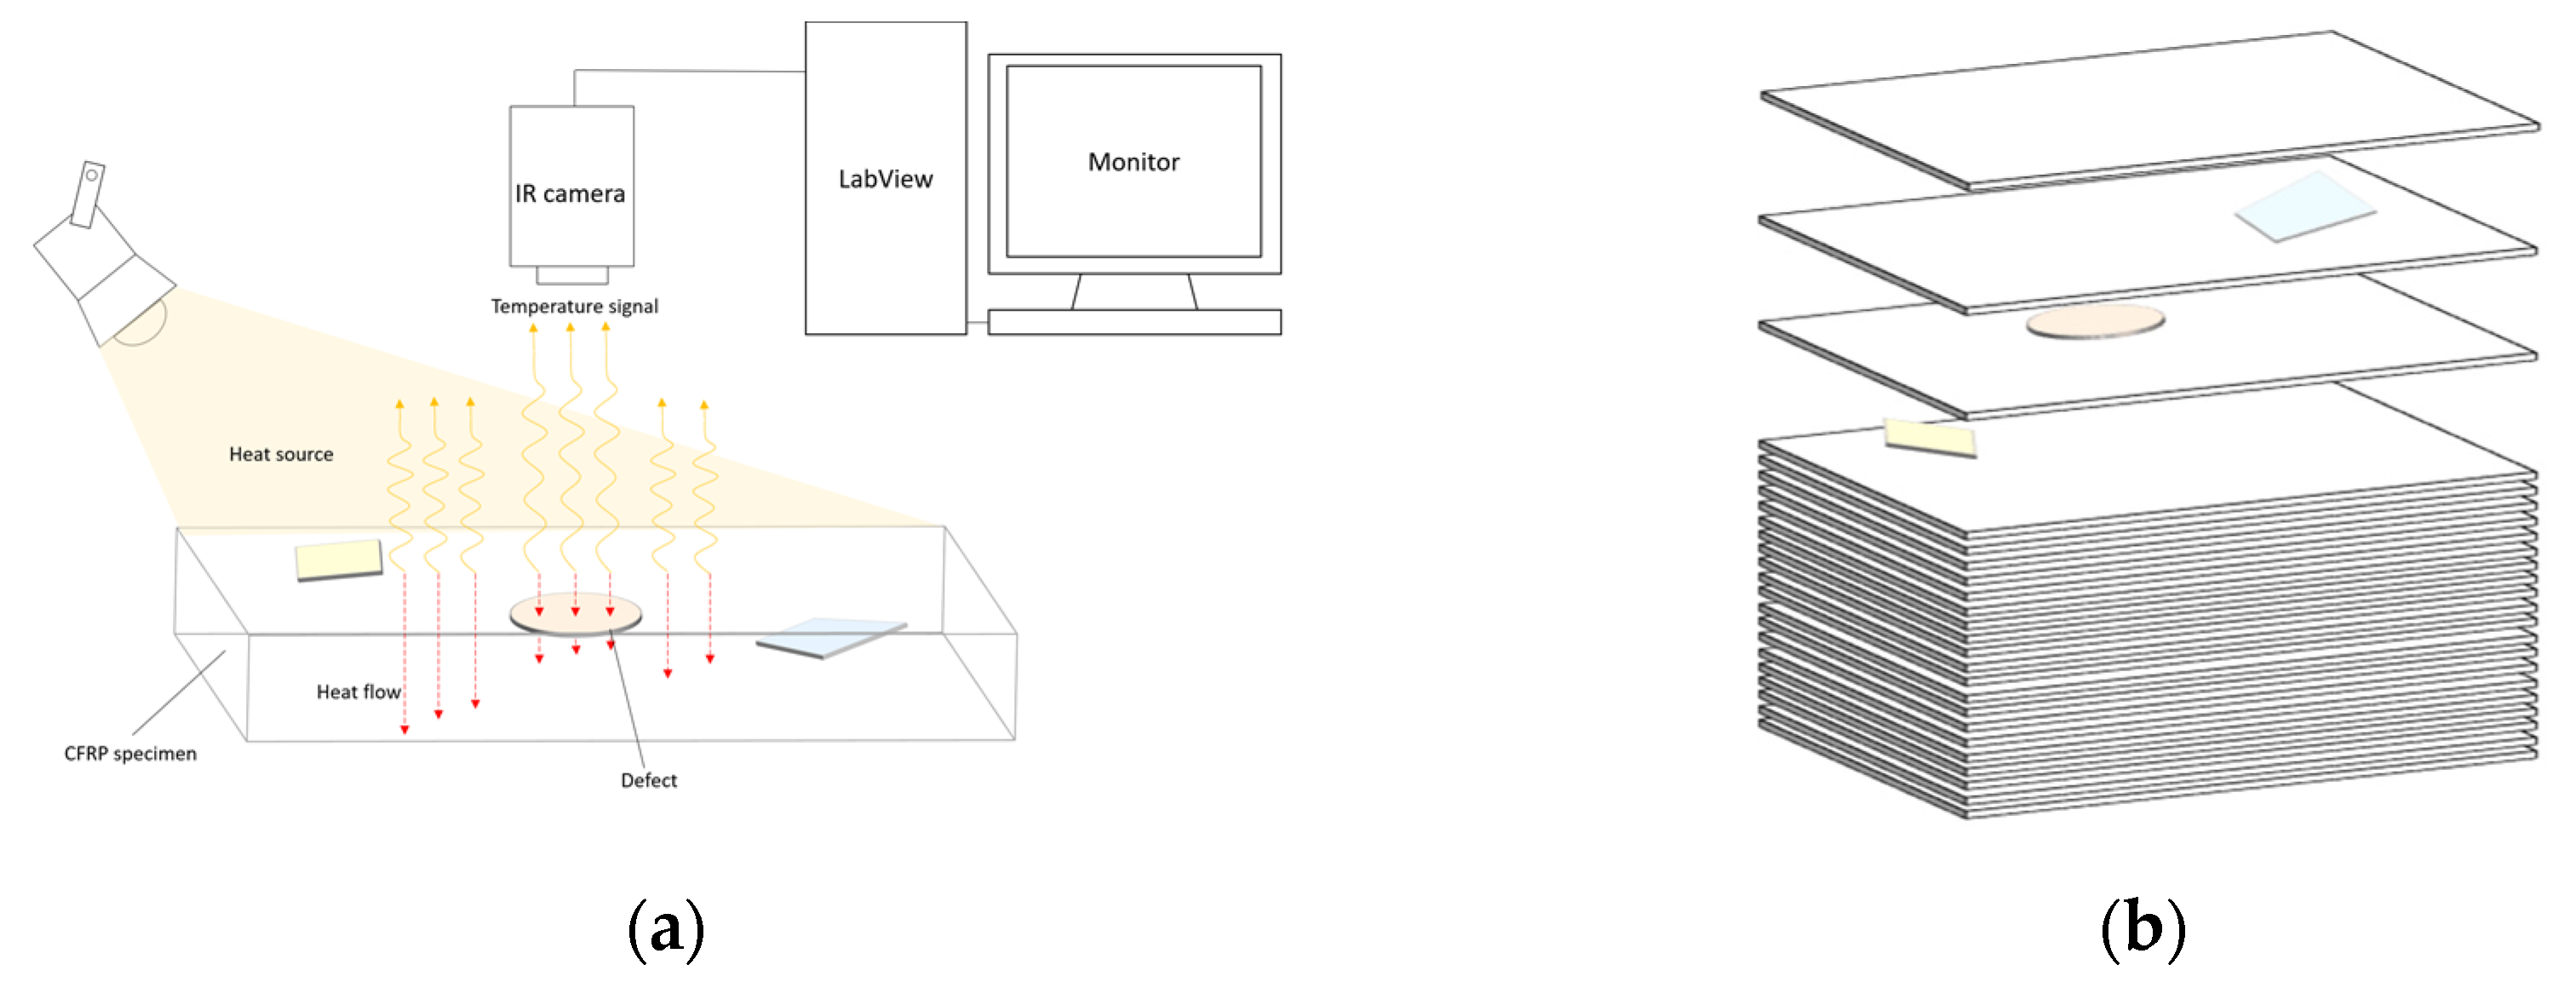
2.1. Pulsed Thermography

In this work, an AIRT procedure known as pulsed thermography (PT) was used [2]. To prepare NDT results, a procedure for PT involving pulse heating at a particular angle for a short period of time is illustrated in Figure 1a.
In particular, a CFRP specimen was analyzed in this work. The specimen was created by a vacuum-assisted resin transfer molding process. Teflon defects of various shapes were implanted in different layers, as illustrated in Figure 1b, to simulate a defected product. In particular, a trapezoidal-shaped defect with an upper edge length of 5 mm and a lower edge length of 15 mm, a circular-shaped defect with a radius of 20 mm, and a diamond-shaped defect with an edge length of 20 mm were placed just below the first, second, and third layers, respectively, where first layer was taken to be the surface layer. The total number of layers in the CFRP specimen was 20.
The material was irradiated with 3000 J of light for 3 ms and then cooled to ambient temperature. Pulse heating was used and led to nonuniform backgrounds in thermograms. During the whole process, an IR camera was used to record the surface temperature signals that were further processed with the software LabView using an IMage AcQuisition (IMAQ) system to obtain the data matrix for subsequent analyses. The data acquisition frequency was set to 30 frames per second.

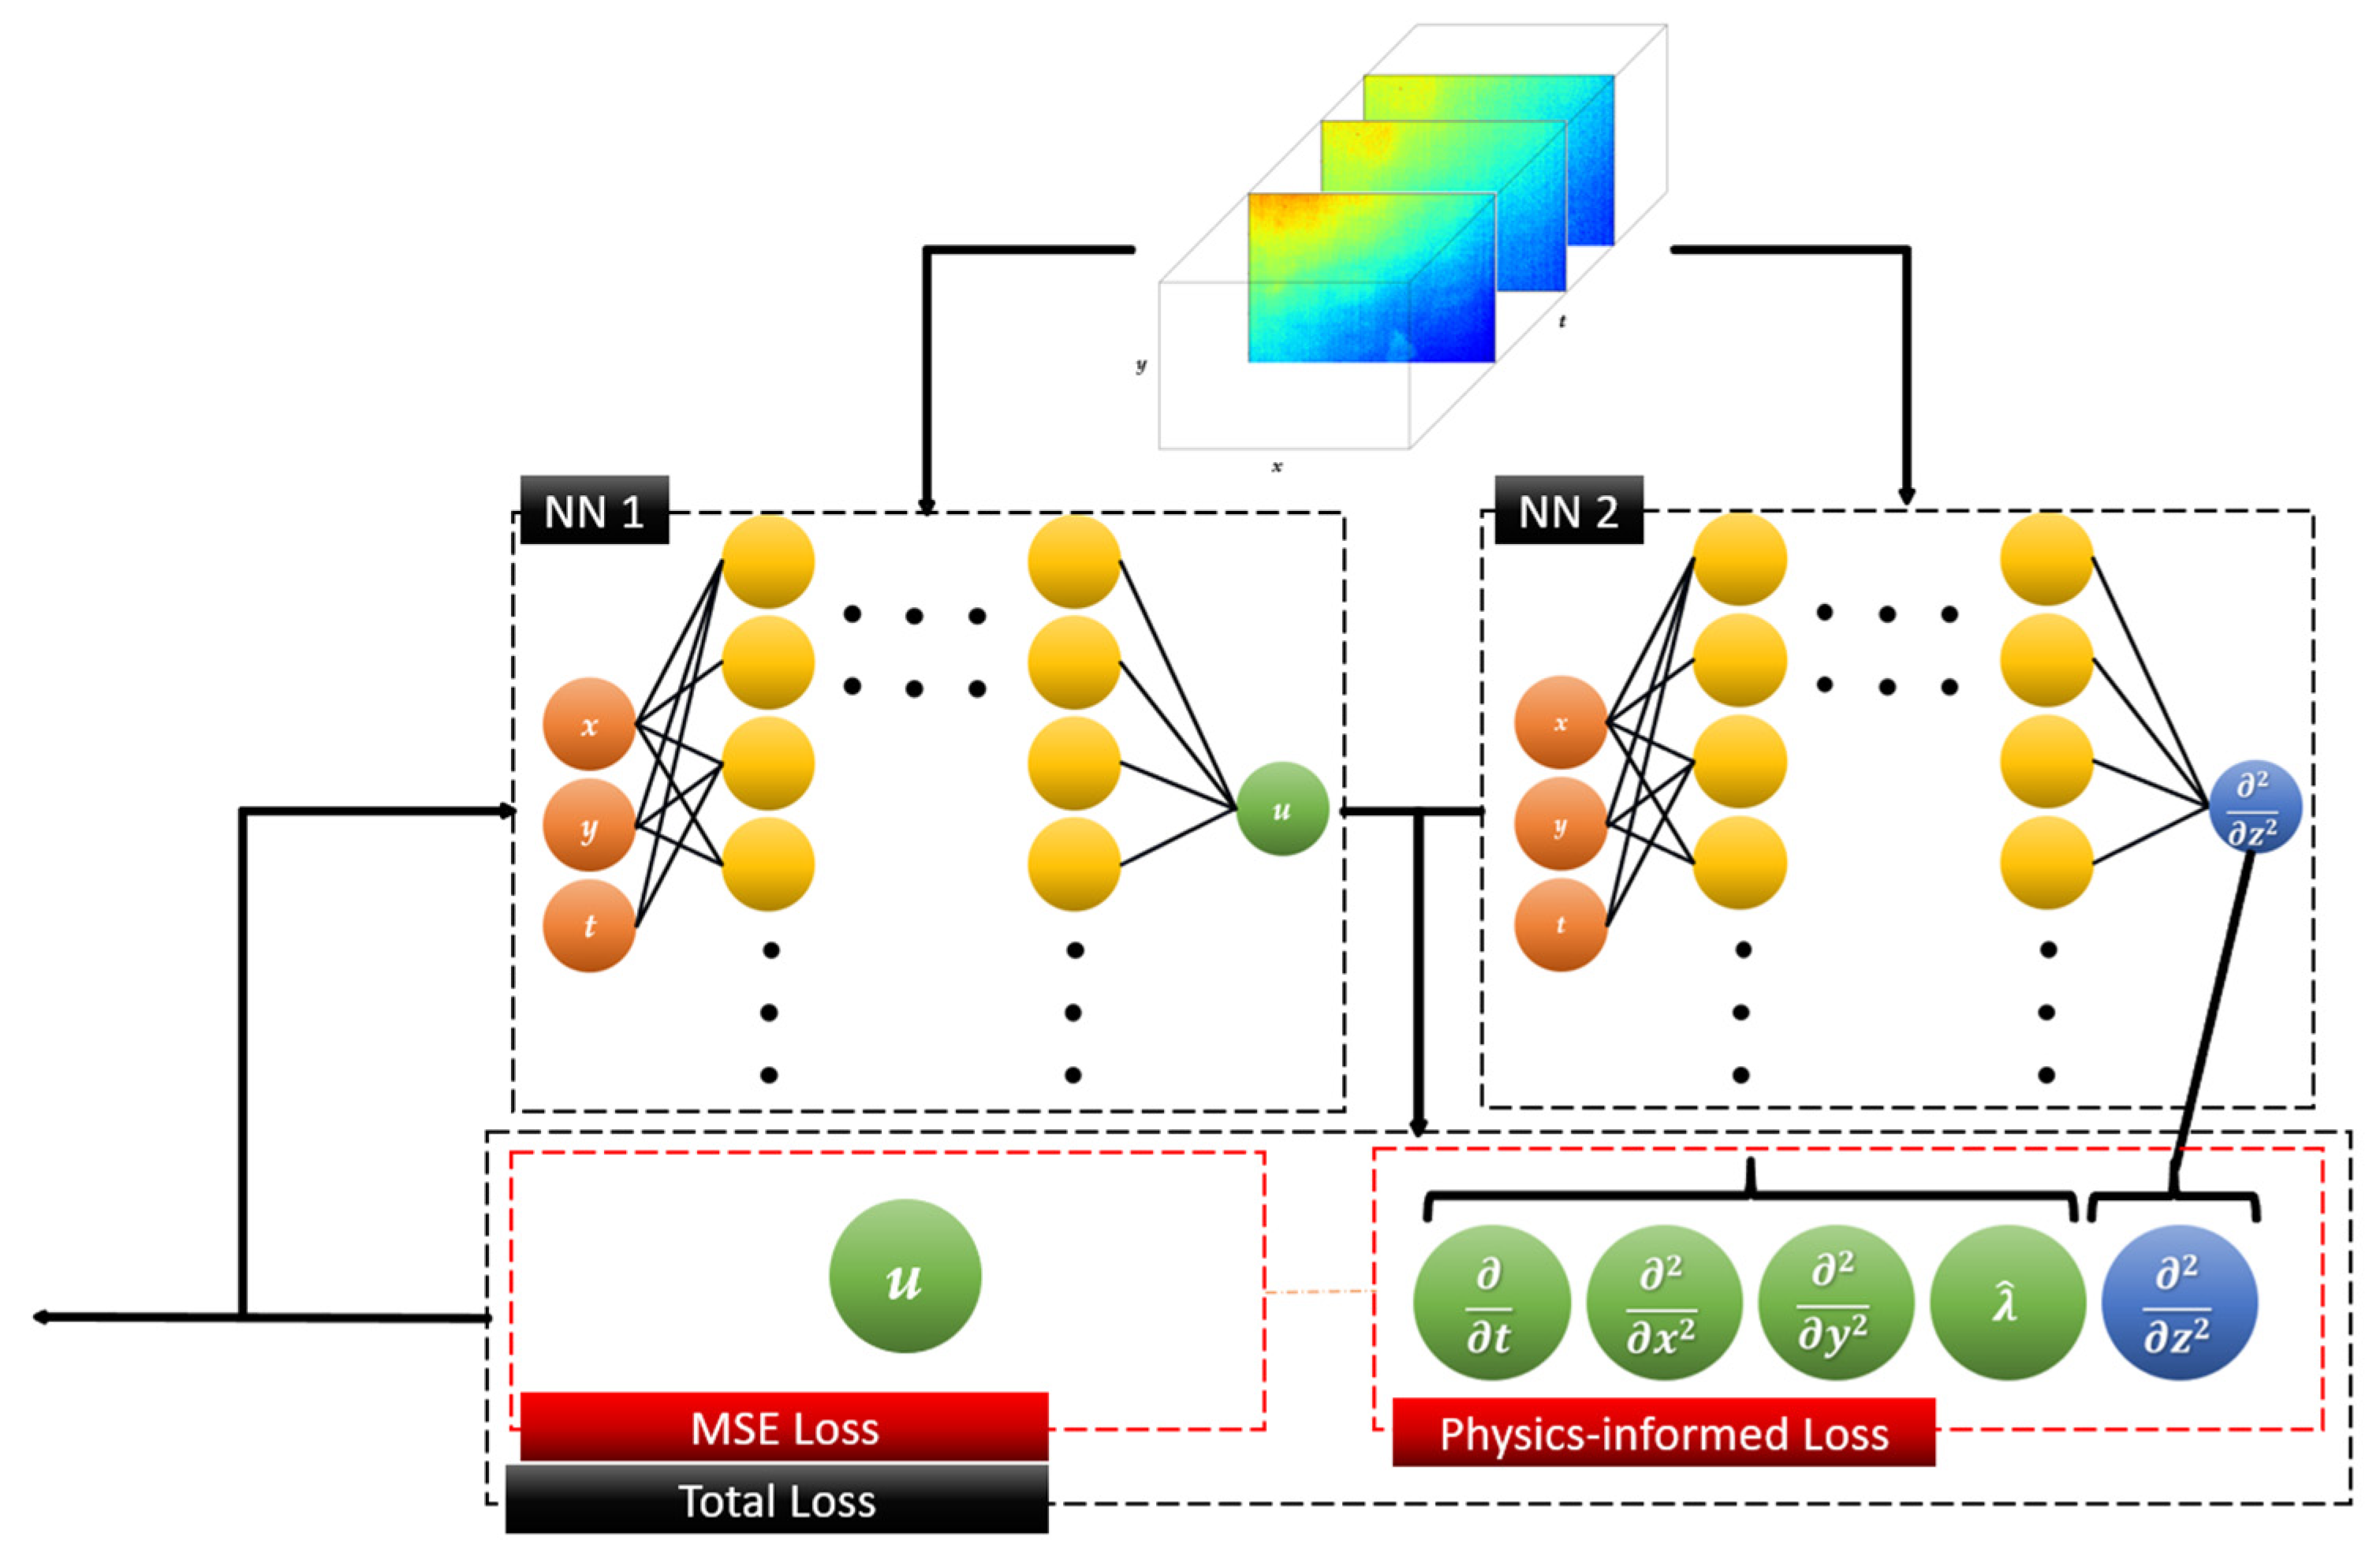
2.2. Physics-Informed Neural Network (PINN)

Deep neural networks (DNNs) have previously been applied in the classification of defects. The results require prior labeling of training data and are not suitable for practical purposes. Herein, the authors adopted a method known as PINN based on the work of Raissi et al. [3] to further explore the new possibility of using the generalizability of DNNs. Readers are directed to [4] for a comprehensive review on DNNs.
To utilize a priori physical knowledge of the process, the authors formulated the loss function of the network as follows:
Loss = BC loss + Prediction loss + Partial Differential Equation(PDE) loss,
BC   loss :   1 N B C x i , y i , t i Ω B C x u ^ i ( x i , y i , t i ) 2 2 ,  
Prediction   loss :   1 N R a n d o m x i , y i , t i Ω Random u ^ i ( x i , y i , t i ) u i 2 2 ,
f P D E   ( u ( x i , y i , t i ) ) = u ^ t λ ^   ( 2 u ^ x 2 + 2 u ^ y 2 + 2 u z 2 ^ ( x i , y i , t i ) ) ,    
PDE   loss :   1 N f + R a n d o m x i , y i , t i Ω f Ω R a n d o m f P D E ( u ^ i ( x i , y i , t i ) ) 2 2 ,
A neural network with such a loss function is equivalent to a PINN. Here, NRandom denotes the number of thermogram pixels randomly sampled from the thermographic data; Nf is the number of collocation points sampled based on [3] using Latin hypercube sampling methods; NBC denotes the number of points at boundary conditions; Ω denotes the state space; and ||·||2 denotes the L2 norm. The neural network seeks to minimize any deviation from the following losses:
  • BC Loss: Neumann boundary conditions (BC) where no heat flux occurs at the edges of the specimen;
  • Prediction Loss: Mean square error between prediction u ^ i and actual responses ui;
  • PDE Loss: PDE whose form is given by 3-dimensional Fourier’s law of heat diffusion.
The network architecture is shown in Figure 2. For the first neural network (NN 1), the three input channels consist of the horizontal location x, vertical location y, and time information t. The output channel consists of the predicted temperature signal u, labeled by original data as shown in Figure 2. As the subsurface temperature is not captured during the experiments, we introduced another surrogate model, i.e., NN 2, for 2 u z 2 ^ of heat transfer into the CFRP layers, accounting for the missing heat flux term in the PDE loss function. Both the constant thermal diffusivity λ ^ and 2 u z 2 ^ are calculated by minimizing the loss function during model training.

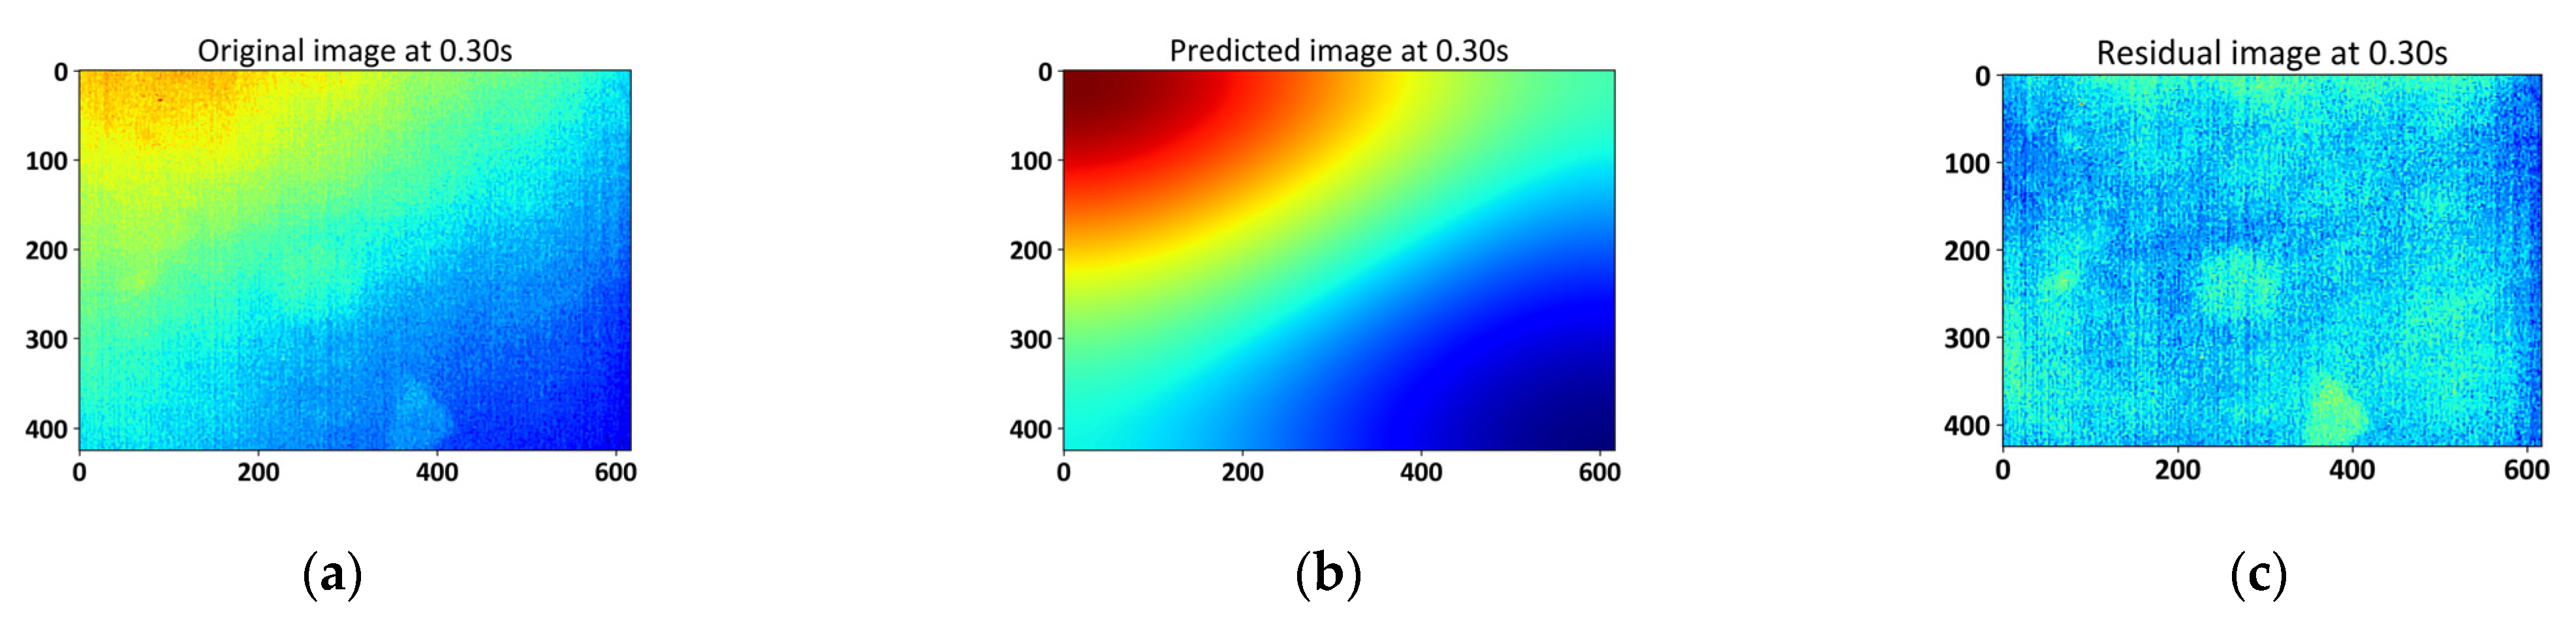
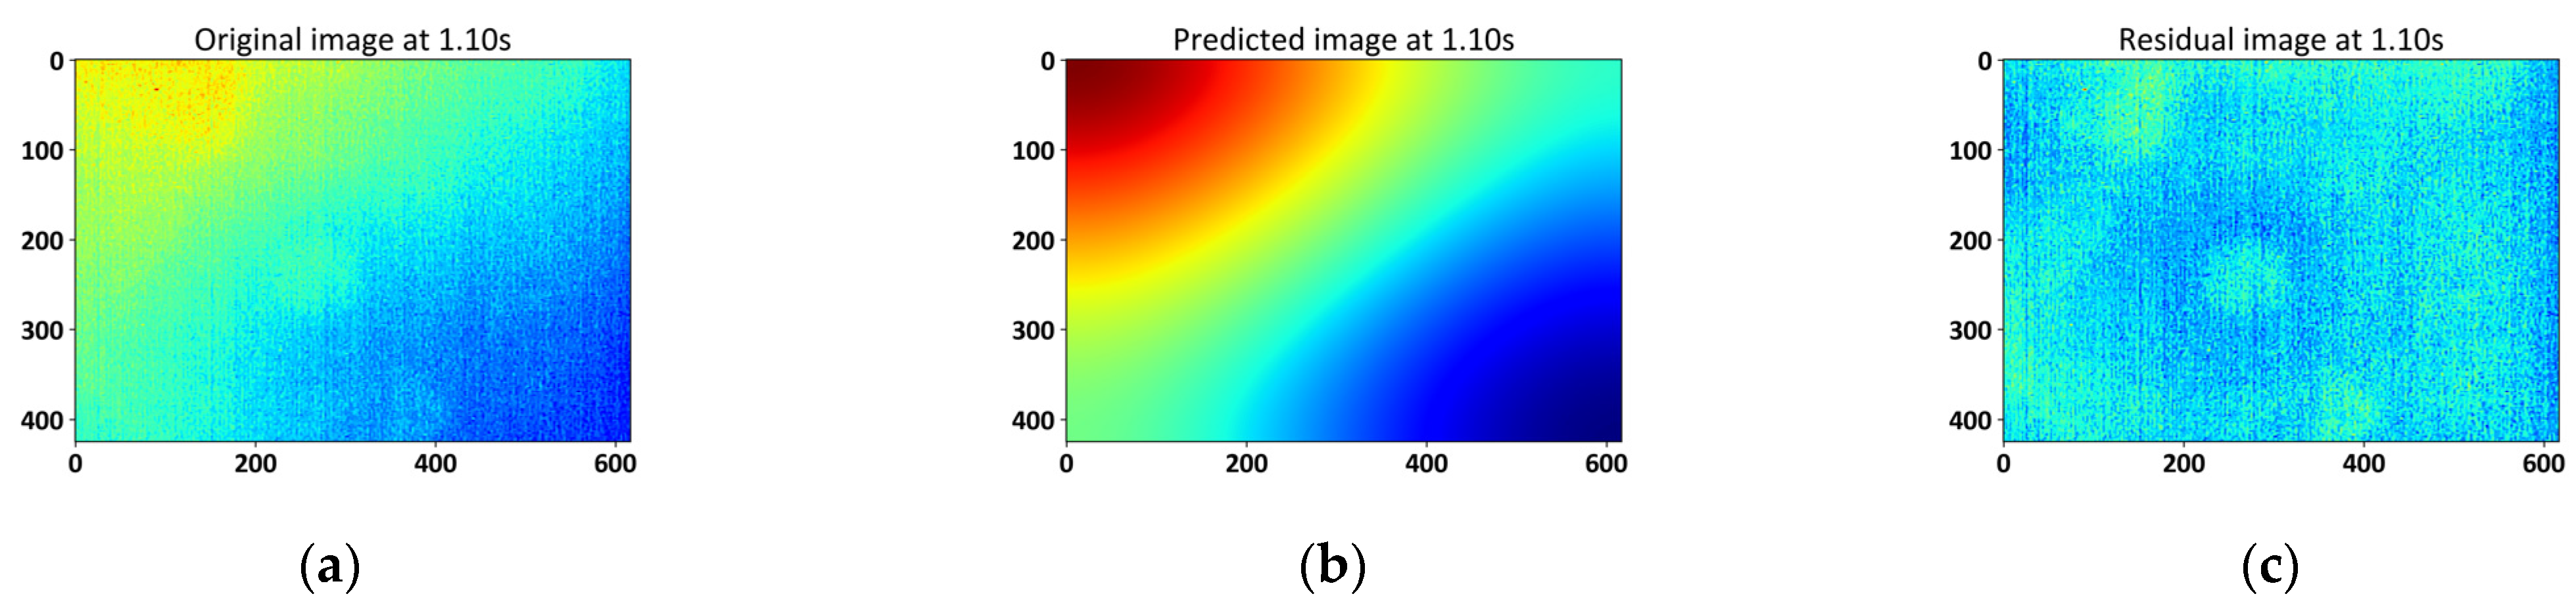
3. Results and Discussion

For the original thermogram shown in Figure 3a, only the shallowest trapezoidal defect on the bottom right can be seen. In the middle column, the PINN captures and reconstructs the temperature gradient of the original images. It is reasonable to assume that during the training phase, the randomly sampled training data consist mostly of the sound region; hence, the PINN reconstructs the nonuniform backgrounds contained by the raw images. After performing background elimination by calculating the residues between the original thermograms and the reconstructions, the anomalous values due to the presence of defects can be plotted and visualized. Furthermore, the deepest diamond-shaped defect on the top left is not visible (Figure 3c) in the early cooling phase as the heat front has not reached the defect. However, it can be discovered in the processed thermogram that was collected about 0.80 s later, as shown in the residual image in Figure 4c. In such a manner, the processing results also provide more depth information of the defects. Additionally, principal component thermography (PCT) [5] can be performed to better extract defect features. The comparison results are shown in Figure 5a,b. Only principal components (PC) with the greatest defect visibility are shown. The PCT results in residual images show clearer edges and saliency.

References

  1. Lai, W.L.; Kou, S.C.; Poon, C.S.; Tsang, W.F.; Ng, S.P.; Hung, Y.Y. Characterization of flaws embedded in externally bonded CFRP on concrete beams by infrared thermography and shearography. J. Nondestruct. Eval. 2009, 28, 27–35. [Google Scholar] [CrossRef]
  2. Maldague, X. Theory and Practice of Infrared Technology for Nondestructive Testing; Wiley: New York, NY, USA, 2001. [Google Scholar]
  3. Raissi, M.; Perdikaris, P.; Karniadakis, G.E. Physics-informed neural networks: A deep learning framework for solving forward and inverse problems involving nonlinear partial differential equations. J. Comput. Phys. 2019, 378, 686–707. [Google Scholar] [CrossRef]
  4. LeCun, Y.; Bengio, Y.; Hinton, G. Deep learning. Nature 2015, 521, 436–444. [Google Scholar] [CrossRef] [PubMed]
  5. Rajic, N. Principal component thermography for flaw contrast enhancement and flaw depth characterisation in composite structures. Compos. Struct. 2002, 58, 521–528. [Google Scholar] [CrossRef]
Figure 1. (a) An illustration of the experiment schematics for PT used in this study; (b) shapes, depth locations, and relative planar locations of defects in the CFRP layers.
Engproc 08 00014 g001
Figure 2. Network architecture of the PINN employed in this work.
Engproc 08 00014 g002
Figure 3. PINN results on thermogram captured 0.30 s after maximal surface temperature: (a) original image; (b) prediction image; (c) residual image.
Engproc 08 00014 g003
Figure 4. PINN results on thermogram captured 1.10 s after maximal surface temperature: (a) original image; (b) prediction image; (c) residual image.
Engproc 08 00014 g004
Figure 5. PCT results (only principal components with the greatest defect visibility are shown) on: (a) original images; (b) residual images.
Engproc 08 00014 g005
Publisher’s Note: MDPI stays neutral with regard to jurisdictional claims in published maps and institutional affiliations.

