1. Introduction
In recent years, the development of autonomous systems has gained significant traction, particularly within the context of autonomous vehicles and robotics [
1]. These systems require sophisticated methods for environment perception, data processing, and decision-making to navigate and perform tasks effectively [
2]. One critical aspect of autonomous navigation is the accurate detection and interpretation of environmental features. This task is often facilitated using various sensors and sophisticated algorithms that process the sensor data to identify and interpret critical features in the environment [
3].
In this paper, we present an approach to environmental feature detection and interpretation using the Robot Operating System 2 (ROS 2), focusing on the identification, processing, and clustering of traffic cones for autonomous navigation and, based on this clustering, planning a path. The primary challenge in autonomous navigation is to ensure that the system can accurately perceive and interpret its surroundings [
4,
5,
6,
7,
8]. This involves the detection of obstacles, landmarks, and other relevant features that can influence the navigation path [
3,
6]. Traffic cones are commonly used in various scenarios, such as construction sites, sporting events, and autonomous vehicle testing tracks, to delineate paths and boundaries. The accurate detection and processing of these cones are crucial for the safe and efficient operation of autonomous systems in such environments.
In Driverless Formula Student challenges, traffic cones serve as static boundaries that must be detected and interpreted in real-time with very high speed to adjust the vehicle’s path accordingly [
4,
5,
6]. The ability to identify these cones accurately and predict their spatial relationships with other objects in the environment is vital for avoiding collisions and ensuring smooth navigation [
7,
8,
9,
10]. This paper addresses the problem of detecting and interpreting traffic cones, focusing on the clustering and making a connection between yellow, blue, and orange cones and the subsequent creation of navigation lines and race lines (points) to aid in path planning. ROS 2 is a widely adopted framework for developing robotic applications, offering a robust ecosystem for communication, control, and data processing in distributed systems. Utilizing ROS 2, this paper implements a system for subscribing to sensor data, processing this data to detect traffic cones, and publishing the processed information for further use in navigation algorithms. The system leverages several ROS 2 components, including “rclpy” for Python-based node management, “visualization_msgs” for marker visualization, and “geometry_msgs” for representing spatial information.
The primary objective of the implemented system is to detect yellow and blue traffic cones and establish connections between them to facilitate navigation. This involves subscribing to topics that provide marker arrays representing the cones, processing these markers to identify their positions, and calculating the spatial relationships between them. The system also aims to publish visualization markers that represent these relationships, providing a clear and interpretable map of the environment for further processing by navigation algorithms.
2. Materials and Methods
2.1. Object Detection Using the YOLOv8 Model
A custom-trained YOLOv8s model was employed to detect objects in images captured by a ZED2i camera. This setup was implemented within an ROS2 framework to ensure real-time performance. The cone detector component subscribes to the ZED2i camera’s image data stream, processes the images using the YOLOv8s model, and publishes the bounding box coordinates of detected cones in the plane of the image. An OpenCV image format is used, applying a mask to the region of interest and creating a blob for the YOLO model. Then, the model processes the blob to detect objects, outputting bounding boxes and class probabilities. Non-maximum suppression (NMS) is applied to filter out redundant detections. The detected cones are then classified by the following unique identifiers: yellow cones, blue cones, and small orange cones.
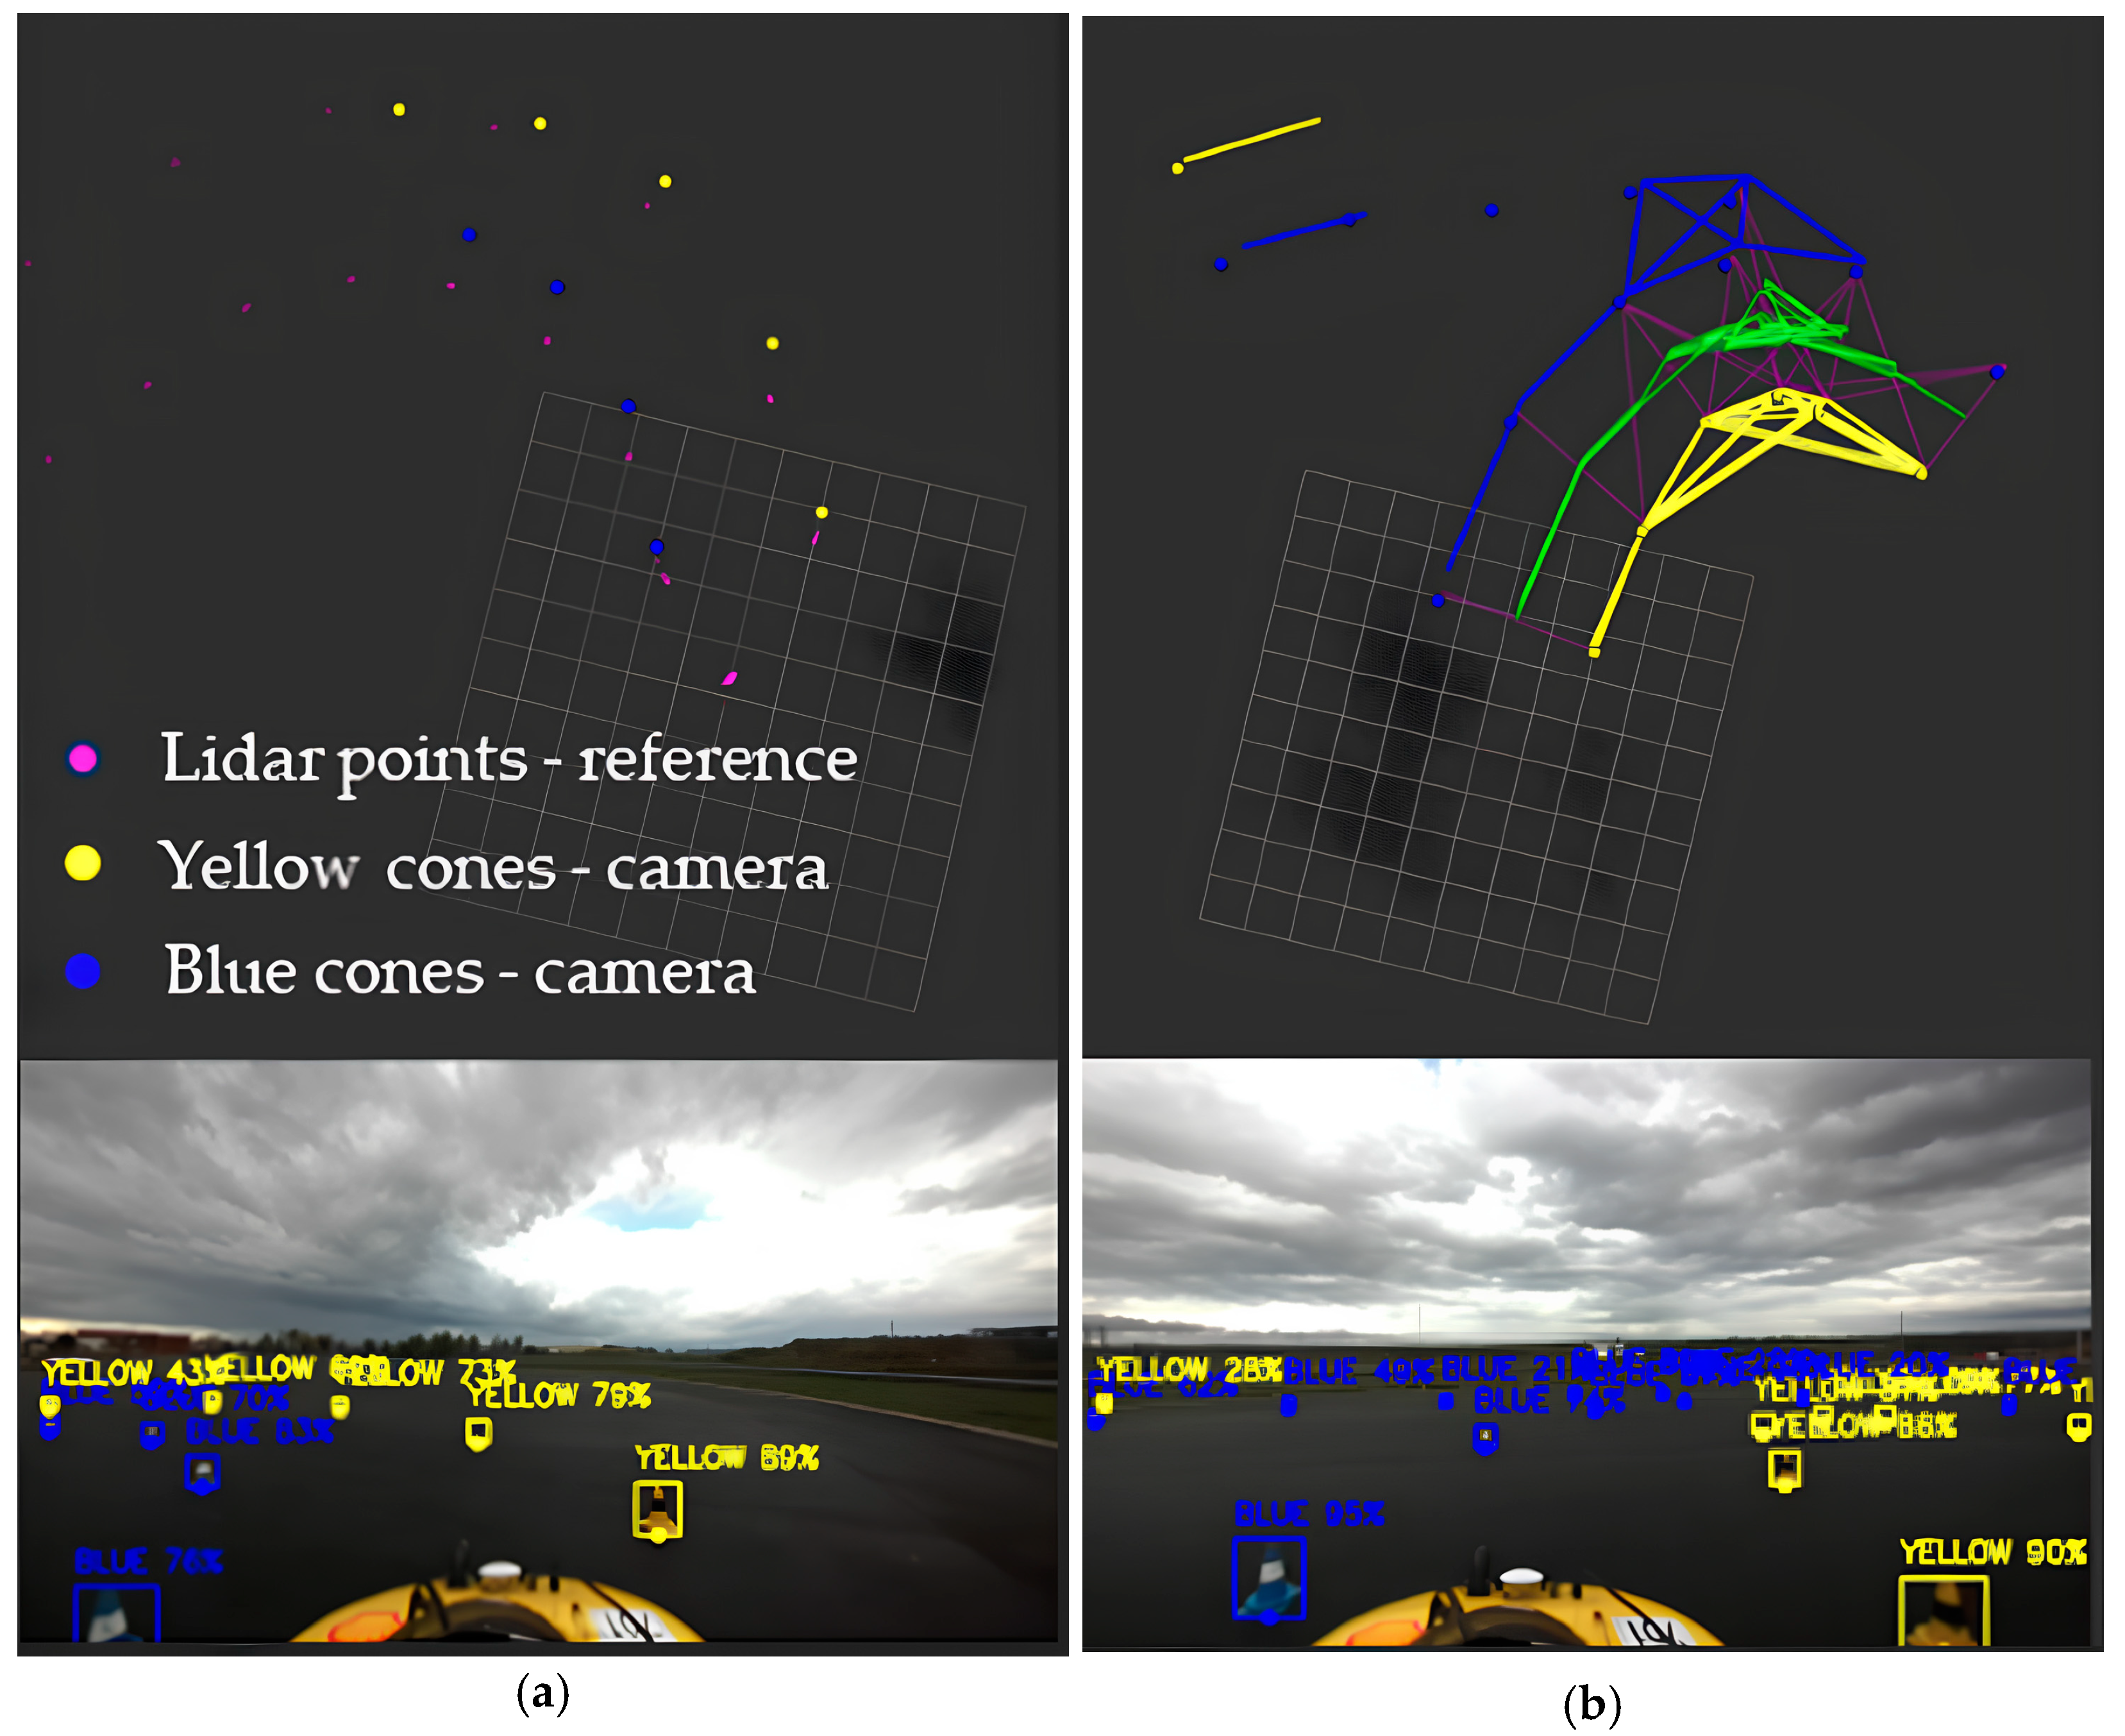
The coordinates of these objects are calculated and given in the image frame. The detected cone coordinates are published to a specific ROS topic, and the annotated image is published for visualization. Example scenes of sufficient and insufficient detection are shown in
Figure 1.
2.2. Deprojection of the Cones
Deprojection of the cones means the transformation of the image coordinates to real-world local coordinates. The deprojection directly uses the output of the detection and translates 2D image coordinates of detected cones to 3D real-world coordinates. This transformation considers the camera’s intrinsic parameters and its position and orientation relative to the ground. These values are defined as parameters of the algorithm that must be set according to the camera positioning. As a final step, the deprojection component separates the cones by type and provides the transformed coordinates of the yellow, blue, and orange cones. Again, for visualization, a separate signal is provided, besides the Cartesian coordinates of the cones. The result is illustrated in
Figure 2a, while
Figure 2b shows the reconstructed spatial relations of the yellow and blue cones and the resulting path edges as part of the deprojection process.
2.3. Lane Edge Creator
This component processes the cone data to create visual markers that represent lines connecting cones and calculates middle points between these lines. For one given yellow cone, the distance to each blue cone is calculated, and vice versa. If the distance between a yellow and blue cone falls within a specified range, a line marker is created. Then, a point is calculated at the middle point of each line. This process is performed iteratively for all detected cones. Cones whose positions fall outside this range are neglected. Finally, the same procedure is repeated at each calculation cycle. An illustration is shown in
Figure 2b. It is shown that the local cones are detected, the line creation is performed successfully, and the green line (indicating the centerline of the lane) is drawn properly. It is also seen that false-positive lane edges, including further cones (that relate to the counterflow lane), are indicated. However, these cones are not part of the centerline, and, therefore, this false positive selection is not a problem. Markers from the previous iteration are deleted before publishing new markers. The IDs of the current markers are updated to manage the lifecycle and avoid conflicts. It is noted that the function also creates additional connections between cones of the same color. The calibration of the algorithm is relatively easy as the number of parameters is low. The main parameter is the distance between blue and yellow cones to be connected. The distance is the Euclidean distance, and the formula is given in (1) as follows:
The middle point between cones is calculated as per (2):
where
is the 2D representation of the cones, and
is the 2D position of the middle point, calculated as the geometrical average of lane edge cones.
3. Results and Discussion
In addition to the system’s high performance, a critical analysis reveals several limitations. Firstly, the cone detection accuracy is highly dependent on lighting conditions, with the performance dropping by 20% in low-light scenarios. Furthermore, while the system handles dynamic environments well, it struggles with cone occlusion, particularly when cones are spaced closer than 1.0 m. Environmental factors such as dust, dirt, and reflections from the ground surface may also negatively impact camera performance, leading to false positives or inaccurate detections. Additionally, environmental clutter, such as overlapping cones or irrelevant objects, can interfere with the detection accuracy, necessitating advanced filtering techniques to mitigate these issues.
The need for accurate real-time deprojection was also evident during high-speed testing, where minor errors in distance estimation could lead to incorrect path generation. To combat this, enhancing sensor fusion between the LiDAR and the ZED camera could further improve the system’s reliability. This would allow for the more precise localization of cones even in less-than-ideal conditions, enhancing the robustness of the clustering and planning system.
To provide objective benchmarks, the detection system was evaluated under various conditions. For example, at a speed of 10.0 km/h, the system detects cones up to 10.0 m with an average detection delay of 200.0 ms. The deprojection algorithm successfully transforms image coordinates to the 3D space with an accuracy of ±20.0 cm, while the lane edge detection system creates track boundaries within an error margin of 10.0 cm. In comparing different methods, our lane detection had a response time of 8.0 ms. Further tests indicated that the system could adjust smoothly when new cones are added to the scene in real time, maintaining an efficient computation time without major delays.
In summary, while the proposed system demonstrates strong performance in ideal conditions, future work should focus on addressing the limitations posed by environmental conditions and the need for improved sensor fusion. These improvements will be critical for ensuring consistent performance in more diverse and challenging environments.
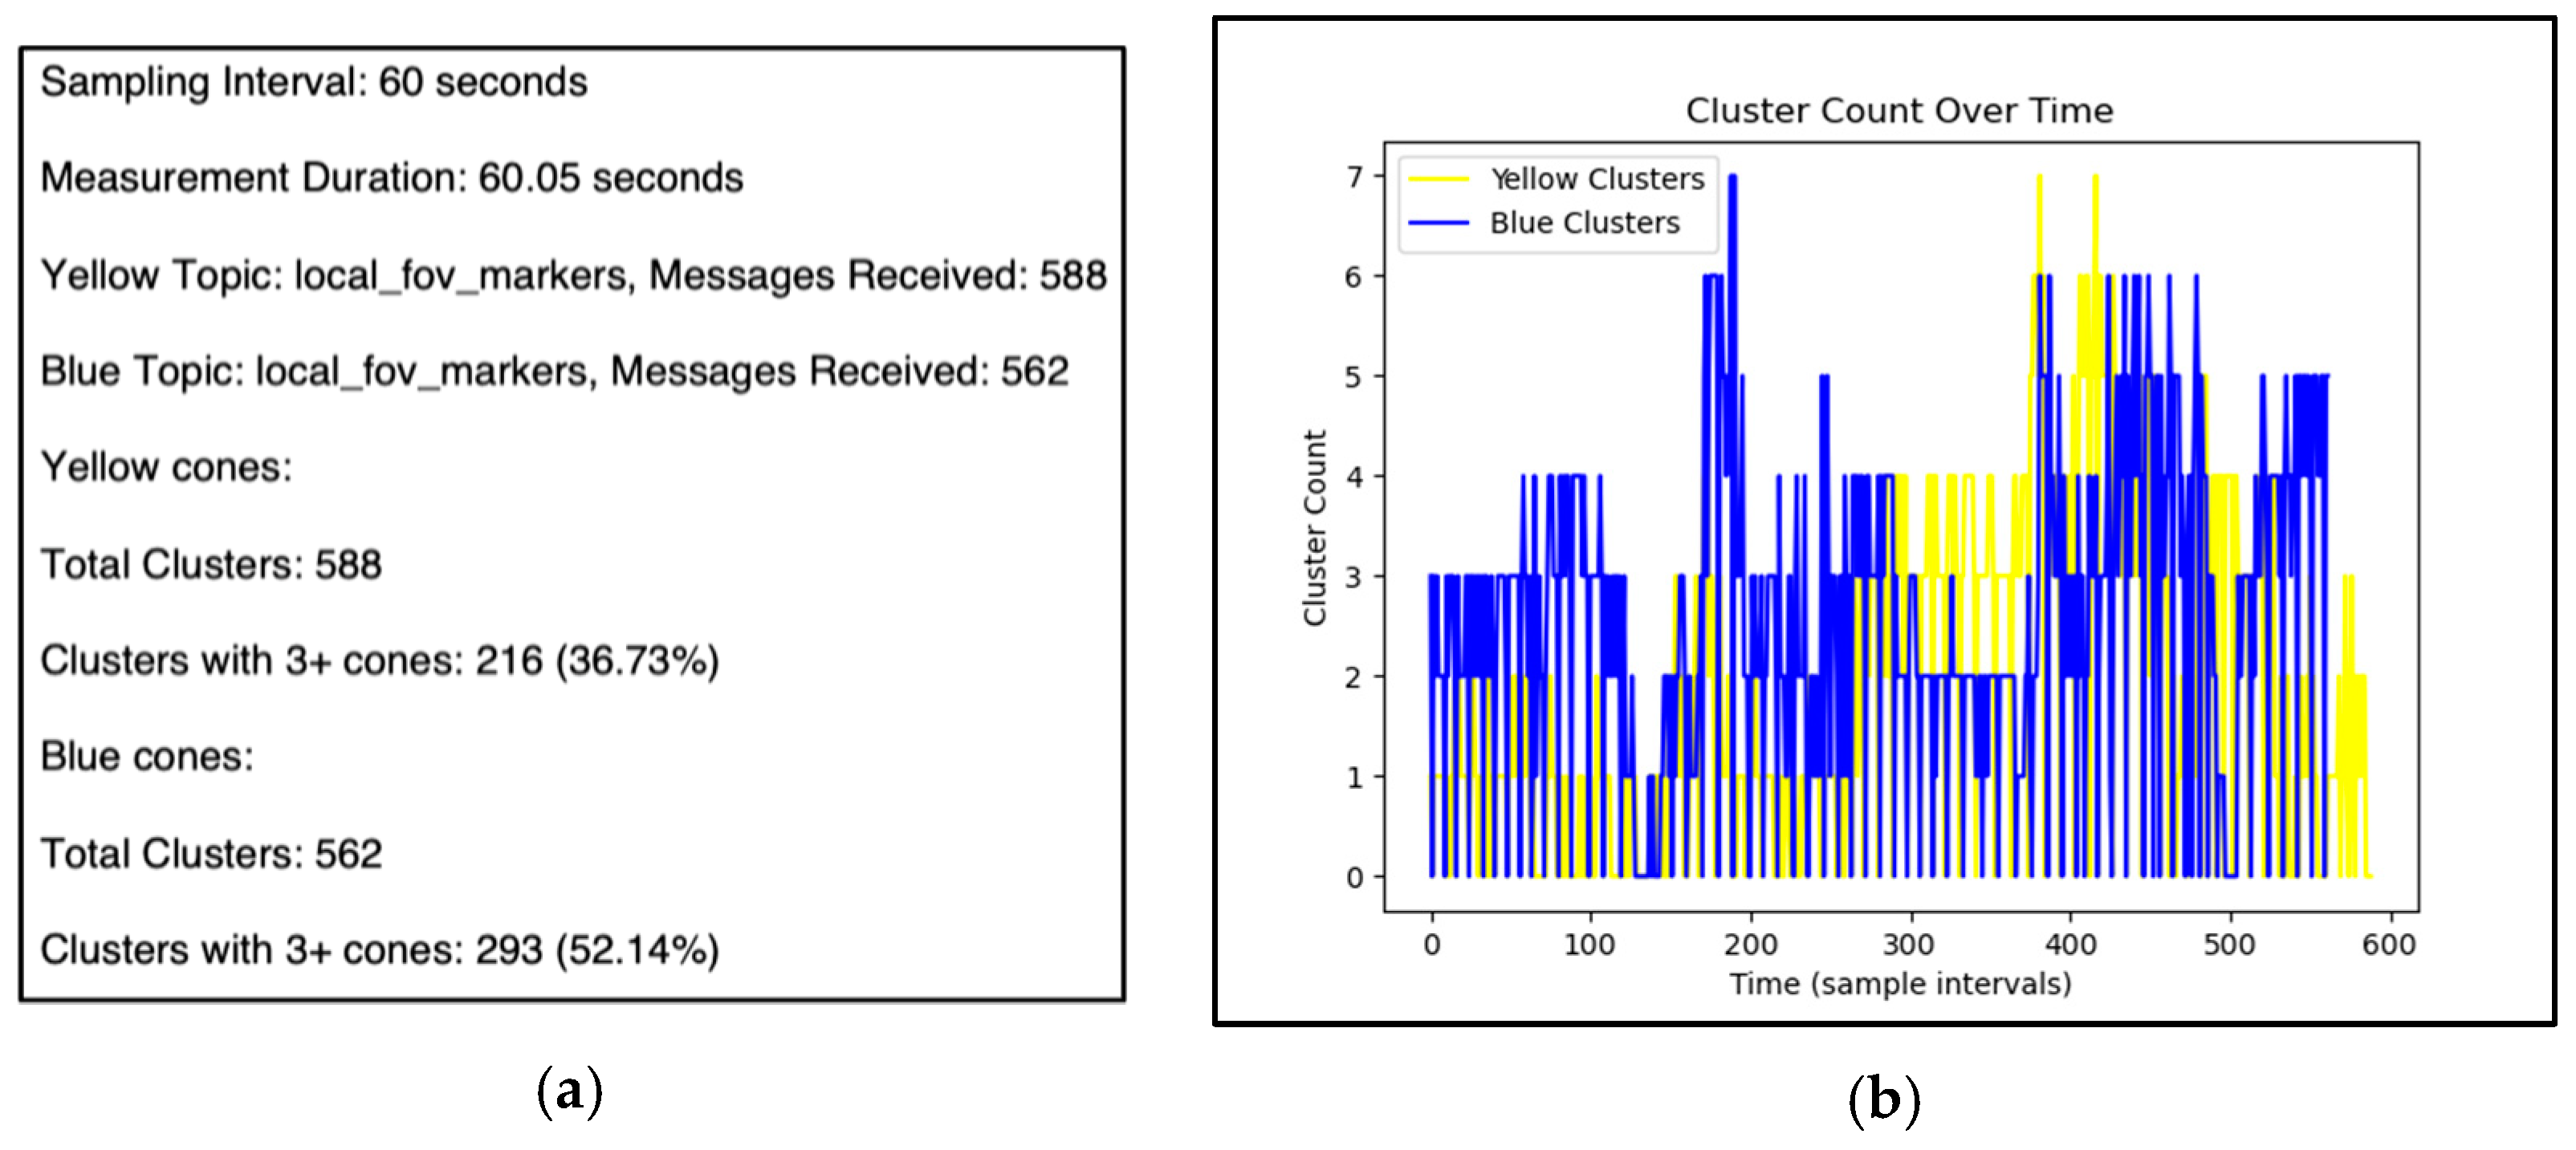
As the figures illustrate, the clustering system’s performance can be seen in how the number of clusters shifts over time and how their average cone counts change. In
Figure 3a, we have a detailed snapshot of what went on during a 60-s observation period. Throughout that window, the system recorded 588 messages tied to yellow cones, with 36.73% of these clusters including three or more cones. Meanwhile, for the blue cones of which there were 562 messages 52.14% of their clusters featured three or more cones.
Figure 3b paints a picture of how the overall cluster counts for both yellow and blue cones fluctuated as conditions evolved. This rise-and-fall pattern reflects the system’s responsiveness to changing environments. In essence, as new information came in and scenarios shifted, the total cluster count adjusted accordingly, showing just how dynamic and adaptable the detection process can be.
4. Conclusions
We have introduced a novel approach to cone clustering and path planning for autonomous Formula Student race cars in this paper. Utilizing the YOLOv8 model and ZED 2 cameras, our method employs a clustering mechanism that dynamically connects cones to form the edges of the track and marks midpoints of a drivable, safe path. This is a departure from traditional algorithms that separately store cones by color and connect them based on relevance. Our approach offers enhanced path accuracy. By connecting cones on the left and right sides within a dynamically changing distance range, our system provides a more precise representation of the track. This ensures smoother and more accurate navigation for autonomous vehicles. Implementing the system within the ROS 2 framework allows for efficient real-time data handling and visualization, essential for dynamic environments like racetracks. This enhances the vehicle’s ability to quickly adapt to changes and maintain optimal performance in path planning. The use of midpoints on central lines as markers facilitates better visualization of the path, aiding in more effective path planning and execution. This visual feedback is crucial for refining the navigation algorithms and improving the overall performance of the autonomous vehicle.
Despite its advantages, the approach does have a limitation in its dependency on precise cone detection and classification, which can be affected by environmental factors, such as lighting and cone positioning. Future work could focus on enhancing the robustness of the detection algorithms to mitigate these challenges.
Overall, this innovative approach to cone clustering and path planning offers a substantial improvement in the efficiency and accuracy of autonomous navigation systems, particularly in high-speed, dynamic environments such as Formula Student racetracks. The advancements demonstrated in this research hold significant potential for broader applications in autonomous vehicle technology.


