Proceeding Paper

Driving Strategy Optimization in Experimental Electric Vehicles: A Study on Optimization Algorithms †

Vehicle Industry Research Center, Széchenyi István University, Egyetem tér 1, 9026 Győr, Hungary
*
Author to whom correspondence should be addressed.
Presented at the Sustainable Mobility and Transportation Symposium 2024, Győr, Hungary, 14–16 October 2024.
Eng. Proc. 2024, 79(1), 42; https://doi.org/10.3390/engproc2024079042
Published: 6 November 2024
(This article belongs to the Proceedings of The Sustainable Mobility and Transportation Symposium 2024)

Abstract

:
In this paper, the driving strategy simulations for a single-seat, lightweight, energy-efficient experimental electric vehicle are introduced. The vehicle’s operation is simulated using a developed measurement-based vehicle model in the simulation environment. The optimization was performed for the UniTrack platform at the ZalaZone proving ground using the algorithms Particle Swarm Optimization (PSO) and Genetic Algorithm (GA), with different optimization settings corresponding to varying iterations and initial population/swarm sizes. A 2.95% difference was observed between the least effective and the best PSO results, where both the number of iterations and swarm size were doubled. This demonstrates the effectiveness of PSO in solving the presented driving strategy problem, even when using fewer iterations and a smaller swarm size.

1. Introduction

Energy efficiency is a commonly discussed topic in various fields, including transportation. It has a dual effect by reducing both environmental impacts and costs, making it highly beneficial in transportation. While energy efficiency is important for all vehicles, the reduction of environmental impact is often associated with electric vehicles (EVs) today. The introduction of battery-electric vehicles (BEVs) on the road has contributed to improved air quality and reduced fossil fuel consumption. However, the global environmental impact of BEVs is heavily dependent on the power mix. Utilizing renewable energy sources can significantly reduce emissions during both operation and vehicle production [1]. Transitioning to EVs has a positive long-term impact according to calculations made in [2]. The expansion of electric cars will increase electricity demand, leading to higher carbon emissions, but transport emissions will significantly drop, resulting in a 12% annual reduction in CO2 levels in the United Kingdom. Energy efficiency can be improved by using lightweight materials in vehicle manufacturing. The lightweighting strategy adopted in the automotive industry is growing due to the basic principles of the circular economy and is believed to effectively reduce the environmental impacts of modern mobility and transportation [3]. Based on these findings, the role of lightweight electric vehicles is important in the future of cleaner transportation. In this paper, a single-seat electric vehicle used for experimental research is investigated, which is built for the Shell Eco-marathon (SEM), the largest energy efficiency challenge in the world (Figure 1), where the goal is to finish the race using the least amount of fuel. Besides vehicle design aspects such as aerodynamics, suspension, powertrain, and power electronics, vehicle operation and the driving strategy applied are key to achieving ultimate energy efficiency. In this study, the same driving strategy optimization problem was solved using the Particle Swarm Optimization (PSO) algorithm and the Genetic Algorithm (GA), and their effectiveness was compared across different optimization settings. The research addresses a gap in the comparison of algorithm performance in the context of electric vehicle driving strategy optimization.

2. Vehicle Modeling and Driving Strategy Optimization

Appropriate vehicle modeling is necessary for determining the driving strategy for eco-driving. Since the energy consumption is calculated following SEM regulations, battery modeling can be neglected, and the vehicle resistance and powertrain are the sole elements to be considered from the vehicle side. A grey-box type model with a measurement basis was presented in [4], which also provided an overview of the fundamentals of applied vehicle modeling. The traction force, cumulative road resistance forces, and slope force from the track are used by the mathematical vehicle model based on longitudinal dynamics to calculate the velocity of the vehicle. The powertrain model is utilized to compute energy consumption.
Similar approaches can be found in the literature, where both GA and PSO algorithms are employed to solve the optimization problems. Optimization was carried out using GA in [5,6] to solve driving strategy problems for SEM-related experimental vehicles. The rule-based strategy was optimized by PSO for a plug-in hybrid (PHEV) electric vehicle in [7]. The driving strategy of a light-duty, high-efficiency fuel cell vehicle was carried out using PSO in [8].
The cost function of optimization is discussed in detail in [9], where the optimization vector is the torque reference value (z) to the corresponding vehicle position on the track. The torque reference is also the input of the vehicle model; this can also be deemed as the throttle position of the vehicle. The formulation of the cost function is described in Equation (1).
M inimize   Energy   Consumption   subject   to :     s max 2 0 T v ( t )   dt     s max T   T max v ( 0 ) = 0   a n d   v ( T ) 8
The vehicle needs to complete the track distance ( s max ) within a tolerance of 2 m while keeping vehicle speed ( v ) below 8 km/h. These soft boundaries prevent penalizing near-completed tries of the optimization. The track distance is segmented into parts according to track length, as described in Equation (2). The interval of 10 m was chosen for practical reasons, defined in Equation (3). The optimization vector, z, needs to be found for the corresponding s vector within the given upper and lower bounds, as formulated in Equation (4).
n = s max 10 + 1
s = s 0 , s 1 s n 1             s i = i 10           i = 0   n 1
z = z 0 , z 1 , z n 1 0 z i 39.08
During the study, the driving strategy for the UniTrack at the ZalaZone proving ground was considered as the racetrack. The track is dedicated to research and development tasks and is suitable for testing energy-efficient vehicle operations. The track is 577 m in length and needs to be completed in under 100 s to simulate SEM conditions.

3. Applied Optimization Algorithms

For this study, two widely used, population-based, iterative search algorithms were tested. The PSO and GA share common traits by using fitness evaluation of the cost function, selection mechanism, and convergence criteria. The essence of GA is based on competition among individuals and beneficial inheritance, following the principle of “survival of the fittest”. Compared to GA, PSO is based on the social behavior of particles in a search space (defined by upper and lower boundaries) and uses a collaborative strategy with a cooperative population, where members of the population work together to optimize performance. PSO involves individuals sharing their best solutions and combining the previous best results of the group to discover new, potentially better solutions [10]. In both cases, built-in MATLAB algorithms were utilized. According to the algorithms, velocity and position updates are carried out for the particles according to Equations (5) and (6), respectively [11].
v i t + 1 = ω v i t + c 1 r 1 p i x i t + c 2 r 2 g x i t
In the PSO algorithm, v i t + 1 represents the new velocity of particle i at time t + 1 . The term ω is known as the inertia weight, which controls the influence of the previous velocity on the current one. The current velocity of particle i at time t   is denoted by v i t . The cognitive and social coefficients are represented by c 1 and c 2 , respectively, indicating the degree of confidence in each particle’s best solution. The random numbers r 1 and r 2 are generated using the Mersenne Twister generator with seed 0 during optimization. The best personal position of particle i is indicated by p i , while g denotes the global best position of the entire swarm. Finally, x i t represents the current position of particle i at time t   [11,12].
x i t + 1 = x i t + v i t + 1
The position update equation indicates that the new position x i t + 1 of particle i at time t + 1 is determined by adding the new velocity, v i t + 1 , to the current position, x i t . The new velocity v i t + 1 is influenced by the previous velocity, the best-known position of its own, and the entire swarm [12]. Based on their attributes, these algorithms are well-suited for solving the driving strategy optimization problem mentioned earlier.

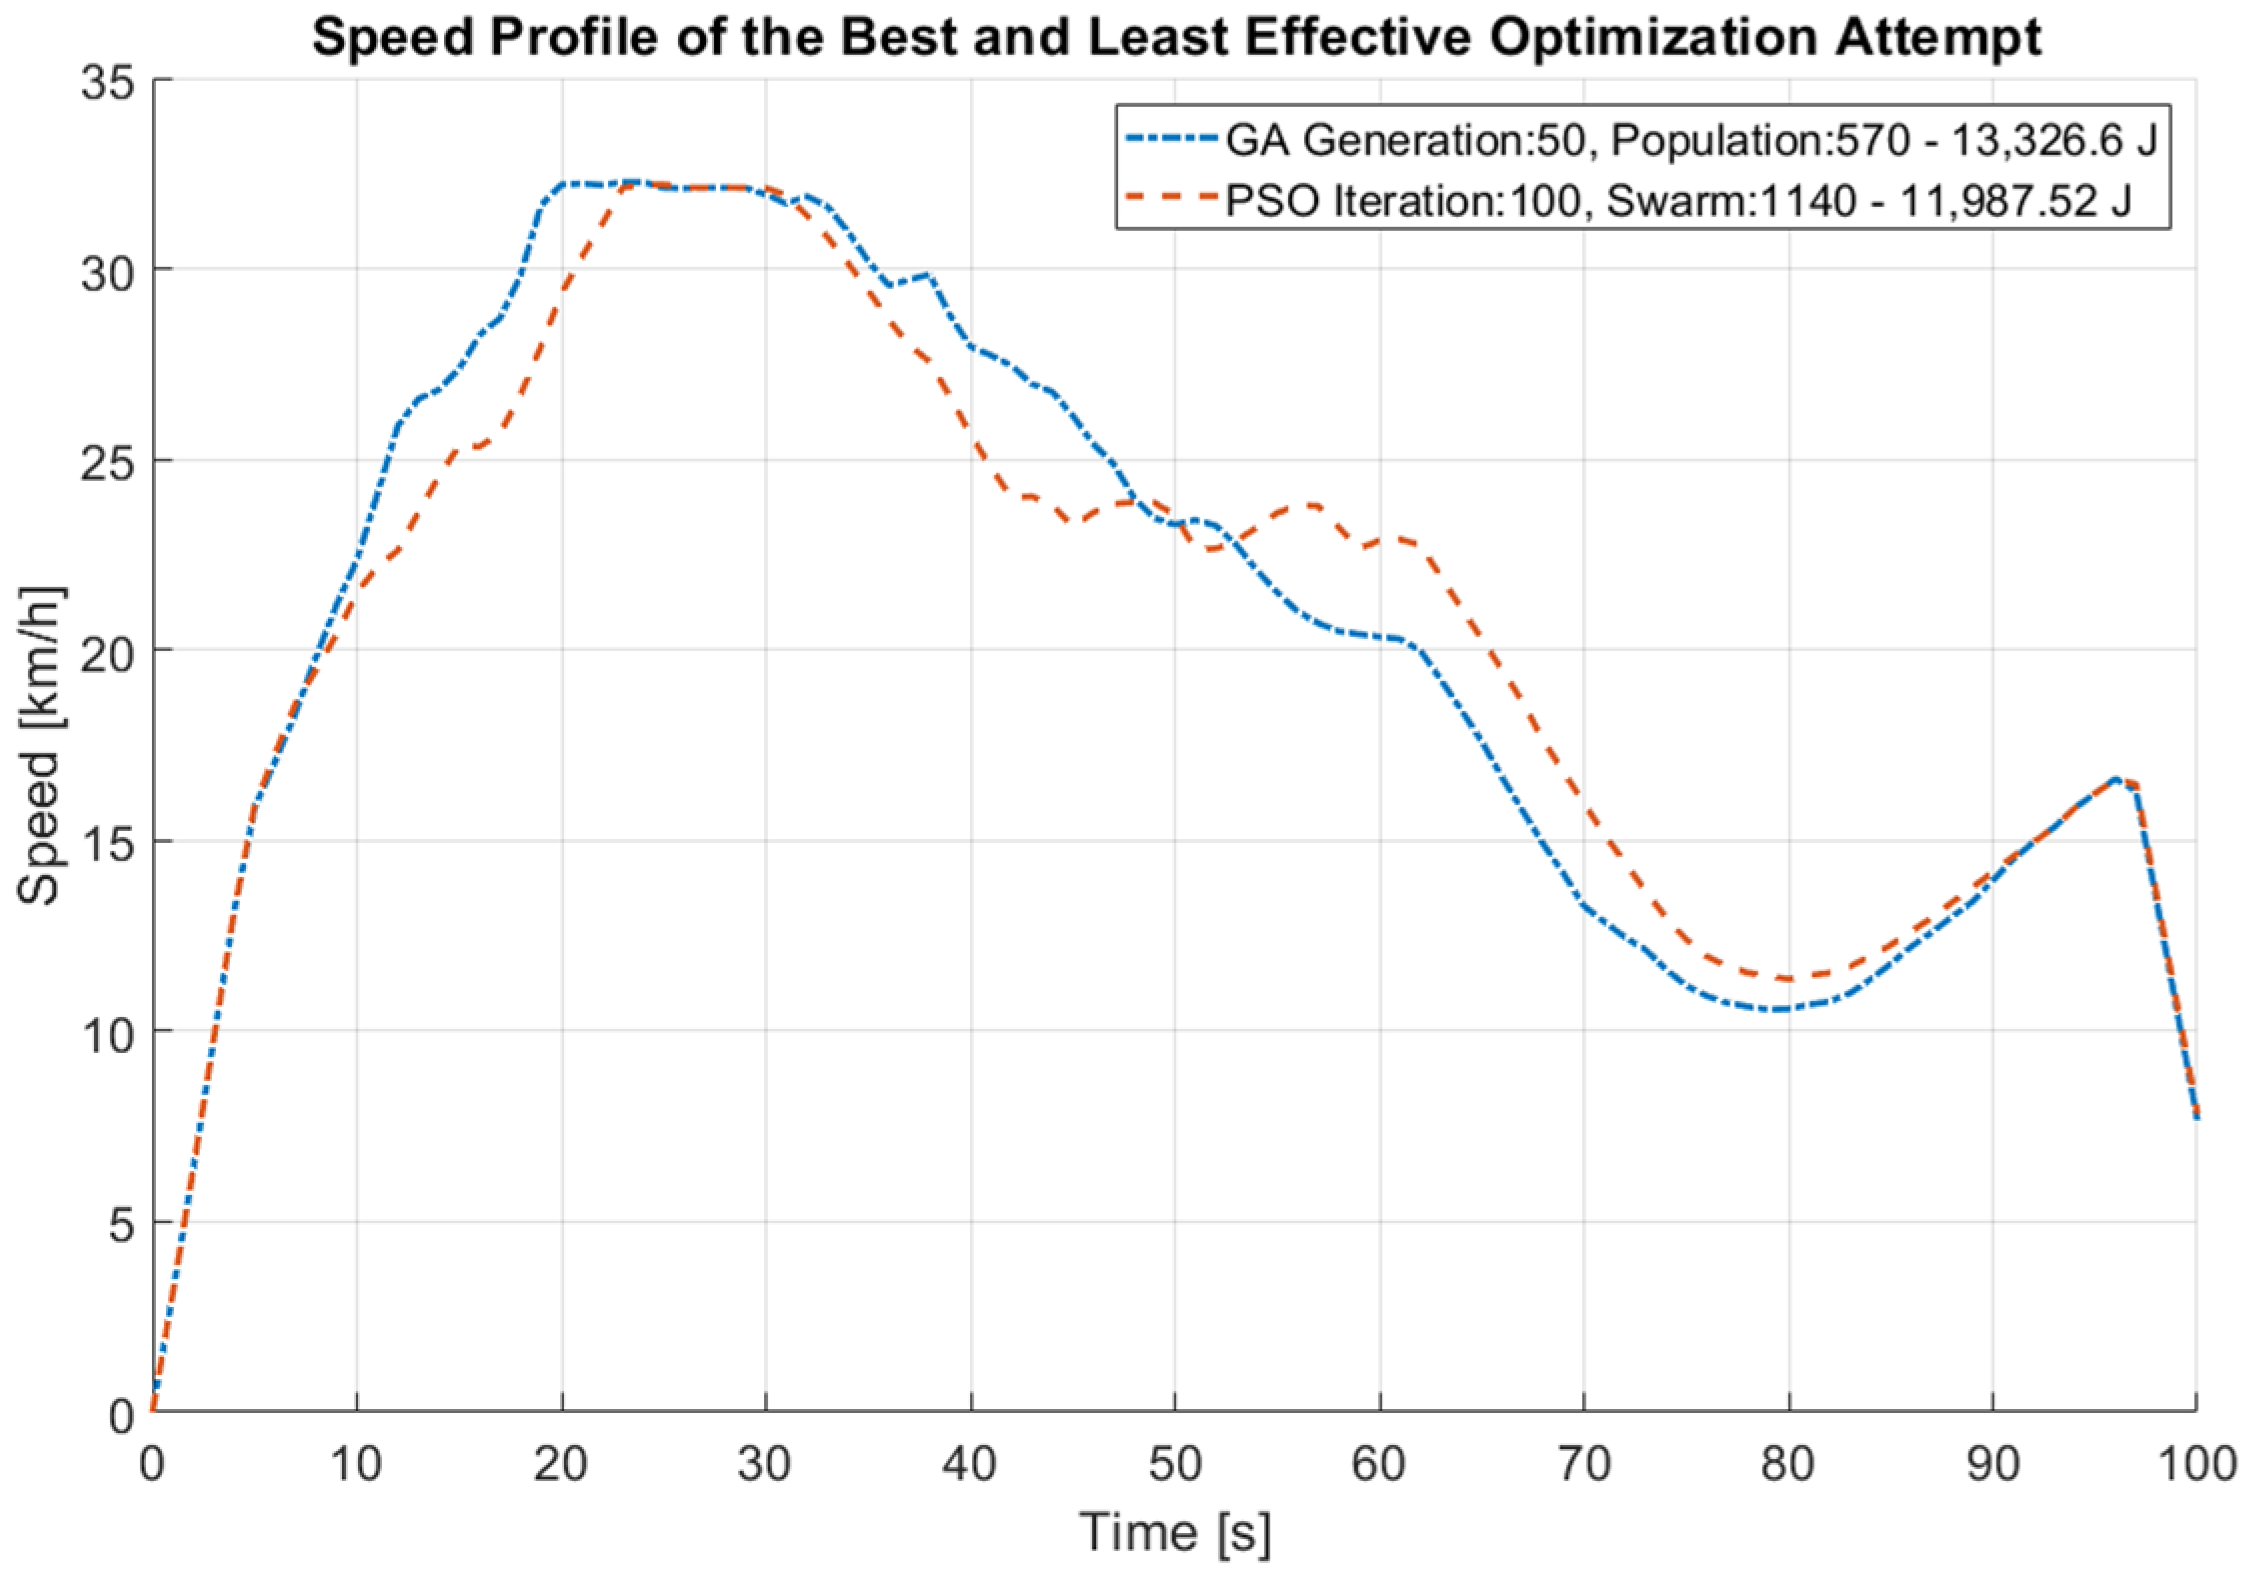
4. Optimization Results

Since the vehicle model is implemented and simulated in the simulation environment, it is practical to utilize built-in optimization algorithms, which were covered earlier, that evaluate the objective function by running the model at each iteration. The objective function for the optimization is the vehicle’s energy consumption over a full lap. The main goal of the optimization process is to minimize this objective function. In our previous works related to driving strategy optimization, GA was exclusively employed, because those studies primarily focused on the modeling and problem definition rather than the optimization solver itself. In this study, we apply the PSO algorithm to the same problem as GA, considering that the collaborative strategy of PSO may help to achieve a better result. During the evaluation, a total of eight optimization attempts were conducted. The generation or iteration limits and the number of initial populations or swarm sizes were varied. In the case of PSO, both the self-adjustment and social-adjustment coefficients were set to 1.49, while for GA, the crossover fraction was set to 0.8 and the mutation rate to 0.01.
The primary objective was to determine the significance of these optimization parameters on the optimization outcomes. In this current optimization problem, 57 optimization variables are defined, so the selected population/swarm sizes are set to ten or twenty times this value. To ensure the optimization runs within a practical time frame, the generation/iteration limits were set to 50 and 100. In Figure 2, the optimization attempts are grouped according to these parameters, showing the iteration process of PSO and GA, respectively.
The optimization metrics are collected in Table 1, where all eight attempts are shown with their respective parameter sets. The differences between the attempts and the results of the best attempt (Attempt 8) are also displayed. From the data in Table 1, it is evident that none of the GA optimization attempts achieved a better score than even the least effective PSO attempt.

5. Conclusions

In this study, the driving strategy optimization problem was defined for the UniTrack at the ZalaZone proving ground, following Shell Eco-marathon regulations. The optimization utilized a vehicle model relying on measurement-based data to evaluate the cost function, which aimed to minimize the electric energy consumption of the vehicle while completing the track. The main objective was to investigate two different optimization algorithms—Genetic Algorithm (GA) and Particle Swarm Optimization (PSO)—with varying parameter sets to understand the relevance of these parameters to the optimization results. A total of eight optimization attempts were made with different sizes of generation/iteration and population/swarm. The results demonstrate the effectiveness of PSO compared to GA in all attempts. It was found that it is sufficient for the size of the initial populations or swarms to be ten times the number of variables in both GA and PSO cases. It is noteworthy that, despite the best result requiring four times more calculation time, the difference between the least effective and best PSO results is only 2.95%, primarily due to the favorable weight coefficients. The speed profiles of the attempts, showcasing the best and least effective results, are presented in Figure 3. There is an 8.61% difference in energy consumption between these attempts with the same simulation model. To improve efficiency and decrease running times, it could be interesting to explore more specialized PSO algorithm versions in future research.

Author Contributions

Conceptualization, methodology, validation, formal analysis, and visualization, Z.P.; writing—draft preparation, Z.P.; supervision, project administration, funding acquisition, F.S. and F.F. All authors have read and agreed to the published version of the manuscript.

Funding

This project (no. TKP2021-NVA-23) was supported by the Ministry of Technology and Industry of Hungary through the National Research, Development and Innovation Fund, financed under the TKP2021-NVA funding scheme. The funders had no role in the design of the study; in the collection, analyses, or interpretation of data; in the writing of the manuscript; or in the decision to publish the results.

Institutional Review Board Statement

Not applicable.

Informed Consent Statement

Not applicable.

Data Availability Statement

Data for this study is not publicly available.

Acknowledgments

The publication was created in the framework of the Széchenyi István University’s VHFO/416/2023-EM_SZERZ project entitled ‘Preparation of digital and self-driving environmental infrastructure developments and related research to reduce carbon emissions and environmental impact’ (Green Traffic Cloud). Members of the SZEnergy Team (https://szenergy.hu/) provided internal telemetry data, images, and support during the field test, which the authors gratefully acknowledge.

Conflicts of Interest

The authors declare no conflicts of interest.

References

  1. Das, P.K.; Bhat, M.Y.; Sajith, S. Life Cycle Assessment of Electric Vehicles: A Systematic Review of Literature. Environ. Sci. Pollut. Res. 2024, 31, 73–89. [Google Scholar] [CrossRef]
  2. Milev, G.; Al-Habaibeh, A.; Shin, D. Impact of Replacing Conventional Cars with Electric Vehicles on UK Electricity Grid and Carbon Emissions. In Energy and Sustainable Futures, Proceedings of the 2nd International Conference on Energy and Sustainable Futures (ICESF 2020), Hatfield, UK, 10–11 September 2020; Mporas, I., Kourtessis, P., Al-Habaibeh, A., Asthana, A., Vukovic, V., Senior, J., Eds.; Springer International Publishing: Cham, Switzerland, 2021; pp. 199–206. [Google Scholar] [CrossRef]
  3. Czerwinski, F. Current Trends in Automotive Lightweighting Strategies and Materials. Materials 2021, 14, 6631. [Google Scholar] [CrossRef] [PubMed]
  4. Pusztai, Z.; Kőrös, P.; Friedler, F. Vehicle Model for Driving Strategy Optimization of Energy Efficient Lightweight Vehicle. Chem. Eng. Trans. 2021, 88, 385–390. [Google Scholar] [CrossRef]
  5. Sawulski, J.; Ławryńczuk, M. Optimization of Control Strategy for a Low Fuel Consumption Vehicle Engine. Inf. Sci. 2019, 493, 192–216. [Google Scholar] [CrossRef]
  6. Stabile, P.; Ballo, F.; Previati, G.; Mastinu, G.; Gobbi, M. Eco-Driving Strategy Implementation for Ultra-Efficient Lightweight Electric Vehicles in Realistic Driving Scenarios. Energies 2023, 16, 1394. [Google Scholar] [CrossRef]
  7. Chen, Z.; Xiong, R.; Wang, K.; Jiao, B. Optimal Energy Management Strategy of a Plug-in Hybrid Electric Vehicle Based on a Particle Swarm Optimization Algorithm. Energies 2015, 8, 3661–3678. [Google Scholar] [CrossRef]
  8. Olivier, J.C.; Wasselynck, G.; Chevalier, S.; Auvity, B.; Josset, C.; Trichet, D.; Squadrito, G.; Bernard, N. Multiphysics Modeling and Optimization of the Driving Strategy of a Light Duty Fuel Cell Vehicle. Int. J. Hydrogen Energy 2017, 42, 26943–26955. [Google Scholar] [CrossRef]
  9. Pusztai, Z.; Kőrös, P.; Szauter, F.; Friedler, F. Vehicle Model-Based Driving Strategy Optimization for Lightweight Vehicle. Energies 2022, 15, 3631. [Google Scholar] [CrossRef]
  10. Banks, A.; Vincent, J.; Anyakoha, C. A Review of Particle Swarm Optimization. Part I: Background and Development. Nat. Comput. 2007, 6, 467–484. [Google Scholar] [CrossRef]
  11. Palangpour, P.; Mitra, P.; Ray, S.; Venayagamoorthy, G.K. DSP-Based PSO Implementation for Online Optimization of Power System Stabilizers. In Proceedings of the Proceedings of the 2008 NASA/ESA Conference on Adaptive Hardware and Systems, Noordwijk, The Netherlands, 22–25 June 2008; IEEE: New York, NY, USA, 2008; pp. 379–384. [Google Scholar] [CrossRef]
  12. Perez, R.E.; Behdinan, K.; Perez, R.E.; Behdinan, K. Particle Swarm Optimization in Structural Design. In Swarm Intelligence, Focus on Ant and Particle Swarm Optimization; IntechOpen: London, UK, 2007; ISBN 978-3-902613-09-7.1. [Google Scholar]
Figure 1. SZEmission, the energy-efficient Urban Concept (UC) vehicle dedicated to the Shell Eco-marathon.
Engproc 79 00042 g001
Figure 2. Optimization results, Particle Swarm Optimization (PSO) algorithm marked with blue, Genetic Algorithm (GA) marked with red: (a) Swarm/Population size of 570 with the Iteration/Generation limit of 50; (b) Swarm/Population size of 570 with the Iteration/Generation limit of 100; (c) Swarm/Population size of 1140 with the Iteration/Generation limit of 50; (d) Swarm/Population size of 1140 with the Iteration/Generation limit of 100.
Engproc 79 00042 g002
Figure 3. Speed profile of the best and least effective optimization attempt; Attempt 1—13.326.6 J; Attempt 8—12.179.32 J energy consumption.
Engproc 79 00042 g003
Table 1. Comparison of optimization attempts.
MetricsAttempt 1Attempt 2Attempt 3Attempt 4Attempt 5Attempt 6Attempt 7Attempt 8
AlgorithmGAGAGAGAPSOPSOPSOPSO
Generation/Iteration50501001005050100100
Population/Swarm5701140570114057011405701140
Best Score [J]13,326.6013,332.3213,133.8813,050.4212,549.6012,375.2912,355.9512,179.32
Difference8.61%8.65%7.27%6.67%2.95%1.58%1.43%-
Disclaimer/Publisher’s Note: The statements, opinions and data contained in all publications are solely those of the individual author(s) and contributor(s) and not of MDPI and/or the editor(s). MDPI and/or the editor(s) disclaim responsibility for any injury to people or property resulting from any ideas, methods, instructions or products referred to in the content.

