Abstract
The Automated Driving Data Analyzer (ADDA) is a modular application written in Python for the synchronized acquisition and analysis of physiological, vehicle, and interface data. It provides a managed data acquisition process and one-click data analysis. It also provides raw data storage and systematic archiving of data sets. ADDA integrates real-time data from a BeamNG vehicle simulation, Pupil Labs eye-tracking system, hand-tracking, and cardiac data. This integration allows the simultaneous recording and analysis of multiple data streams, which can be visualized and controlled through a graphical user interface (GUI) built with Tkinter. The application is designed to help researchers and engineers analyze driving behavior under different conditions, enabling a deeper understanding of the interactions between the driver and automated driving functions.
1. Introduction
The introduction of cooperative systems of automated driving calls for a comprehensive and real-time analysis of drivers’ behavior, driving vehicles’ behavior, and interactions with the environment. The ADDA system controls the data acquisition and synchronization of a given system, allowing the storage of raw data sets while systematically archiving them through managed data collection and integrated analysis. It uses solutions that align with techniques applied in modern studies and research.
Young et al. discuss the issue of non-technological and technological driver distraction in the literature in detail [1]. According to the report, mobile phones are followed by in-car navigation and entertainment systems as the main sources of distraction. The authors also outline the different techniques used to assess the impact of distraction on driving ability, including on-road studies, driving simulators, and even eye-tracking methods. Effective mitigation of driver distraction has been greatly challenged as it is a leading cause of traffic accidents or collisions [2]. The prevalence of driver distraction has driven the advent of visual-based monitoring systems. Such systems typically utilize one or more cameras and image processing algorithms to identify visual distractions. This is achieved by observing the driver’s facial expressions, gaze, and head orientation. Implementing these systems in vehicles presents some significant challenges, including the assurance of reliability, the integration of real-time algorithms, and the maintenance of cost-effectiveness.
Physiological-based Driver Monitoring Systems (DMS) use sensors that are used in the collection of various physiological signs, such as electroencephalography (EEG), electrooculography (EOG), electrocardiography (ECG), and electromyography (EMG). These systems are more reliable than traditional behavior-based methods in detecting indications of driver fatigue, drowsiness, and lack of alertness [3]. Based on these physiological signs, DMS can issue timely alerts to avoid the occurrence of an accident. Driver distraction detection has emerged as a crucial problem that requires the application of machine learning (ML) to analyze various data sources, including visual, physiological, and environmental features [4]. This comprehensive approach enhances detection accuracy compared to single-modality systems.
Driver distraction detection strategies are classified into visual, cognitive, and biomechanical models [5]. Visual techniques monitor the driver’s face and eye movements, cognitive methods assess brain activity, and biomechanical techniques analyze the driver’s movements and posture. One of the papers presents a concept for improving distraction identification methods, underlining the necessity of using multiple sensors and real-time data analysis [6]. It is intended to increase the precision of detection and the system’s stability by combining the advantages of all methods. This also points to the fact that there is a need for thorough testing and the validation of such systems in real environments to check their feasibility and operational effectiveness. Another review is dedicated to assessing the driver’s mental workload (MWL) regarding conditionally automated driving [7]. Heart rate variability, respiratory rate, and skin conductance are considered the most efficient indicators of MWL.
The present study presents a flexible, lightweight system that combines data from simulation software, eye-trackers, video-tracking devices, and heart rate monitors. Integrating these sensors into automotive research could enhance driver safety and efficiency.
2. System Methodology
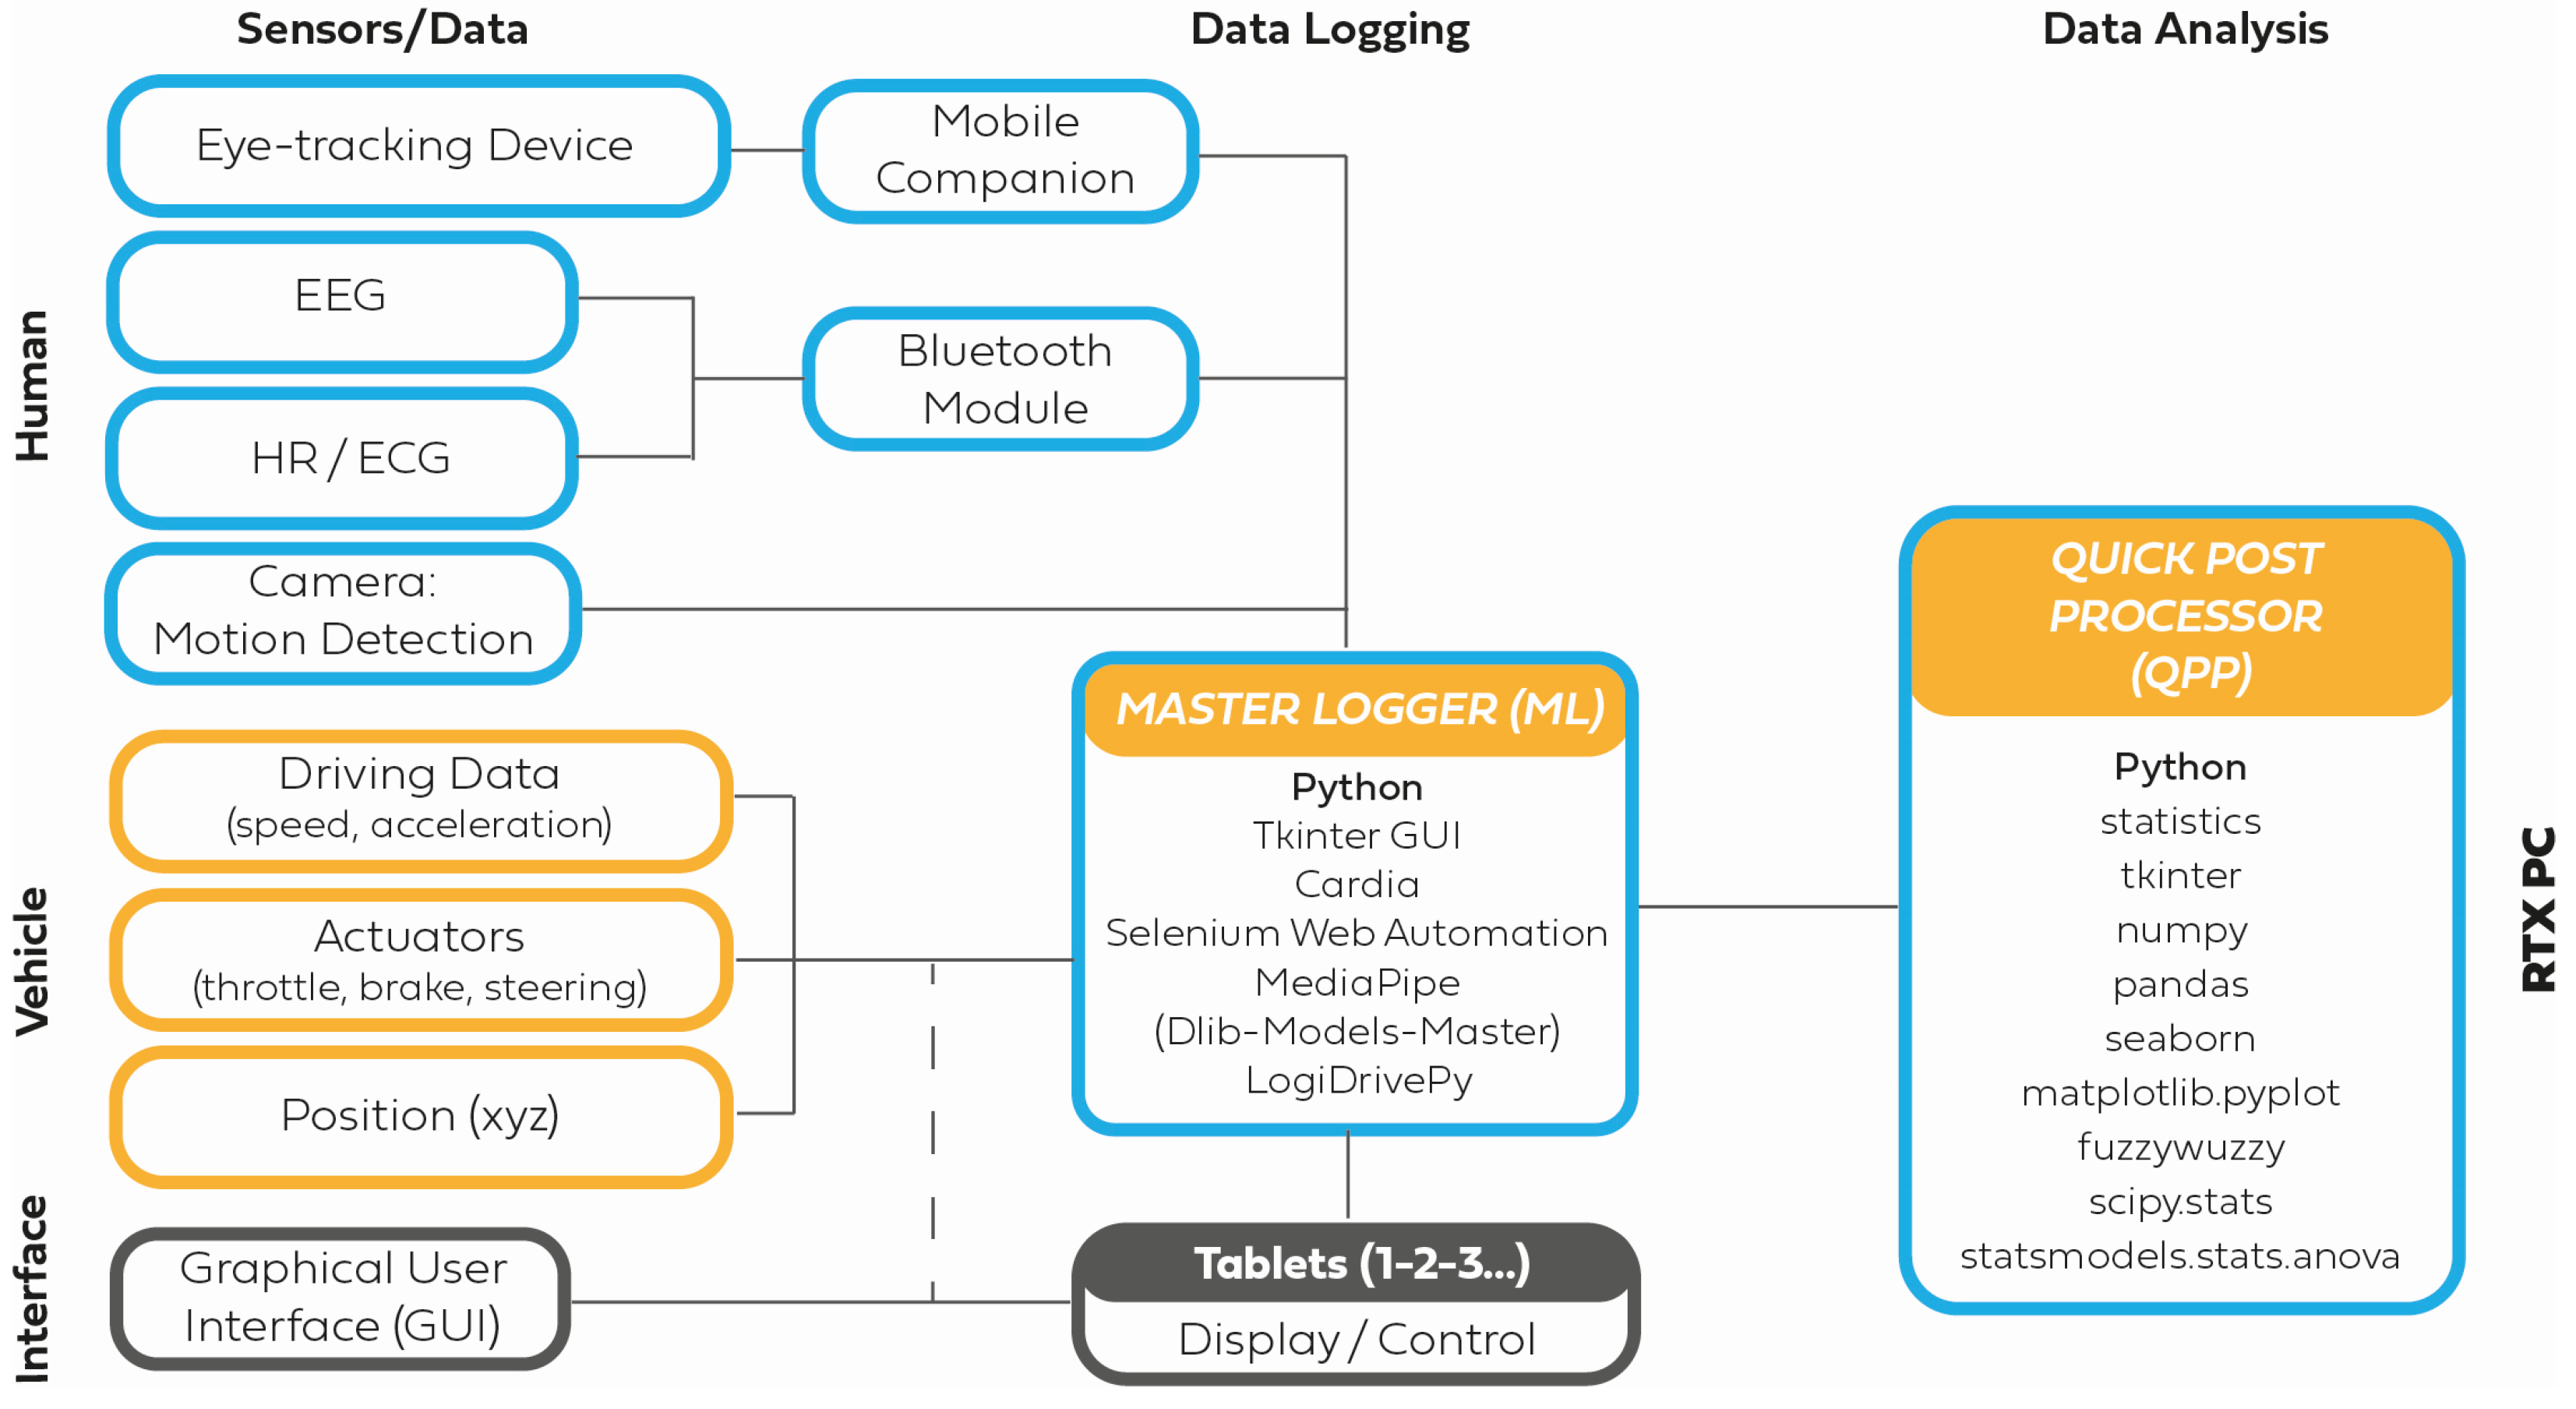
The ADDA system represents a significant advancement in research methodology, offering a framework for controlled data collection and synchronization from the outset. It guarantees the secure storage of raw data and the systematic archiving of datasets through a managed data acquisition process and seamless one-click data analysis. ADDA has been designed with the needs of researchers in mind. Its intuitive graphical user interface (GUI) makes it simple to use, facilitating more accessible and efficient advanced research processes. The architectural design is illustrated in Figure 1.
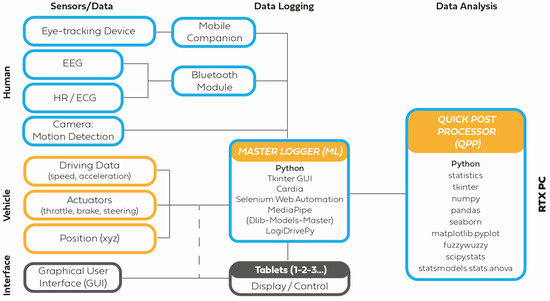
Figure 1.
ADDA system architecture.
2.1. Hardware
The ADDA system uses hardware to effectively capture, analyze, and record driving behavior. The key components are as follows.
- BeamNG Tech: A vehicle driving simulator that generates detailed dynamics data such as speed, acceleration, and steering angle, crucial for understanding vehicular responses under various conditions.
- Pupil Labs Neon Eye-Tracking System: Monitors drivers’ gaze to assess attention, focus, situational awareness, and reaction times.
- Polar H9 Heart Rate Monitor (HRM): Records physiological responses, providing insights into stress and arousal levels during driving scenarios.
- Logitech G29 Driving Force Racing Wheel and Pedals: Dual-motor force feedback offers realistic control and feedback, critical for evaluating driver handling skills and adaptability.
- Intel RealSense D435i Depth Sensor Camera: This camera captures 3D spatial data for precise hand movement tracking, which is important for interpreting human-computer interactions.
- RTX PC: This type of PC utilizes NVIDIA’s RTX graphics card for high-resolution rendering and real-time ray tracing, enhancing simulation realism and aiding in visual processing analysis.
2.2. Software Architecture
The software architecture of ADDA is designed to be modular and flexible, facilitating easy integration and scalability. The key components are as follows.
- Python: Serves as the core programming language, offering flexibility and extensive library support for complex data integration and analysis.
- Tkinter GUI: Provides a user-friendly interface for real-time data visualization, control, and access to analysis tools, allowing researchers to focus on data interpretation.
- Selenium: Automates web interactions to seamlessly integrate web-driven data collection processes.
- Cardia Windows Module: This module interfaces with the Polar H9 HRM to provide real-time heart rate data, which is essential for assessing driver stress and arousal levels.
- MediaPipe: Utilizes advanced hand-tracking technology to detect and analyze driver hand movements, critical for studying interactions with vehicle controls. Optional Dlib-Models-Master which enhances facial recognition and eye-tracking capabilities using neural network models.
- LogiDrivePy: Simulates realistic driving forces when the AI drives, crucial for studying driver reactions to automated control.
- Data Synchronization and Logging: Uses Python’s threading and socket programming to capture and synchronize data streams from multiple sources in real time, ensuring temporal alignment for accurate analysis.
- Real-Time Data Processing: Processes data on the fly with algorithms for noise reduction, data smoothing, and feature extraction, enabling immediate feedback and adaptive testing.
- Data Storage and Archiving: Ensures secure and systematic storage of all collected data for efficient retrieval and long-term management.
2.3. Data Collection
The data collection process in ADDA is carefully designed to ensure accuracy, consistency, and completeness. ADDA uses advanced threading and networking techniques to align data from various sources including HRM, MediaPipe, Pupil Labs, and BeamNG drive in real-time. Each data item is timestamped to the millisecond (up to 3 decimals), and techniques for managing buffers prevent data loss or time drift, ensuring the accuracy of high-frequency data collection. ADDA uses special formats and protocols to log data from heart rate, eye-tracking, hand-tracking, and vehicle dynamics modules into a central database, ensuring consistency. ADDA also uses systematic archiving practices to maintain data integrity and security. Integrated error detection and correction procedures identify and address irregularities in the data.
To facilitate real-time data acquisition, the Tkinter library continuously updates real-time data feeds. This provides a visual representation for operators to observe the data logging process instead of executing in hidden mode. Its interface includes data flow, and system status indicators give direct feedback, as well as control. The main method of recording can be started/stopped in various ways (GUI controls, hotkeys, or automated triggers based on customizable conditions driven by responses to simulations). In addition, ADDA adapts data collection parameters on the fly for some suites, either by recording at a lower rate or selectively triggering specific streams during critical events, depending upon the test being conducted.
3. Results
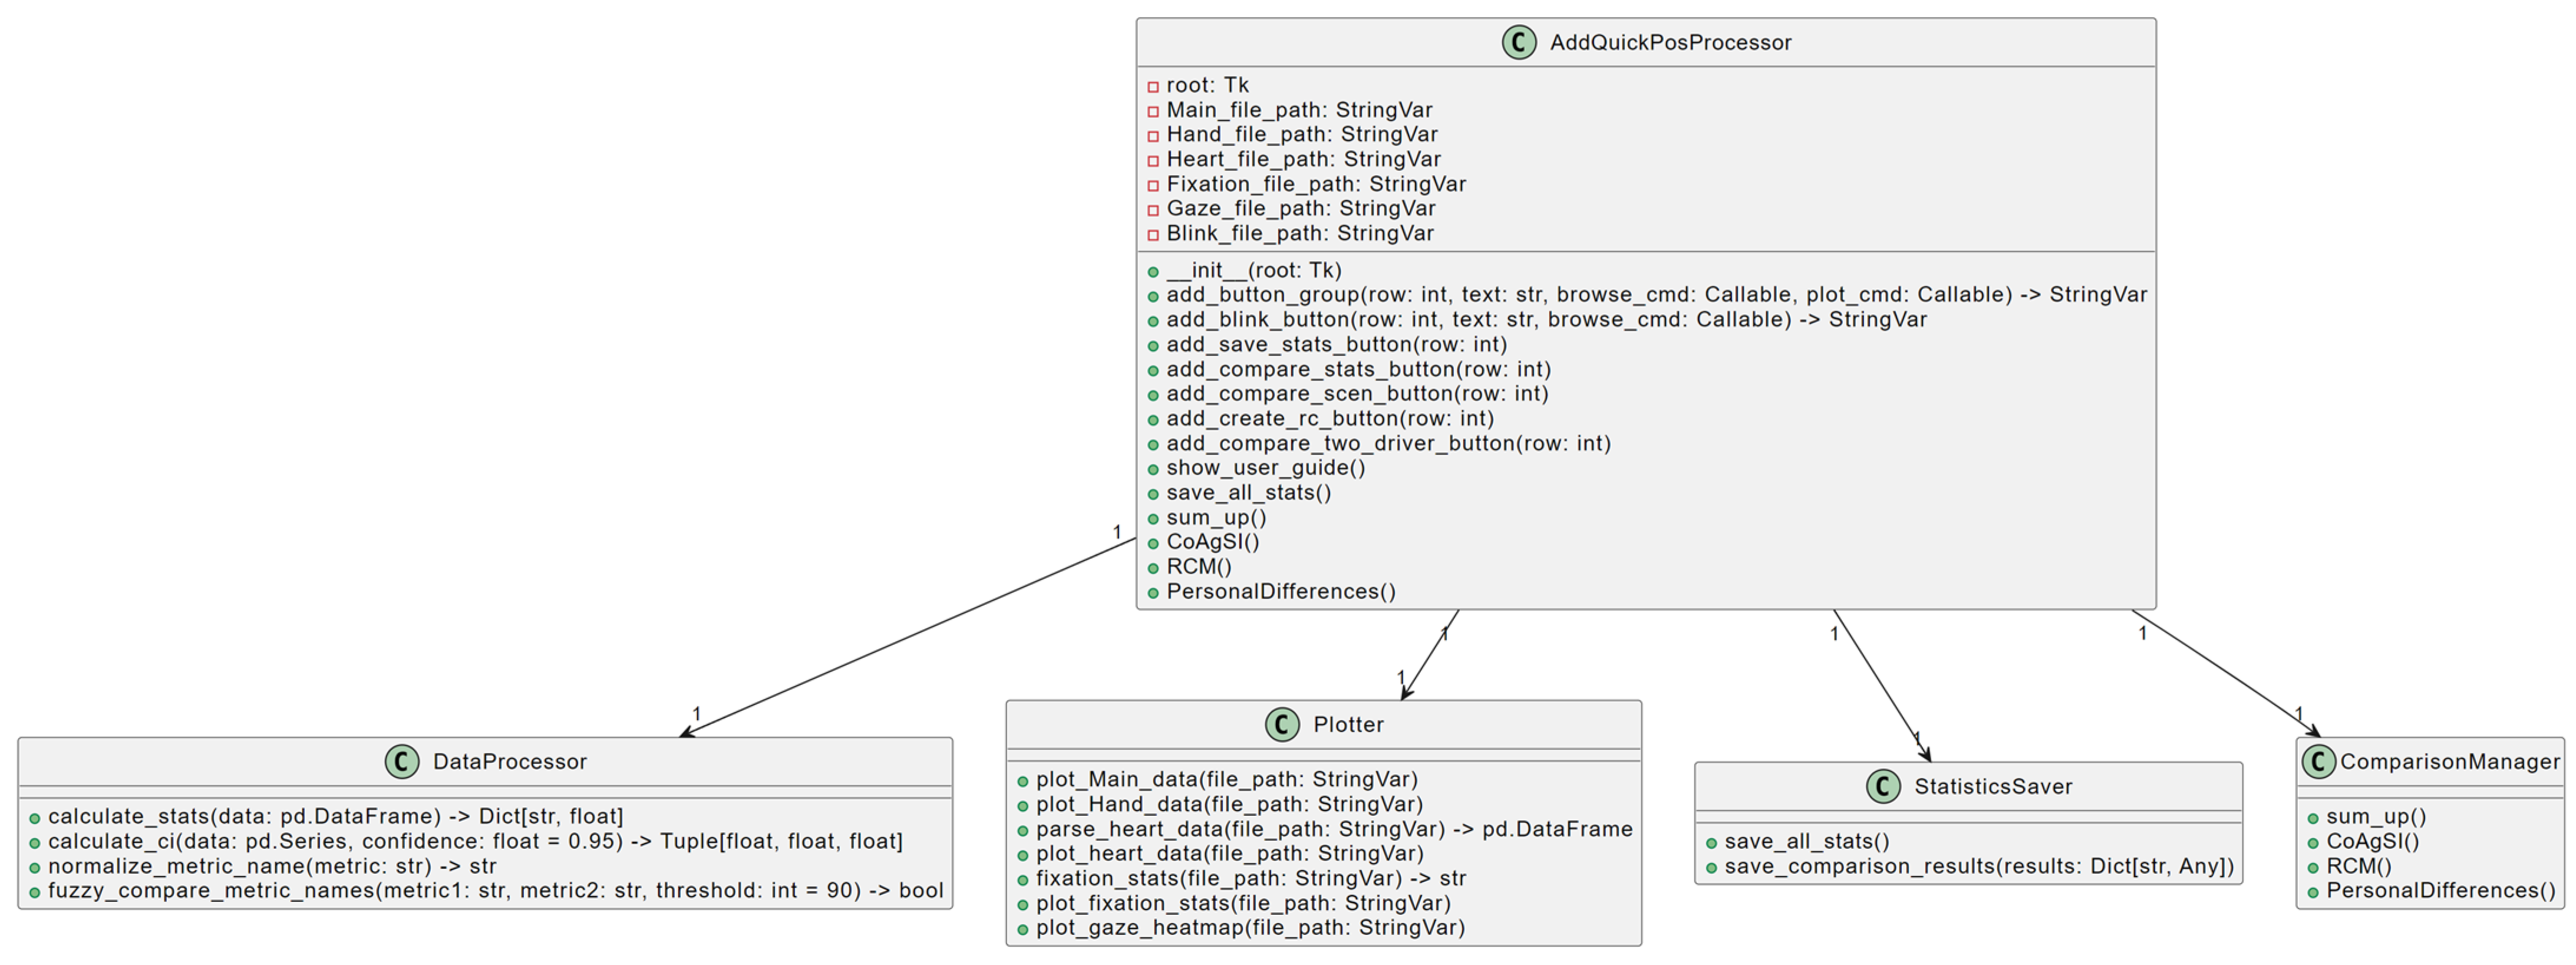
Figure 2 depicts a class structure for a software application focusing on data processing, plotting, statistics saving, and comparison management. At the center is the AddQuickPostProcessor class, which manages file paths for various data types, initializes the root Tkinter window, and contains methods for adding buttons, comparing statistics, creating plots, and displaying user guides.
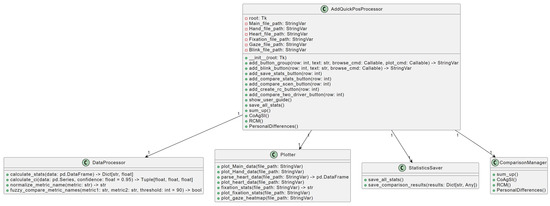
Figure 2.
A simplified class diagram for ADDA QPP.
This class directly interacts with four other classes:
- DataProcessor: Responsible for calculating statistics from data, handling confidence intervals, normalization, and performing fuzzy comparisons of metric names.
- Plotter: Focuses on plotting various types of data, including main, hand, heart, fixation, and gaze, and parses heatmap data files.
- StatisticsSaver: Manages the saving of all statistics and stores comparison results.
- ComparisonManager: Summarizes data and manages comparison results and personal differences.
- AddQuickPostProcessor: calls upon the functionalities of the classes to process data, plot results, save statistics, and manage comparisons, creating an integrated system for comprehensive data analysis and visualization.
3.1. Statistical Analysis
The ADDA system application includes robust statistical analysis capabilities for detailed examination of collected data, which we believe will ensure mathematical rigor and precision. The application can calculate several key metrics, including the mean, median, standard deviation, and confidence intervals. This allows us to better understand the central tendencies and variability in driver behavior and physiological responses.
The statistical analysis (e.g., Pearson Correlation, ANOVA) allows researchers to identify patterns and trends in driving conditions affecting driver behavior and physiological responses. It allows for evaluating scenario effects on performance and determining the impact of automated driving, human driving, or the transition phase if semi-autonomous systems are tested. Additionally, it facilitates the comparison of drivers, assessing individual differences in responses and identifying factors that contribute to safer and more efficient driving behaviors.
3.2. Graphical Visualization
The ADDA system application includes advanced graphical visualization capabilities, which are crucial for analyzing and interpreting collected data. These tools provide clear insights into drivers’ behavior and physiological responses.
The radar chart allows users to visualize multiple performance indicators simultaneously, thus facilitating the comparison of different drivers or scenarios. This is achieved by showing how various metrics interact and vary across conditions. The percentage-based driver comparison tool calculates and visualizes percentage differences between drivers’ performances, essential for evaluating adaptation to automated driving systems and handling various driving conditions. Heatmaps display drivers’ pupil movements, essential for analyzing visual attention and focus during driving tasks. They provide spatial representations of where drivers are looking, which helps to assess situational awareness and detect distractions.
4. Discussions
The ADDA system excels in integrating diverse data sources—such as vehicle dynamics, eye-tracking, hand-tracking, and physiological data—into a cohesive framework, employing unified data handling and advanced fusion techniques for real-time analysis and feedback. Its modular design enhances scalability, customization, maintenance, and collaborative development, allowing for independent upgrades and targeted experimentation, supporting comprehensive and flexible research on driver behavior.
ADDA enables researchers to:
- Identify patterns and trends: Recognize how driving conditions affect driver behavior and physiological responses.
- Evaluate scenario effects: Determine the impact of semi-autonomous and autonomous driving compared to manual driving.
- Compare drivers: Assess individual differences in responses, attention, and distractions and identify factors contributing to safer and more efficient driving behaviors.
- Graphical visualization: Converting complex data into intuitive visuals, which helps quickly identify patterns and anomalies, enhances understanding of metric relationships under different driving conditions, and effectively communicates findings to both technical and non-technical audiences.
5. Conclusions
In conclusion, the ADDA system is distinguished from other state-of-the-art solutions by its integrated tools, advanced and customizable visualizations, real-time processing capabilities, and comprehensive scenario analysis.
Scientific Justification: The ADDA system enables precise and synchronized data collection across multiple sources, including physiological, visual, and vehicular metrics. This allows for detailed analysis of driver behavior and human-vehicle interactions, providing previously difficult insights to obtain with isolated systems.
Technological Justification: By integrating diverse data streams such as eye-tracking, heart rate monitoring, and vehicle simulation metrics into a unified platform, ADDA offers a cutting-edge solution. This supports real-time feedback and immediate data analysis, ensuring high-quality and timely results for the users.
Social Justification: The system’s ability to detect and mitigate driver distractions and optimize behavior could contribute to significant improvements in road safety. By enhancing driver attention, reducing fatigue, and improving response times, ADDA has the potential to lower accident rates and promote safer driving environments, benefiting both individual drivers and public transportation.
The ADDA system should improve data processing and analysis to make it more user-friendly for driver behavior assessments and other measurement systems dealing with human factors and physiological sensors. This will allow for more precise and versatile analyses across various fields involving human interaction and response.
Author Contributions
Conceptualization, Á.P.S. and V.N.; methodology, Á.P.S.; software, Á.P.S.; validation, Á.P.S. and V.N.; formal analysis, Á.P.S. and V.N.; investigation, Á.P.S. and V.N.; resources, Á.P.S.; data curation, V.N.; writing—original draft preparation, Á.P.S. and V.N.; writing—review and editing, Á.P.S. and V.N.; visualization, Á.P.S.; supervision, V.N.; project administration, V.N.; funding acquisition, V.N. All authors have read and agreed to the published version of the manuscript.
Funding
This research received no external funding.
Institutional Review Board Statement
Not applicable.
Informed Consent Statement
Not applicable.
Data Availability Statement
Data are contained within the article.
Acknowledgments
The research was supported by the European Union within the framework of the National Laboratory for Artificial Intelligence. (RRF-2.3.1-21-2022-00004).
Conflicts of Interest
The authors declare no conflicts of interest.
References
- Young, K.L.; Regan, M.A.; Hammer, M.; Monash University; Accident Research Centre; General Motors-Holden’s Limited. Driver Distraction: A Review of the Literature; Monash University Accident Research Centre: Clayton, Australia, 2003; ISBN 0732617154. [Google Scholar]
- Fernández, A.; Usamentiaga, R.; Carús, J.L.; Casado, R. Driver Distraction Using Visual-Based Sensors and Algorithms. Sensors 2016, 16, 1805. [Google Scholar] [CrossRef]
- Razak, S.F.A.; Yogarayan, S.; Aziz, A.A.; Abdullah, M.F.A.; Kamis, N.H. Physiological-Based Driver Monitoring Systems: A Scoping Review. Civ. Eng. J. 2022, 8, 3952–3967. [Google Scholar] [CrossRef]
- Koay, H.V.; Chuah, J.H.; Chow, C.O.; Chang, Y.L. Detecting and Recognizing Driver Distraction through Various Data Modality Using Machine Learning: A Review, Recent Advances, Simplified Framework and Open Challenges (2014–2021). Eng. Appl. Artif. Intell. 2022, 115, 105309. [Google Scholar] [CrossRef]
- Kashevnik, A.; Shchedrin, R.; Kaiser, C.; Stocker, A. Driver Distraction Detection Methods: A Literature Review and Framework. IEEE Access 2021, 9, 60063–60076. [Google Scholar] [CrossRef]
- Mou, L.; Chang, J.; Zhou, C.; Zhao, Y.; Ma, N.; Yin, B.; Jain, R.; Gao, W. Multimodal Driver Distraction Detection Using Dual-Channel Network of CNN and Transformer. Expert Syst. Appl. 2023, 234, 121066. [Google Scholar] [CrossRef]
- Sriranga, A.K.; Lu, Q.; Birrell, S. A Systematic Review of In-Vehicle Physiological Indices and Sensor Technology for Driver Mental Workload Monitoring. Sensors 2023, 23, 2214. [Google Scholar] [CrossRef] [PubMed]
Disclaimer/Publisher’s Note: The statements, opinions and data contained in all publications are solely those of the individual author(s) and contributor(s) and not of MDPI and/or the editor(s). MDPI and/or the editor(s) disclaim responsibility for any injury to people or property resulting from any ideas, methods, instructions or products referred to in the content. |
© 2024 by the authors. Licensee MDPI, Basel, Switzerland. This article is an open access article distributed under the terms and conditions of the Creative Commons Attribution (CC BY) license (https://creativecommons.org/licenses/by/4.0/).