Proceeding Paper

Diffusion Analysis of Flue Gases Through Carbon Nanotube- and Graphene-Reinforced PEBAX Nanocomposite Membranes: A Molecular Dynamic Study †

1
Industrial Systems Engineering, University of Regina, 3737 Wascana Pkwy, Regina, SK S4S 0A2, Canada
2
Energy Systems Engineering, University of Regina, 3737 Wascana Pkwy, Regina, SK S4S 0A2, Canada
*
Author to whom correspondence should be addressed.
Presented at the 1st International Conference on Industrial, Manufacturing, and Process Engineering (ICIMP-2024), Regina, Canada, 27–29 June 2024.
Eng. Proc. 2024, 76(1), 65; https://doi.org/10.3390/engproc2024076065
Published: 31 October 2024

Abstract

Dependency on fossil fuels for global energy demand has led to an increase in the concentration of CO2 in the atmosphere, thereby contributing to environmental challenges such as climate change, rise in atmospheric temperature, etc. Since the major contributions of CO2 emissions are from industries, capturing CO2 from post-combustion flue gas has become the focus of many research communities. As such, membrane-based carbon capture and storage (CCS) is an important pathway for controlling CO2 emissions. However, performance validation for membrane separation is required to find the best composite material with a high diffusion rate. Hence, the objectives of this research included determining the performance of the nanocomposite membranes comprising polyether-block-amide (PEBAX) as a matrix and carbon nanotube (CNT) and armchair graphene as reinforcements as well as obtaining the flue gas diffusion rate using molecular dynamic (MD) analysis. Two different composition ratios of the flue gas with an equal ratio (1:1) and an actual post-combustion ratio were developed. The molecular dynamic simulation results obtained from LAMMPS and OVITO determined that graphene-based nanocomposites were better suited for the diffusion of the CO2/N2 and CO2/N2/O2 flue gas compositions, and CNT-reinforced nanocomposite membranes performed better for the CO2/O2 flue gas blend.

1. Introduction

Currently, fossil fuels play a crucial role in fulfilling energy demand until an alternative reliable energy source can be found. The continued burning of fossil fuel has led to an increase in the greenhouse effect due to the emission of CO2 into the atmosphere, in particular from the industrial combustion flue gases. There are several ways to mitigate CO2 emissions, such as pre-combustion carbon capture (gasification with oxygen), post-combustion carbon capture (using chemical absorption, physical adsorption, or membrane-based separation), and oxyfuel combustion [1]. The membrane-based separation has shown great promise for post-combustion CO2 capture due to its sustainability, low cost, and highly efficient capturing system [2,3,4]. Polymer-based matrix-reinforced nanocomposite membranes, specifically polyether-block-amide (PEBAX), have been found to perform well in both CO2 selectivity and enhanced gas diffusion [5,6], which has led to better performance in CO2 capture. Carbon-based nanoparticle-reinforced PEBAX nanocomposites have shown great results in CO2 capture [7,8,9]. However, with the smaller size, analyzing the impact of nanoparticles with the polymer membrane on CO2 capture using experimental methods is challenging, and hence computational methods are preferred. Molecular dynamic (MD) simulation can replicate the same output with detailed interactions on the atomic scale [10]. Therefore, the main objective of this research was to characterize the armchair carbon nanotube (CNT)- and armchair graphene-reinforced PEBAX nanocomposite using molecular dynamics and investigate their flue gas diffusion performance through the nanocomposite membrane for CO2 capture at the actual post-combustion (APC) and equal gas mixture ratios.

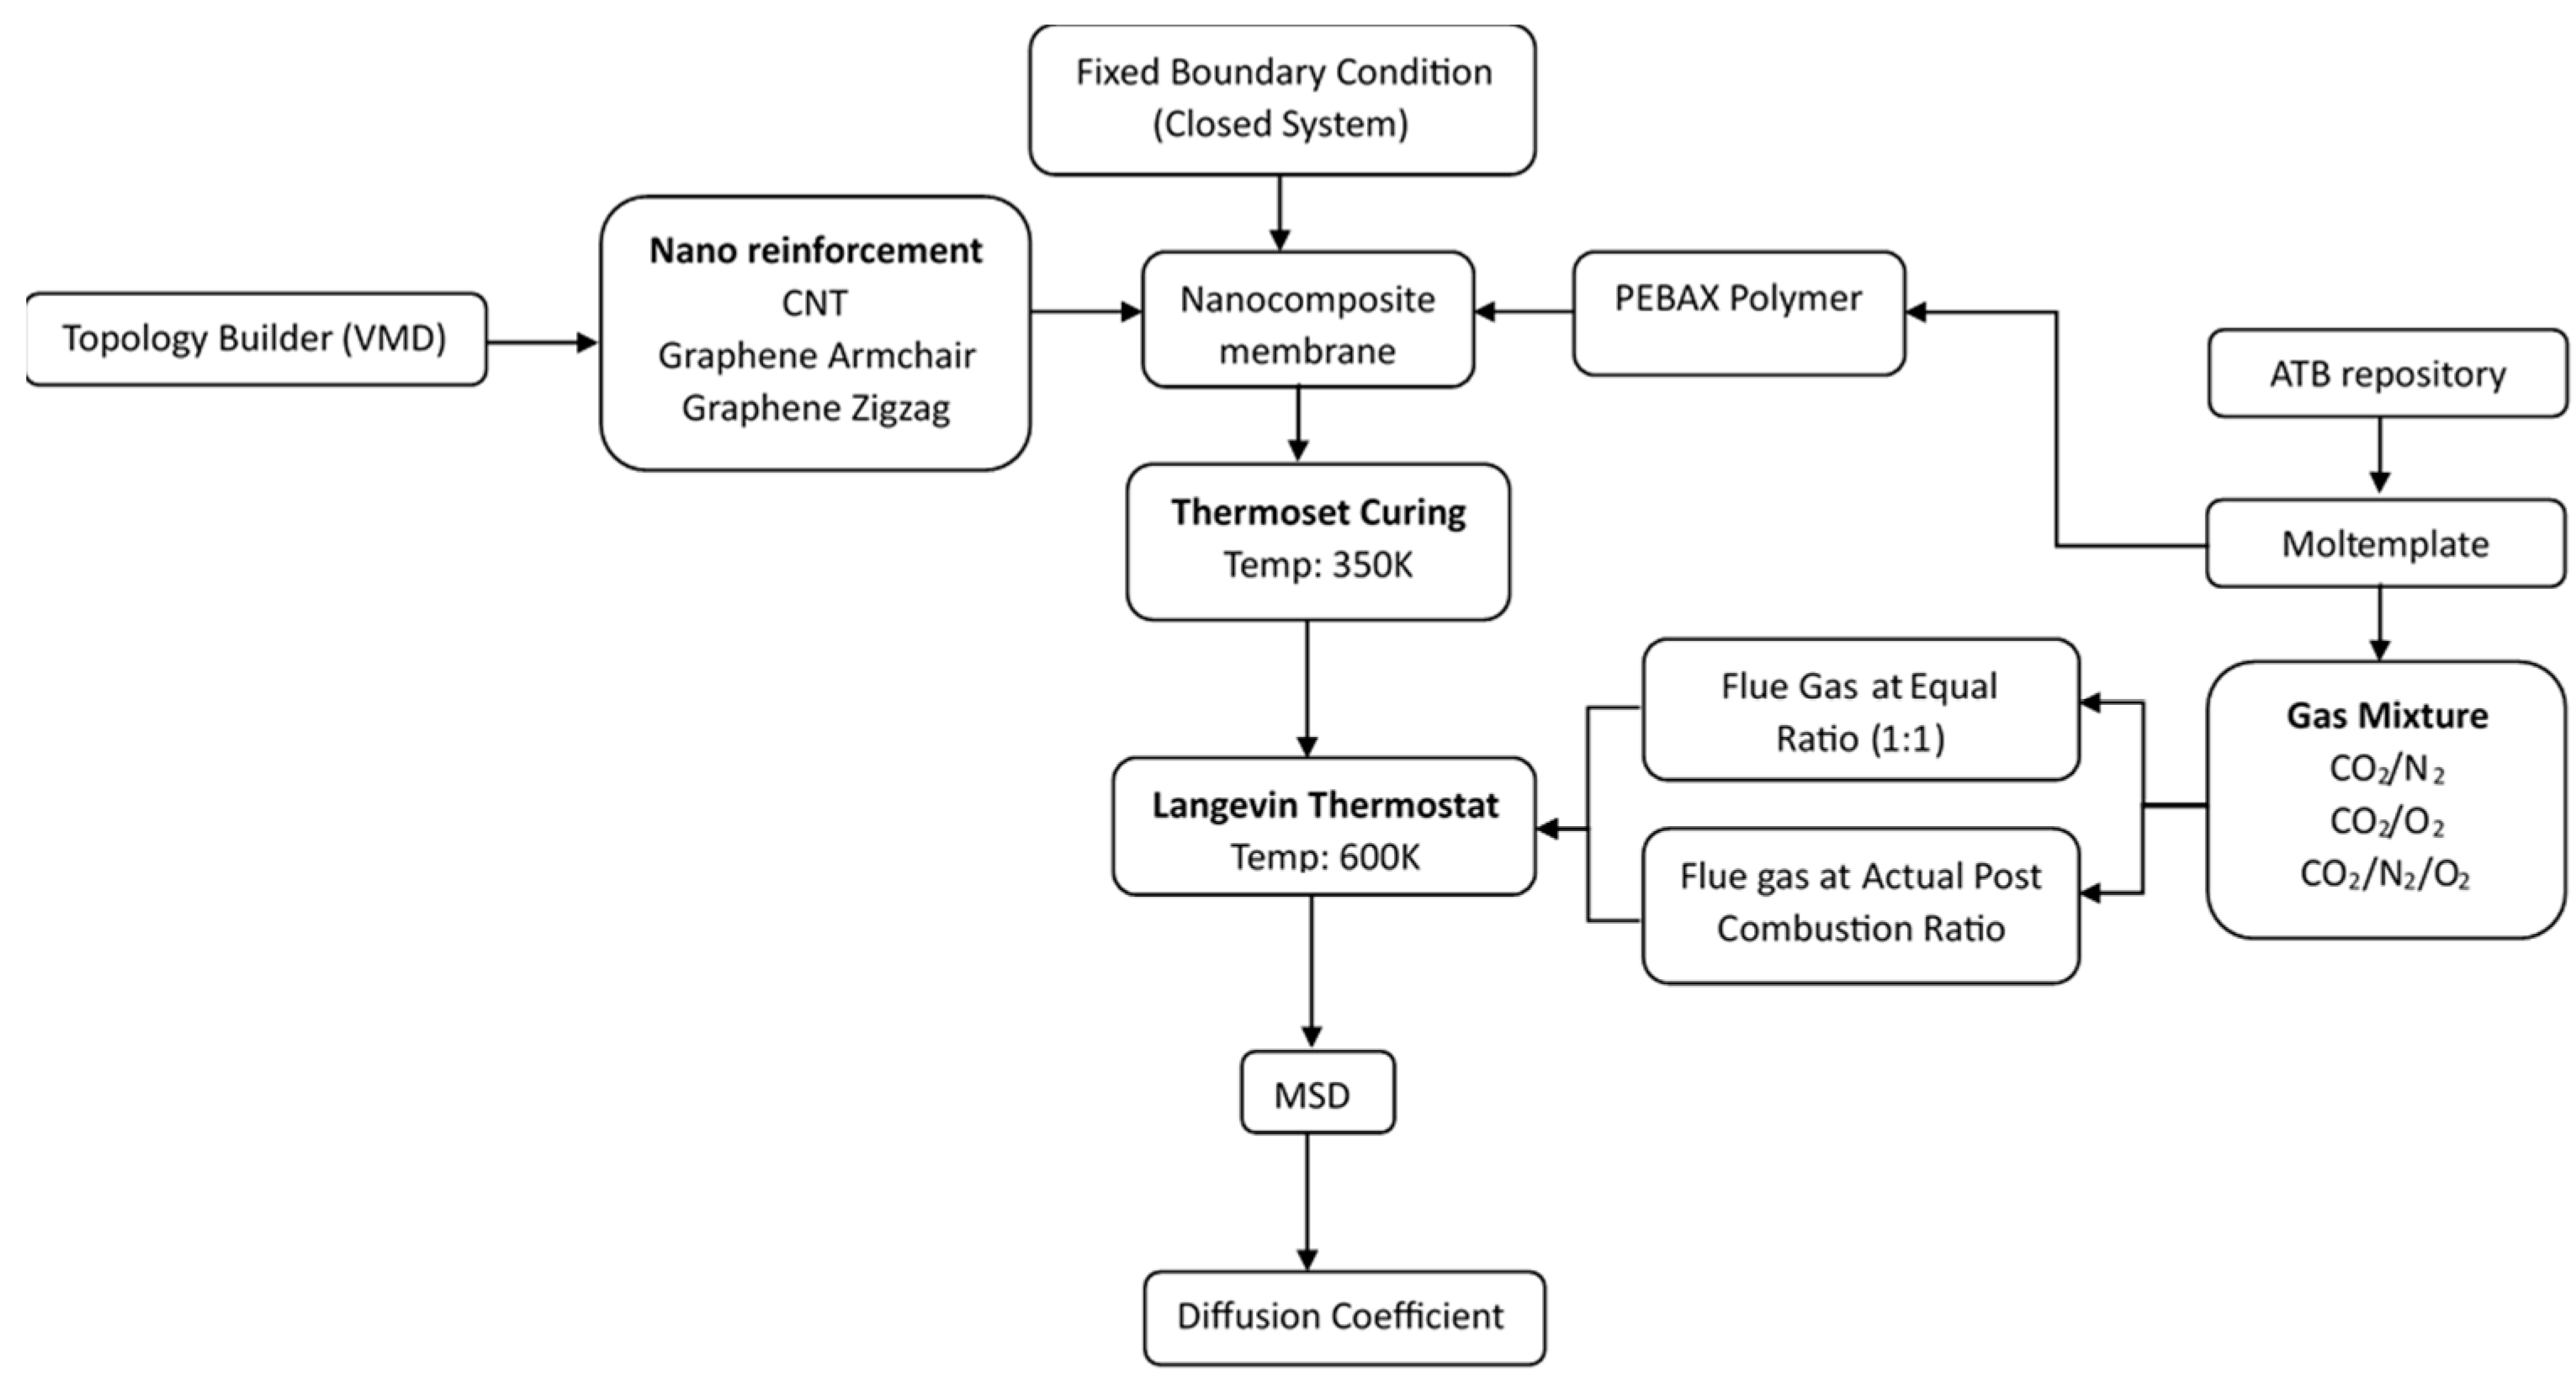
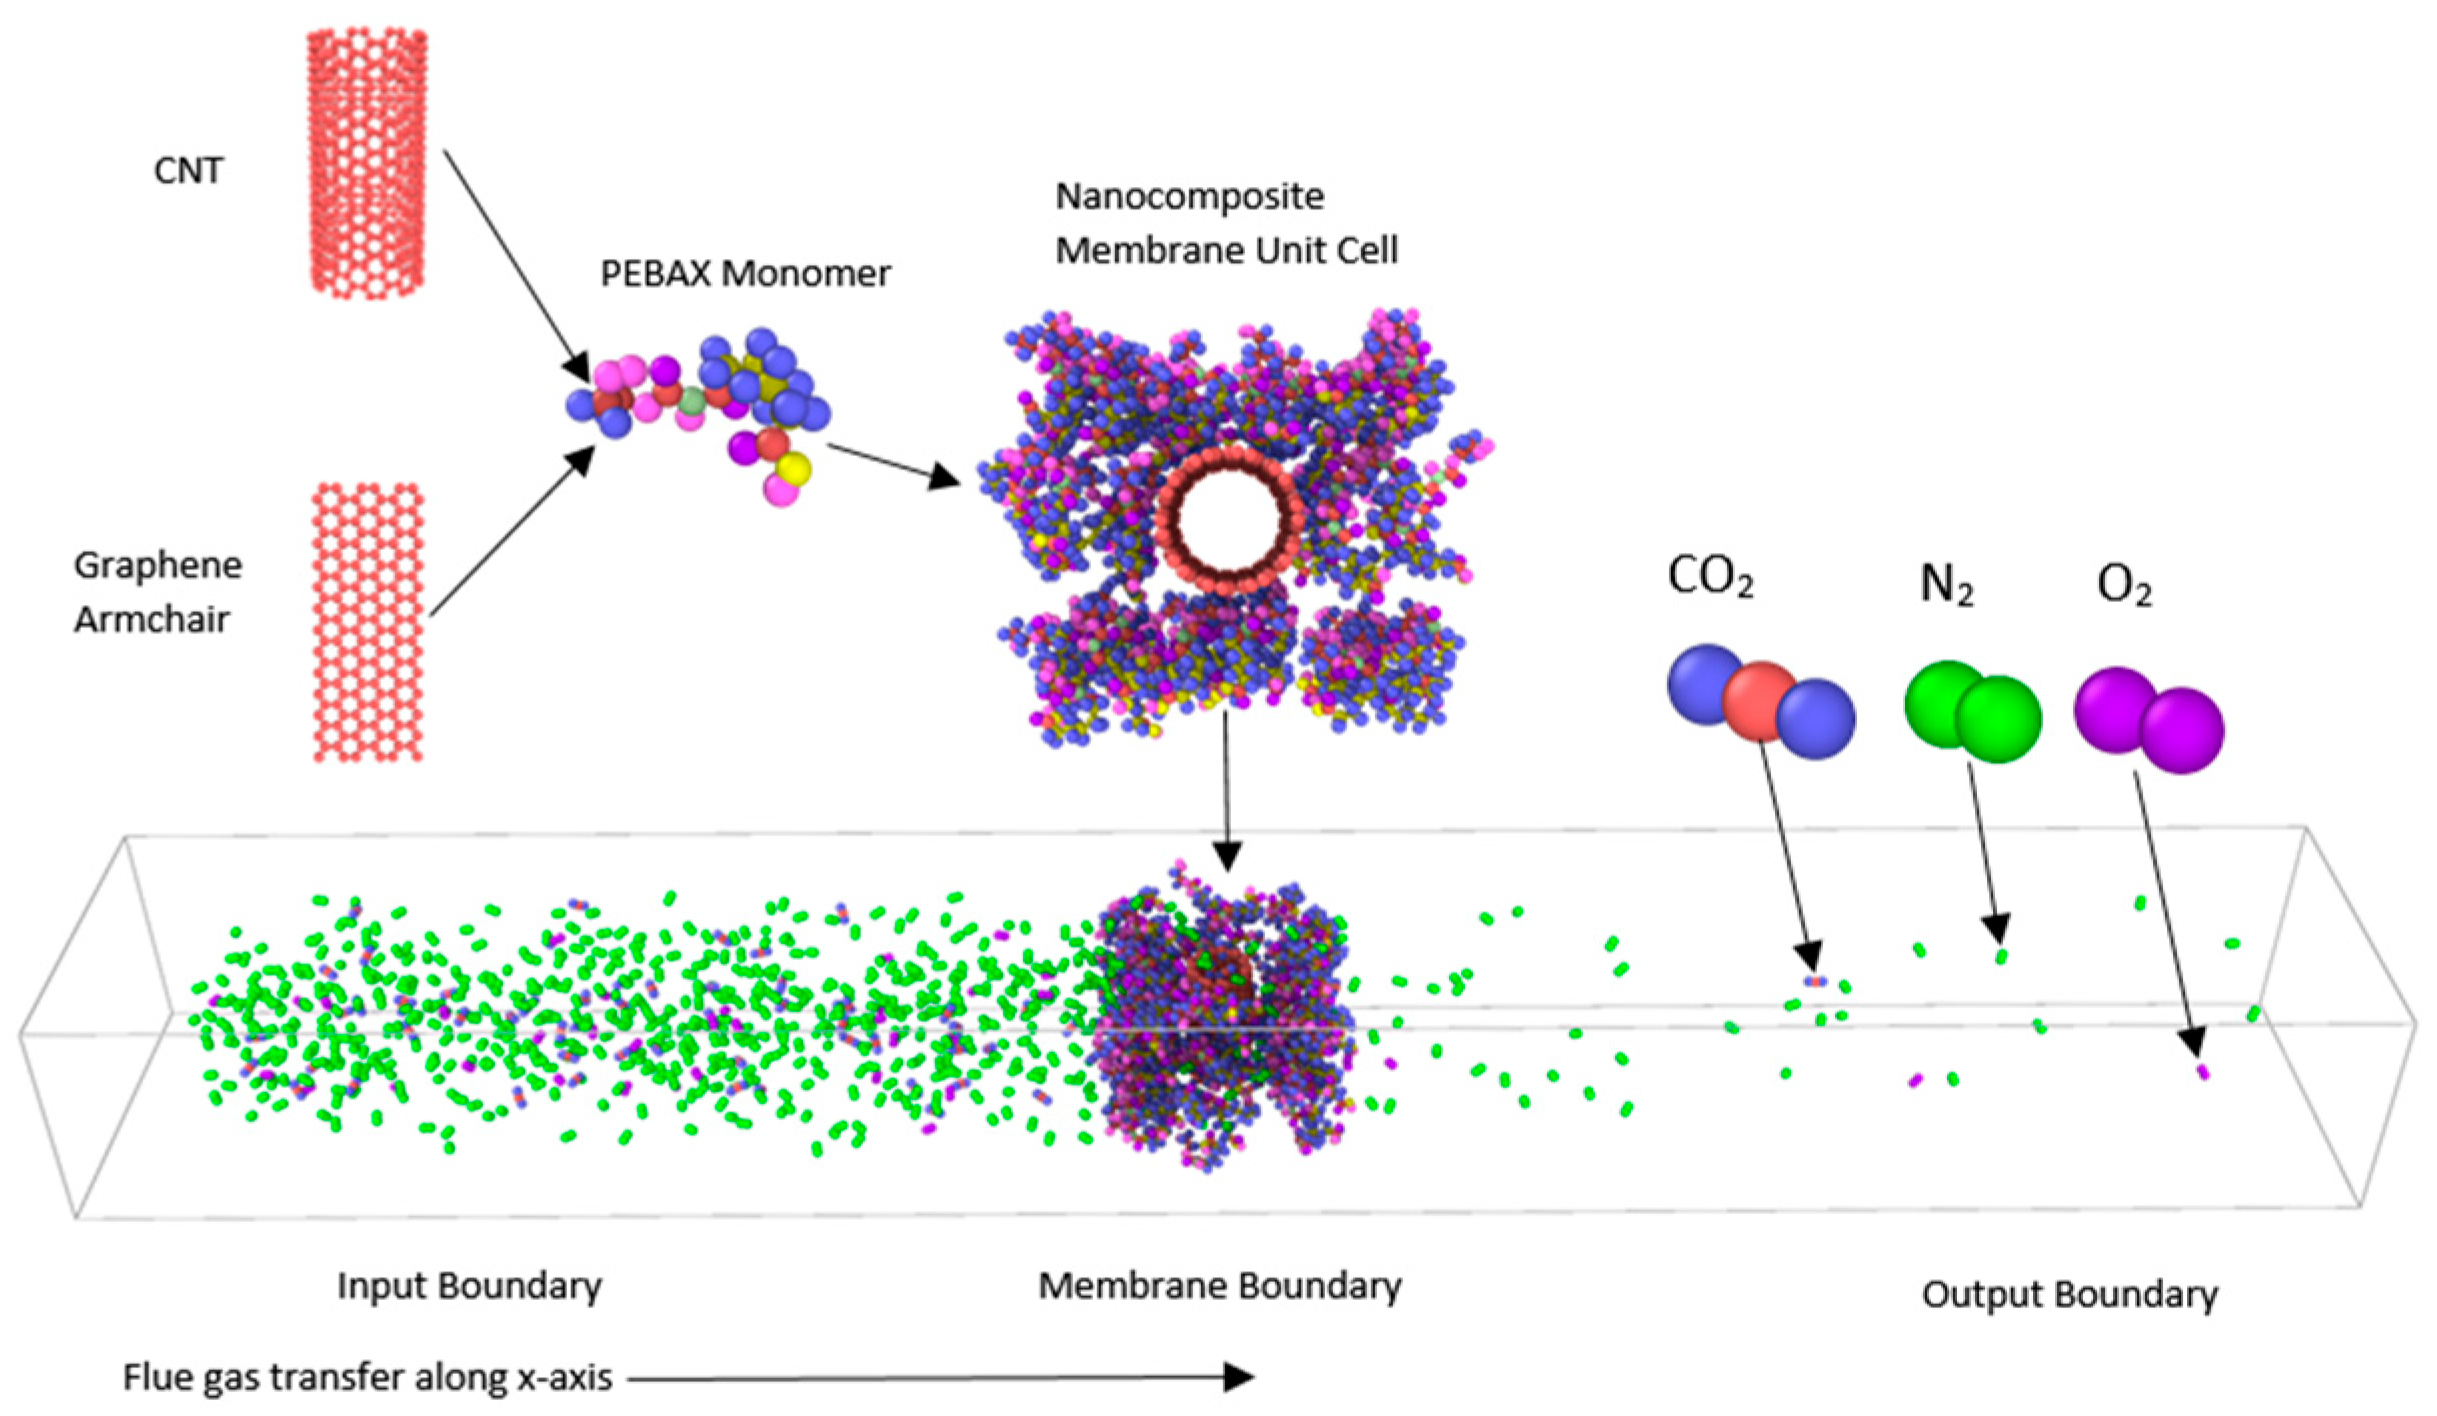
2. Materials and Methods

In this study, two different nanocomposite membranes were developed using polyether-block-amide (PEBAX) as the matrix, along with armchair carbon nanotube (CNT) and armchair graphene as the reinforcements. The unit cell of the nanocomposite membrane was composed of a PEBAX matrix with either one CNT or a single graphene sheet placed perpendicular to the flue gas diffusion direction. The gas blend of CO2/N2, CO2/O2, and CO2/N2/O2, with an equal (1:1) ratio and based on the actual post-combustion (APC) ratio, was selected for the analysis. The gas composition is given in Table 1.
A Large-scale Atomic/Molecular Massively Parallel Simulator (LAMMPS) was used as the principal MD simulation engine [13] to model and analyze the nanocomposite membrane and also to determine the diffusion coefficient of the gas mixture. The gas molecular information of CO2, N2, and O2, as well as the PEBAX molecular structure were obtained from the Automated Topology Builder (ATB) repository [14,15]. Using Moltemplate, the ATB input script was transformed into a general cross-platform molecule input script consisting of the molecular information capable of operating in the LAMMPS engine [16]. The nano-reinforcements were generated using Visual Molecular Dynamics (VMD) and, with the help of “Topology Builder”, the carbon nanostructure was built. The TopoTools plugin was used to access the topological-related data stored in the VMD [17]. LAMMPS commands were used to make the gas blend as shown in Table 1, and the simulation and the results were visualized using OVITO.
A unit cell with a fixed boundary of 40 nm × 6 nm × 4 nm and a 4 nm thick nanocomposite membrane was simulated. The membrane was then cured at 350 K before the gas mixture with a Langevin thermostat at 600 K was introduced to observe the mean squared derivative (MSD) of the flue gas mixture. The Brownian motion of the gas particle through the nanocomposite membrane was used to determine the diffusion coefficient of the gas mixture. The schematic of the MD Simulation process is shown in Figure 1.
The gas mixture followed the Brownian dynamics to diffuse within the boundary region. The molecular dynamics followed the stochastic system of probability of randomness to diffuse through the nanocomposite membrane. The Langevin thermostat generated a total force (F) for the flue gas, as shown in Equation (1).
F = F c + F f + F r
F f = m d a m p   v
F r k B T m d t   d a m p
where
  • Fc is a conservative force of the inter-particle interaction of the molecules;
  • Ff is the frictional drag or viscous damping of the particles;
  • Fr is the force generated due to the system temperature and random collision of the particle transferring the energy in the process;
  • m represents the mass of each particle;
  • v is the velocity of the particles in motion;
  • kB is the Boltzmann’s constant;
  • T represents the system temperature;
  • and damp is the damping constant.
The MSD of the flue gas was calculated for the x, y, and z axes using Equation (4). The diffusion coefficient of the flue gas mixture was obtained using Equation (5), which is the slope of the MSD curve with the system dimension of N = 3 [10,18].
M S D = d x 2 + d y 2 + d z 2
D = lim t s l o p e ( M S D ) 2 N t

3. Results

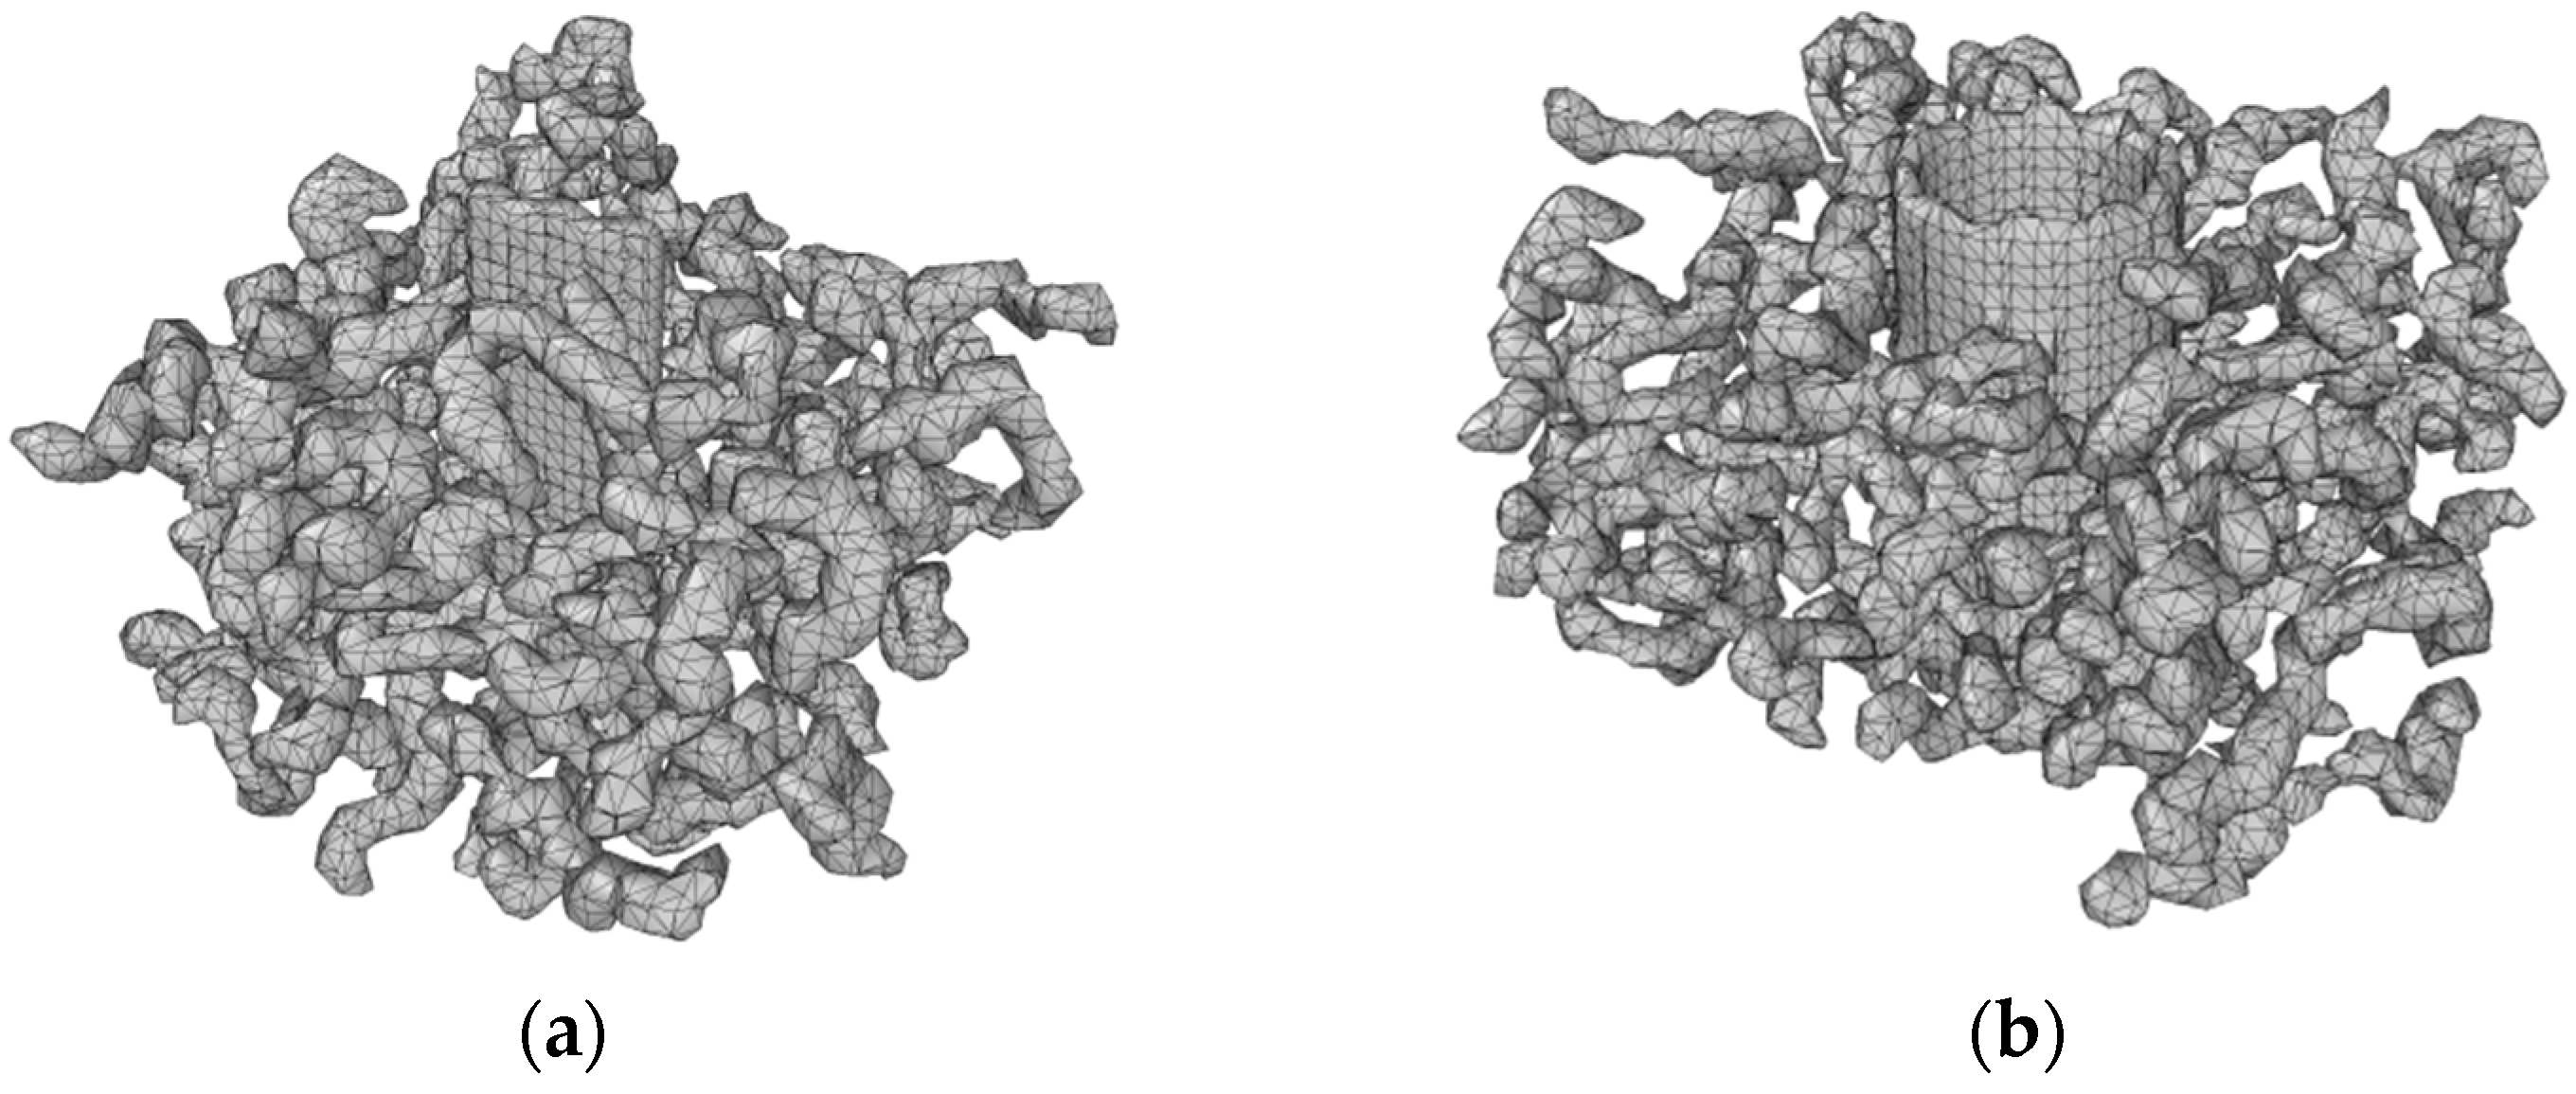
3.1. Surface Mesh Analysis of Nanocomposite

Figure 2 shows the surface mesh model of the nanocomposite membrane produced by the visualization software, OVITO version 3.8.0. The models were used to measure the surface area of the nanocomposite membrane. The results confirm that the addition of CNT with PEBAX increased the surface area of the final composites to 15,042 Å2, whereas the addition of graphene armchair nanoparticles reduced the surface area to 13,229 Å2, respectively. The reduction in surface area is due to the addition of armchair graphene nanoparticles, which generated higher free volume (voids) within the nanocomposite membrane than the CNT nanocomposites.

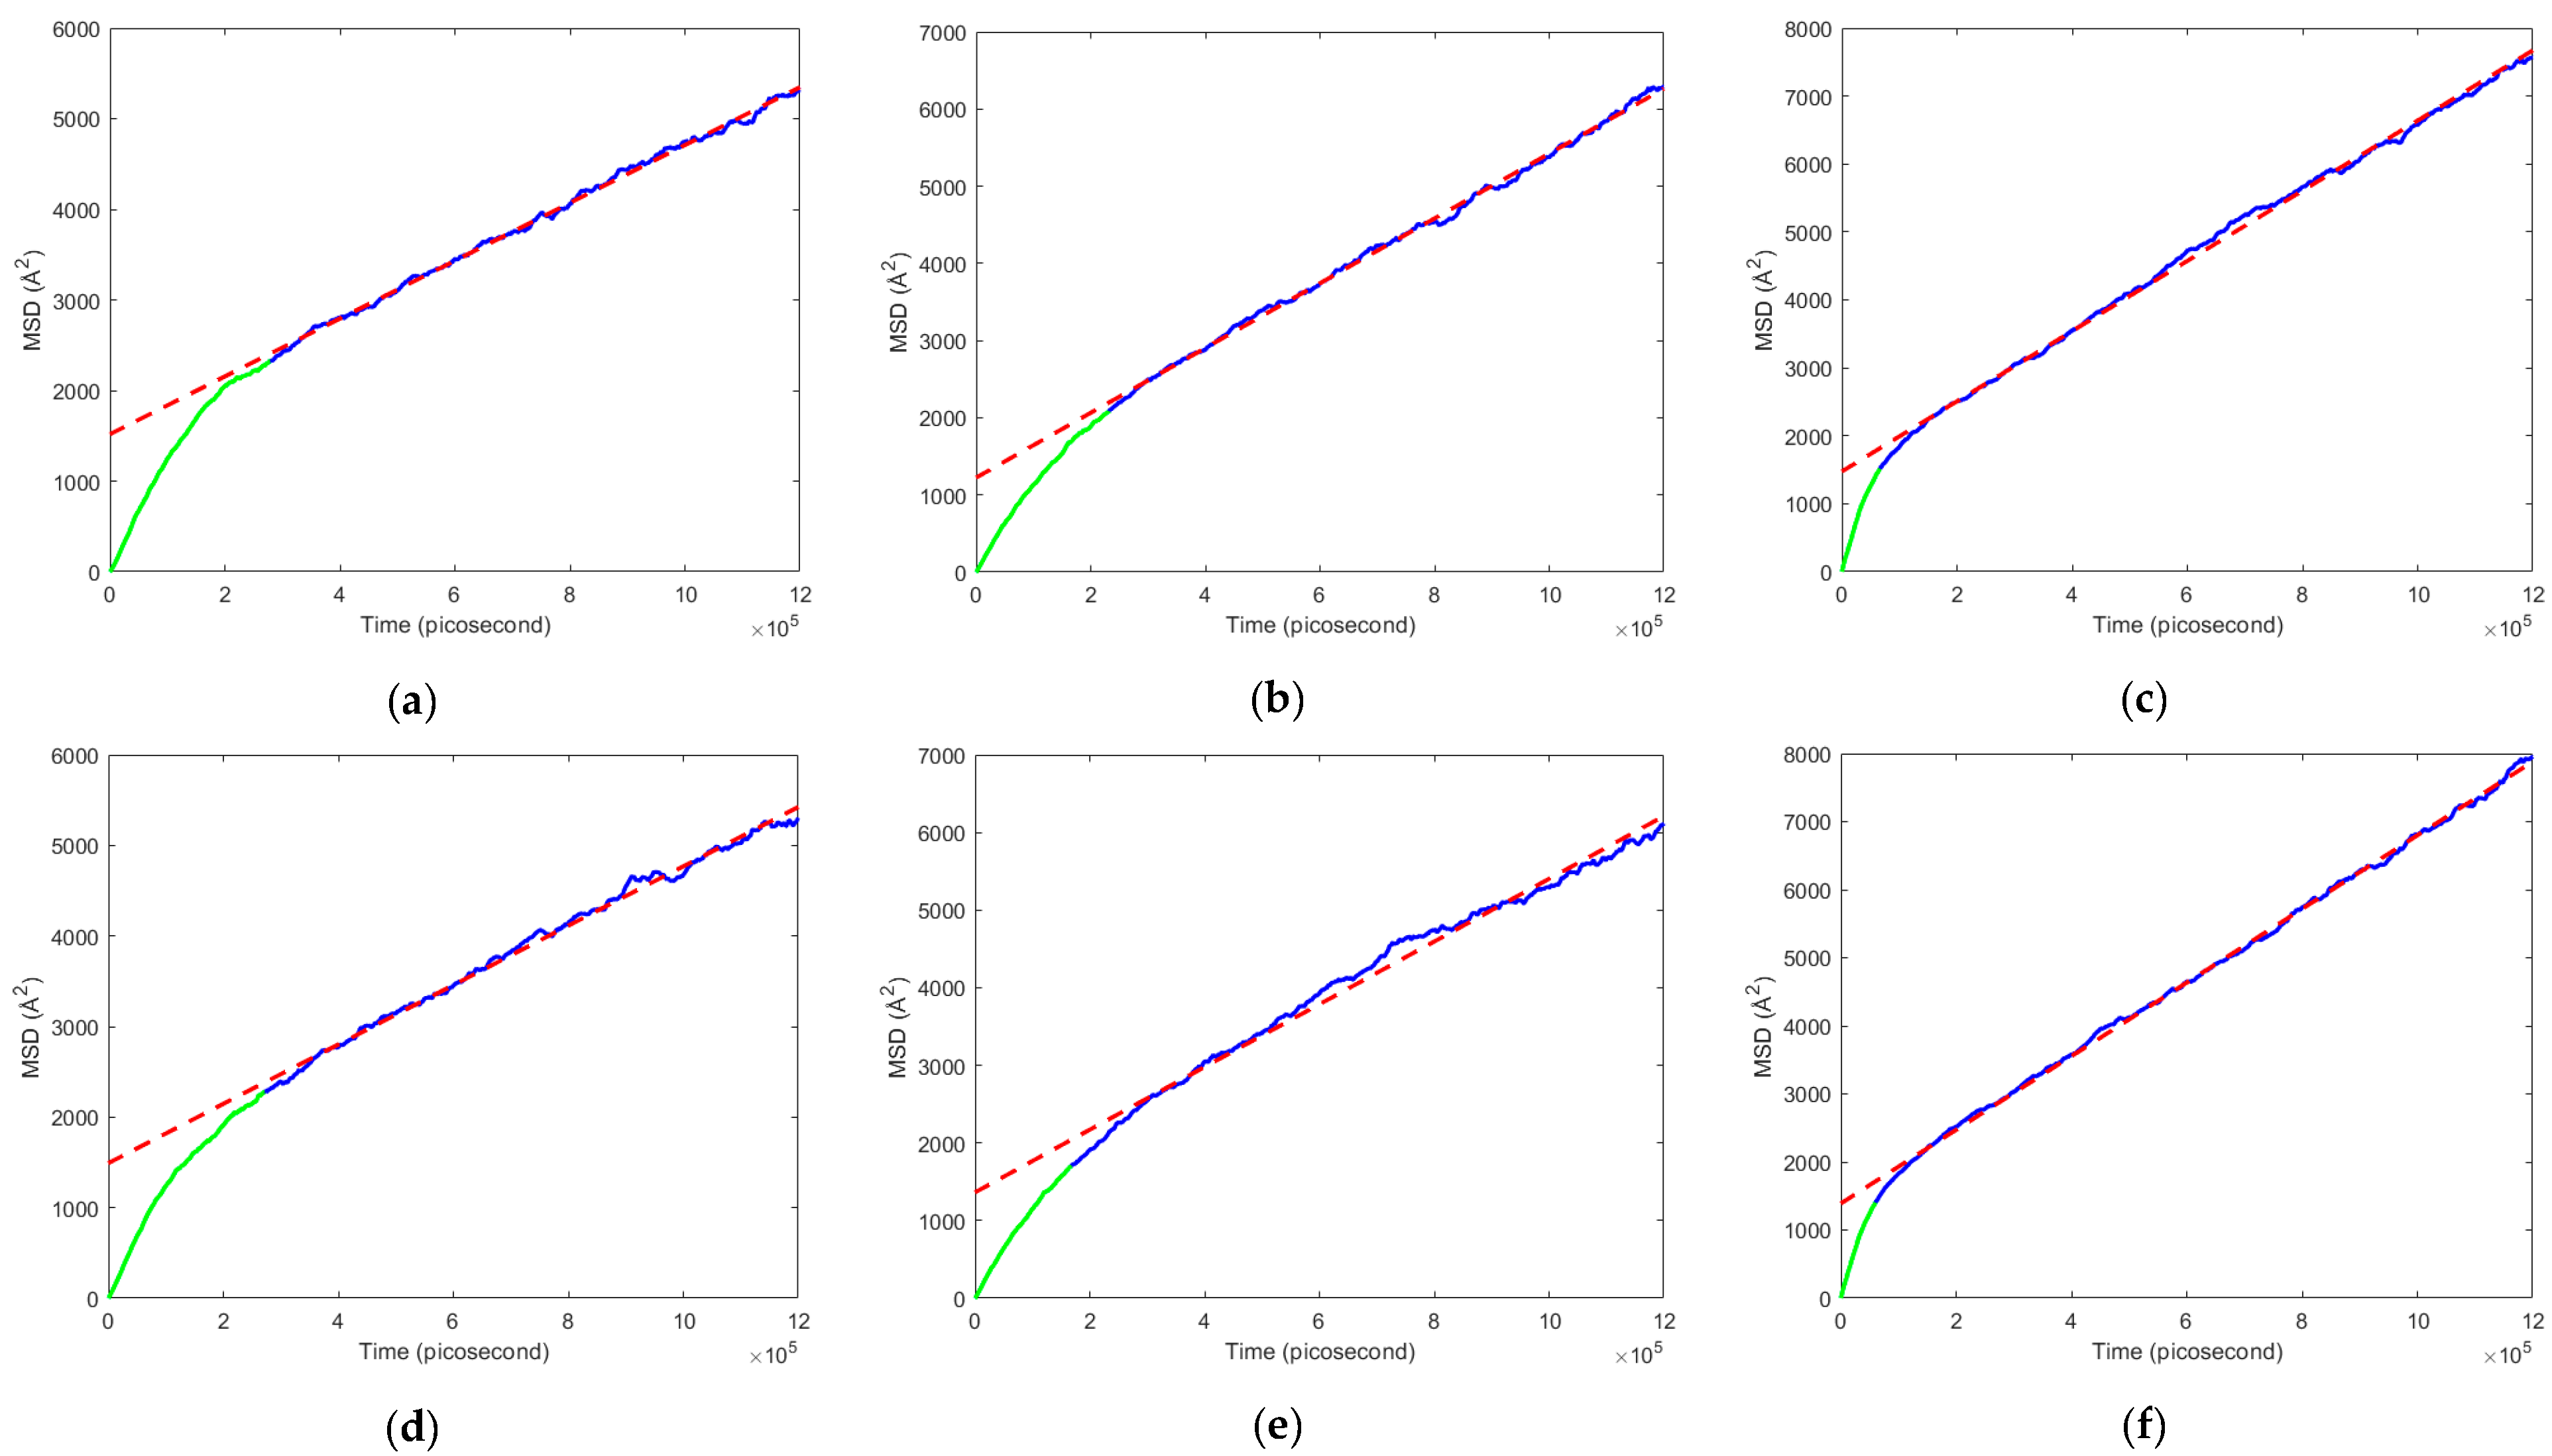
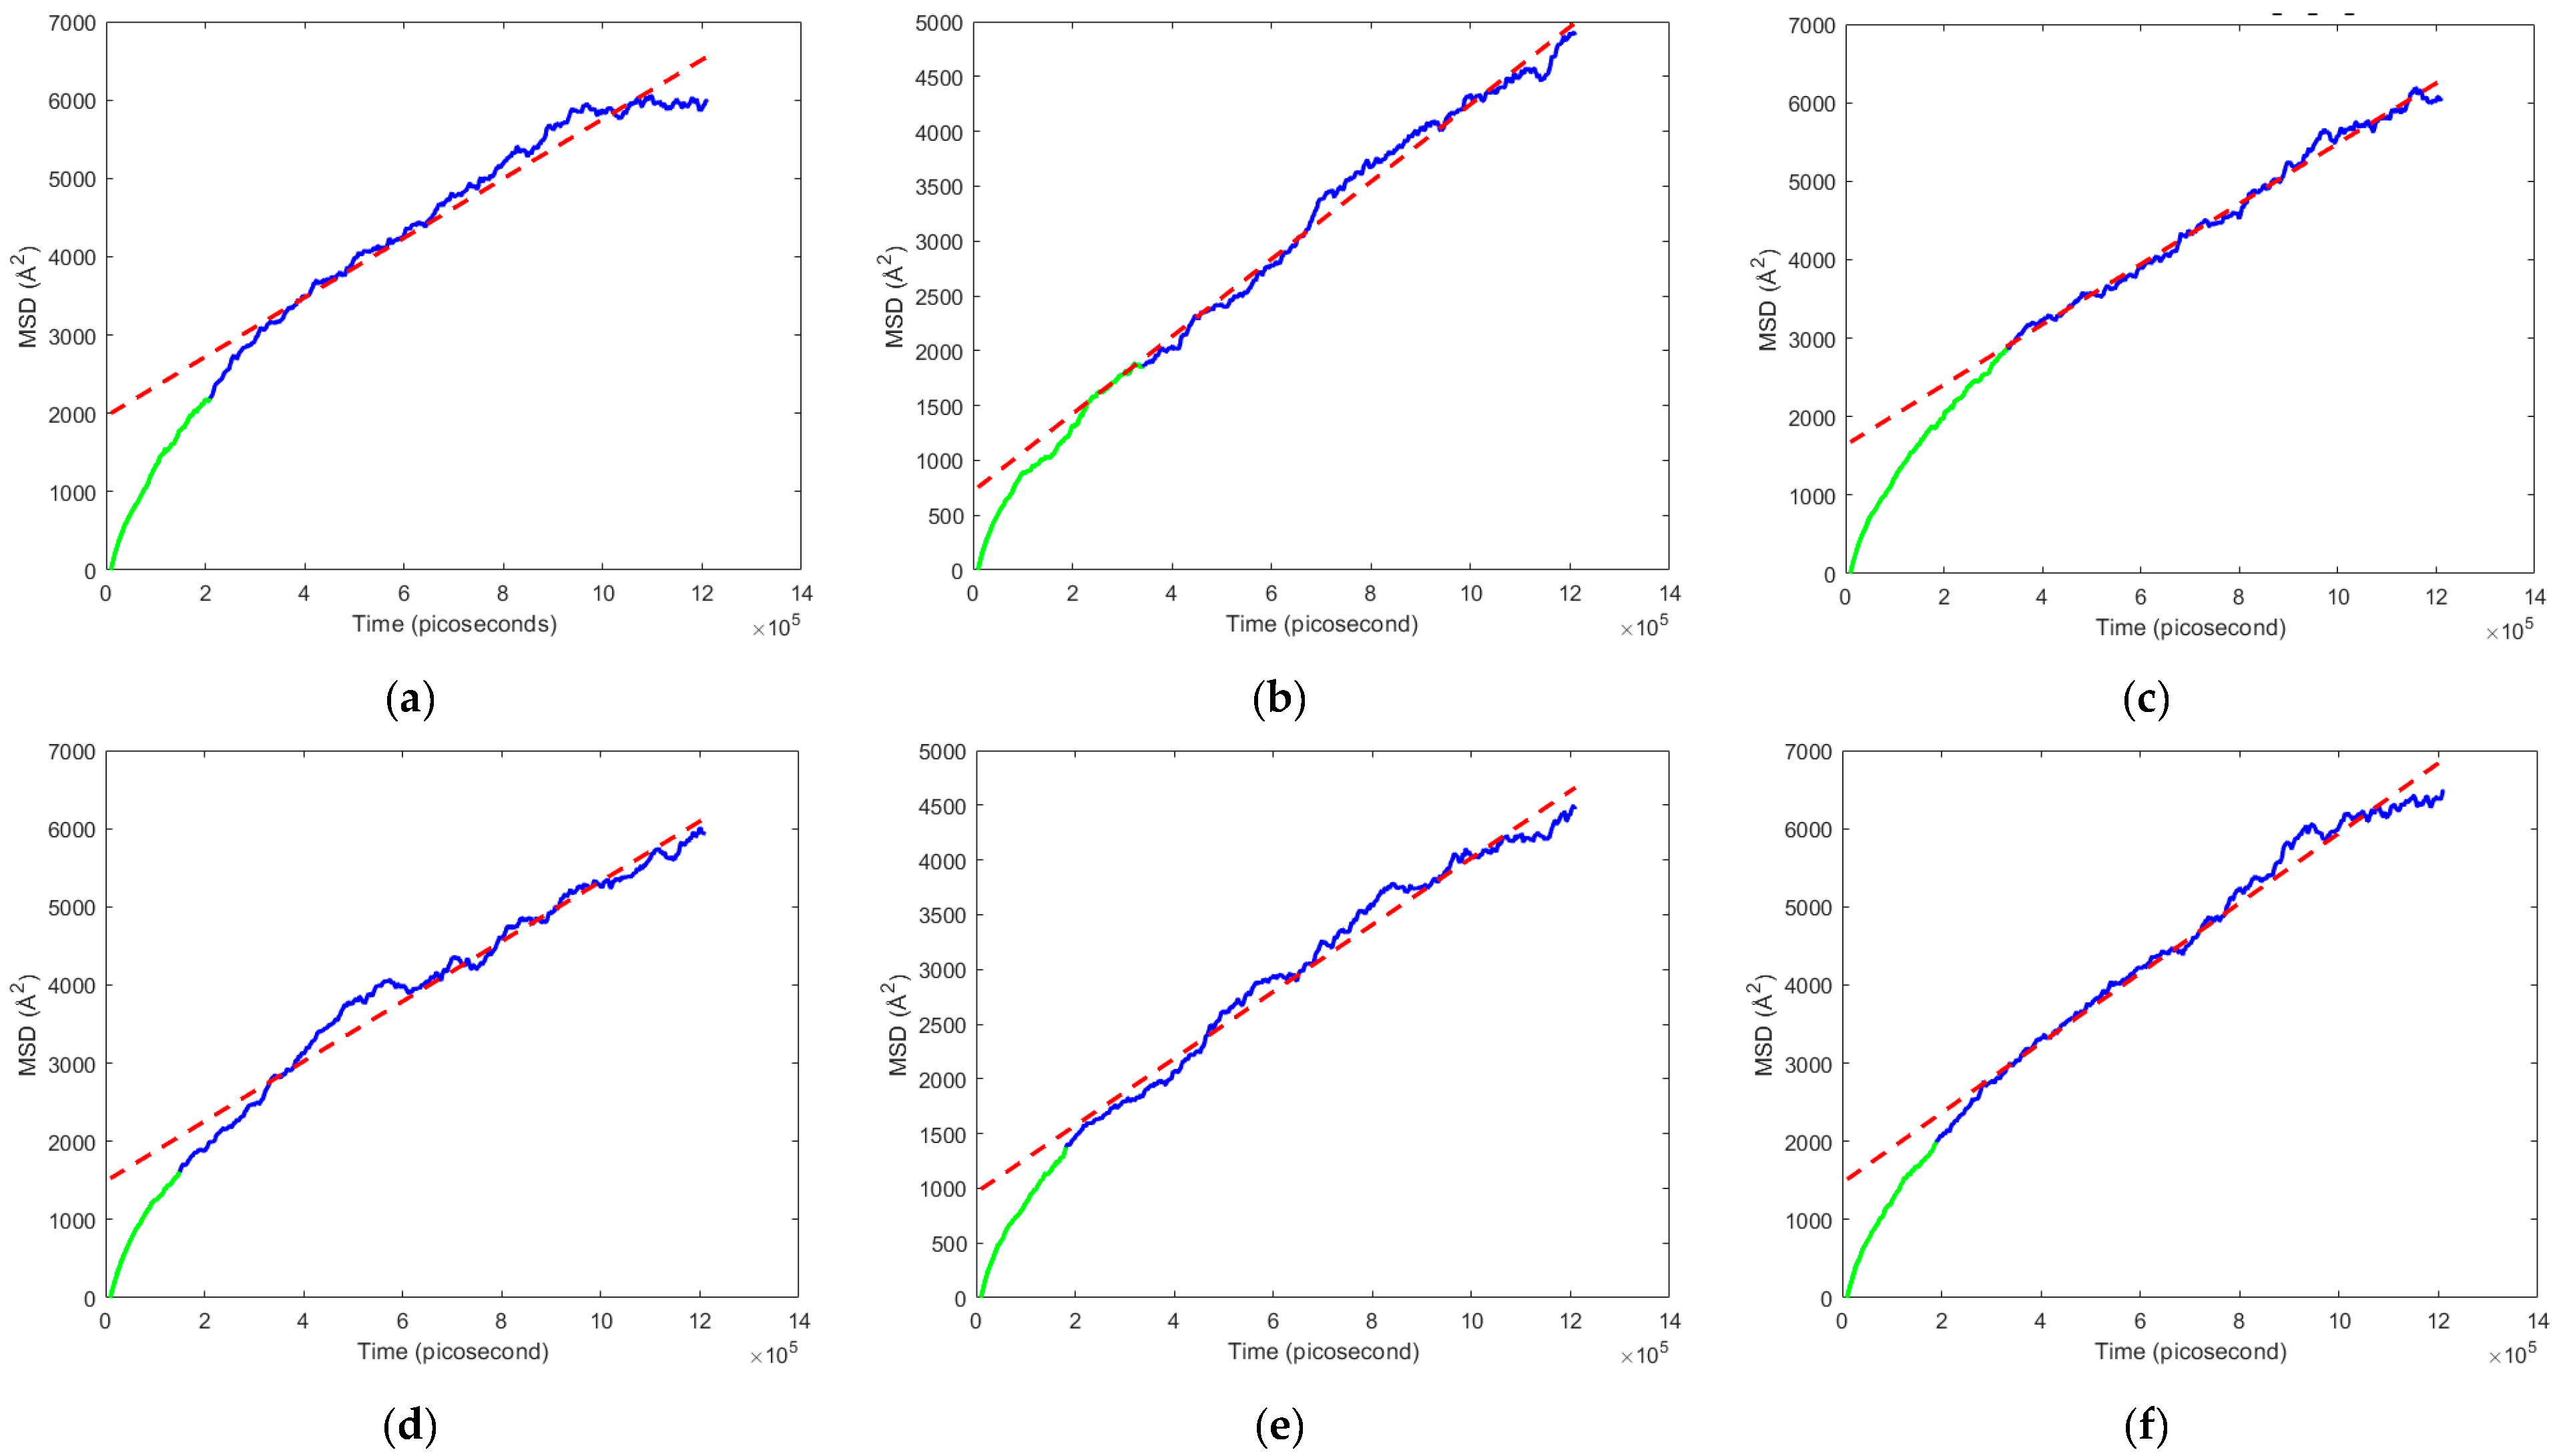
3.2. Mean Squared Displacement and Diffusion Coefficient

The mean squared displacement (MSD) of the flue gas was extracted from the molecular trajectory using Equation (4). Due to the Langevin thermostat used in the microcanonical ensemble, the flue gas generated kinetic energy which was proportional to the introduced temperature (600 K), which further enabled the gas molecules to start diffusing through the membrane. Finally, the MSD was calculated using the diffusion rate. Figure 3 shows the displacement behavior of the gas molecules modeled using MD simulation.
Figure 4 and Figure 5 show the MSD performance of the CO2/N2, CO2/O2, and CO2/N2/O2 through the CNT- and armchair graphene-reinforced nanocomposite membranes for both the equal (1:1) and APC ratio gas blends. At the initial stage, the flue gas expanded within the input boundary, where no diffusion through the membrane boundary occurred. This region is called the ballistic region [10] and was excluded from the diffusion calculations. Gradually, the flue gas started to diffuse through the membrane boundary and finally ended up in the output boundary. The diffusion occurred mainly through the void space generated during the curing and alignment of the nanocomposite membrane, which dictated the displacement behavior of the gas molecules.
The neglected ballistic region is identified with a green line whereas the MSD that was considered for the calculations to determine the diffusion coefficient was identified as blue. The slope of the MSD was generated over the acceptable MSD region, as identified with a red dotted line, and used to calculate the diffusion coefficient of the respective flue gas mixture ratios using Equation (5).
Figure 6 shows the diffusion coefficient for the flue gas mixture at an equal (1:1) ratio and APC ratio for the CNT- and armchair graphene-reinforced nanocomposites. The diffusion results from Table 2 show that the graphene armchair for CO2/N2/O2 gas blend with the equal (1:1) ratio had the highest diffusion coefficient of 1.50 × 10⁻⁶ cm2s−1, resulting in a greater diffusion rate compared to other models. Overall, the graphene nanocomposite membrane performed better than the CNT-reinforced nanocomposite for CO2/N2, and CO2/N2/O2 with equal ratios. Only for the CO2/O2 gas blend did the CNT nanocomposites outperform for both the equal and APC ratios, with diffusion coefficients of 1.17 × 10⁻⁶ and 9.80 × 10⁻⁷ cm2 s−1, respectively. The difference in the diffusion coefficient was due to the Knudsen diffusion mechanism controlling the N2-enriched flue gas mixture with a higher kinetic diameter (3.64 Å), whereas the molecular sieving mechanism controlled the O2 enriched flue gas mixture thus reducing the impact of free space within the nanocomposite membrane [19].

4. Conclusions

From the molecular dynamic analysis of the CNT- and graphene-reinforced nanocomposite membranes, the following conclusions can be derived for post-combustion flue gas diffusion:
  • Molecular dynamic (MD) simulation is an effective method to determine the diffusion coefficient of flue gas and could be utilized to understand the diffusion mechanisms at the atomic scale under explicit conditions.
  • The armchair graphene-reinforced PEBAX nanocomposite showed the highest diffusion coefficient for the N2-enriched flue gas mixture. This is mainly due to the lowest surface area of 13,229 Å2, resulting in a higher region of free volume space, which drove the flue gas with a higher kinematic diameter to diffuse through the membrane following the Knudsen diffusion mechanism.
  • The diffusion coefficient for the CNT-reinforced nanocomposite was lower for the O2-enriched flue gas mixture, which is due to the molecular sieve diffusion mechanism.
As per the Robeson limit, it can be concluded that selectivity acts inversely to the diffusion coefficient, making the CNT-reinforced nanocomposite the most suitable composite membrane for CO2 selectivity [20]. The limitation of this research work is that the computationally intensive MD simulation was only able to validate the result for a short time-step and small simulation boundary. The future scope of the work could be extended to identify CO2 capture in nanocomposite membranes by focusing on CO2 selectivity and flue gas permeability of the gas mixture and using MD analysis to understand the membrane performance further.

Author Contributions

Conceptualization, N.Q. and S.D.J.M.; methodology, S.D.J.M. and N.Q.; formal analysis, N.Q. and S.D.J.M.; writing—original draft preparation, N.Q. and S.D.J.M.; writing—review and editing, S.D.J.M. and G.K.; supervision, S.D.J.M. All authors have read and agreed to the published version of the manuscript.

Funding

This research was partially supported by the Natural Sciences and Engineering Research Council of Canada (NSERC DDG-2020-00046).

Institutional Review Board Statement

Not applicable.

Informed Consent Statement

Not applicable.

Data Availability Statement

Data are included as results in the manuscript.

Conflicts of Interest

The authors declare no conflicts of interest.

References

  1. Madejski, P.; Chmiel, K.; Subramanian, N.; Kuś, T. Methods and Techniques for CO2 Capture: Review of Potential Solutions and Applications in Modern Energy Technologies. Energies 2022, 15, 887. [Google Scholar] [CrossRef]
  2. Gupta, Y.; Hellgardt, K.; Wakeman, R. Enhanced permeability of polyaniline based nano-membranes for gas separation. J. Membr. Sci. 2006, 282, 60–70. [Google Scholar] [CrossRef]
  3. Merkel, T.C.; Lin, H.; Wei, X.; Baker, R. Power plant post-combustion carbon dioxide capture: An opportunity for membranes. J. Membr. Sci. 2010, 359, 126–139. [Google Scholar] [CrossRef]
  4. Ngoy, J.M.; Wagner, N.; Riboldi, L.; Bolland, O. A CO2 Capture Technology Using Multi-walled Carbon Nanotubes with Polyaspartamide Surfactant. Energy Procedia 2014, 63, 2230–2248. [Google Scholar] [CrossRef]
  5. Zhao, D.; Ren, J.; Wang, Y.; Qiu, Y.; Li, H.; Hua, K.; Li, X.; Ji, J.; Deng, M. High CO2 separation performance of Pebax®/CNTs/GTA mixed matrix membranes. J. Membr. Sci. 2017, 521, 104–113. [Google Scholar] [CrossRef]
  6. Bernardo, P.; Clarizia, G. Enhancing Gas Permeation Properties of Pebax® 1657 Membranes via Polysorbate Nonionic Surfactants Doping. Polymers 2020, 12, 253. [Google Scholar] [CrossRef] [PubMed]
  7. Wang, S.; Liu, Y.; Huang, S.; Wu, H.; Li, Y.; Tian, Z.; Jiang, Z. Pebax–PEG–MWCNT hybrid membranes with enhanced CO2 capture properties. J. Membr. Sci. 2014, 460, 62–70. [Google Scholar] [CrossRef]
  8. Dai, Z.; Deng, J.; Peng, K.-J.; Liu, Y.-L.; Deng, L. Pebax/PEG Grafted CNT Hybrid Membranes for Enhanced CO2/N2 Separation. Ind. Eng. Chem. Res. 2019, 58, 12226–12234. [Google Scholar] [CrossRef]
  9. Habibiannejad, S.A.; Aroujalian, A.; Raisi, A. Pebax-1657 mixed matrix membrane containing surface modified multi-walled carbon nanotubes for gas separation. RSC Adv. 2016, 6, 79563–79577. [Google Scholar] [CrossRef]
  10. Syarif, J.; Badawy, K.; Hussien, H.A. Atomistic simulation of the diffusion behavior in Al-Fe. Nucl. Mater. Energy 2021, 29, 101073. [Google Scholar] [CrossRef]
  11. Brunetti, A.; Scura, F.; Barbieri, G.; Drioli, E. Membrane technologies for CO2 separation. J. Membr. Sci. 2010, 359, 115–125. [Google Scholar] [CrossRef]
  12. Li, B.; Wang, S.; Tian, Z.; Yao, G.; Li, H.; Chen, L. Understanding the CO2/CH4/N2 Separation Performance of Nanoporous Amorphous N-Doped Carbon Combined Hybrid Monte Carlo with Machine Learning. Adv. Theory Simul. 2022, 5, 2100378. [Google Scholar] [CrossRef]
  13. Thompson, A.P.; Aktulga, H.M.; Berger, R.; Bolintineanu, D.S.; Brown, W.M.; Crozier, P.S.; Veld, P.J.I.; Kohlmeyer, A.; Moore, S.G.; Nguyen, T.D.; et al. LAMMPS—A flexible simulation tool for particle-based materials modeling at the atomic, meso, and continuum scales. Comput. Phys. Commun. 2022, 271, 108171. [Google Scholar] [CrossRef]
  14. Malde, A.K.; Zuo, L.; Breeze, M.; Stroet, M.; Poger, D.; Nair, P.C.; Oostenbrink, C.; Mark, A.E. An Automated Force Field Topology Builder (ATB) and Repository: Version 1.0. J. Chem. Theory Comput. 2011, 7, 4026–4037. [Google Scholar] [CrossRef] [PubMed]
  15. Stroet, M.; Caron, B.; Visscher, K.M.; Geerke, D.P.; Malde, A.K.; Mark, A.E. Automated Topology Builder Version 3.0: Prediction of Solvation Free Enthalpies in Water and Hexane. J. Chem. Theory Comput. 2018, 14, 5834–5845. [Google Scholar] [CrossRef] [PubMed]
  16. Jewett, A.I.; Stelter, D.; Lambert, J.; Saladi, S.M.; Roscioni, O.M.; Ricci, M.; Autin, L.; Maritan, M.; Bashusqeh, S.M.; Keyes, T.; et al. Moltemplate: A Tool for Coarse-Grained Modeling of Complex Biological Matter and Soft Condensed Matter Physics. J. Mol. Biol. 2021, 433, 166841. [Google Scholar] [CrossRef] [PubMed]
  17. Kohlmeyer, A.; Vermaasand, J.; Braun, E. TopoTools, Release 1.9; Zenodo: Genève, Switzerland, 2022. [Google Scholar]
  18. Sorichetti, V.; Hugouvieux, V.; Kob, W. Structure and Dynamics of a Polymer–Nanoparticle Composite: Effect of Nanoparticle Size and Volume Fraction. Macromolecules 2018, 51, 5375–5391. [Google Scholar] [CrossRef]
  19. Kentish, S.E.; Scholes, C.A.; Stevens, G.W. Carbon Dioxide Separation through Polymeric Membrane Systems for Flue Gas Applications. Recent Pat. Chem. Eng. 2010, 1, 52–66. [Google Scholar] [CrossRef]
  20. Freeman, B.D. Basis of Permeability/Selectivity Tradeoff Relations in Polymeric Gas Separation Membranes. Macromolecules 1999, 32, 375–380. [Google Scholar] [CrossRef]
Figure 1. A flowchart of the MD analysis for determining the diffusion coefficient.
Engproc 76 00065 g001
Figure 2. Surface mesh model of (a) graphene armchair- and (b) CNT-reinforced nanocomposite.
Engproc 76 00065 g002
Figure 3. Molecular dynamic simulation of flue gas diffusing through nanocomposite membrane.
Engproc 76 00065 g003
Figure 4. Mean-squared displacement trend line of flue gas mixture at equal (1:1) ratio for nanocomposite membrane (a) CNT in CO2/N2, (b) CNT in CO2/O2, (c) CNT in CO2/N2/O2, (d) Graphene in CO2/N2, (e) Graphene in CO2/O2, and (f) Graphene in CO2/N2/O2.
Engproc 76 00065 g004
Figure 5. Mean-squared displacement trend-line of flue gas mixture at actual post-combustion (APC) ratio for nanocomposite membrane (a) CNT in CO2/N2, (b) CNT in CO2/O2, (c) CNT in CO2/N2/O2, (d) Graphene in CO2/N2, (e) Graphene in CO2/O2, and (f) Graphene in CO2/N2/O2.
Engproc 76 00065 g005
Figure 6. Diffusion coefficients of flue gas mixture at (a) equal (1:1) ratio and (b) APC ratio.
Engproc 76 00065 g006
Table 1. Gas mixture in equal ratio and actual post-combustion ratio.
MatrixReinforcementGas Mixture
Equal (1:1) (Ratio)APC (Ratio) *
CO2/N2CO2/O2CO2/N2/O2CO2/N2CO2/O2CO2/N2/O2
PEBAXCNT1:11:11:1:117:37:33:16:1
Graphene Armchair1:11:11:1:117:37:33:16:1
* The actual post-combustion (APC) ratio was derived from a flue gas mixture [3,11,12].
Table 2. Diffusion coefficient results in equal and actual post-combustion (APC) ratios.
Equal (1:1) (Ratio)APC (Ratio)
CO2/N2CO2/O2CO2/N2/O2CO2/N2CO2/O2CO2/N2/O2
CNT8.87 × 10−71.17 × 10−61.43 × 10−61.05 × 10−69.8 × 10−71.07 × 10⁻⁶
Graphene Armchair9.1 × 10−71.12 × 10−61.50 × 10−61.07 × 10−68.49 × 10−71.24 × 10⁻⁶
Disclaimer/Publisher’s Note: The statements, opinions and data contained in all publications are solely those of the individual author(s) and contributor(s) and not of MDPI and/or the editor(s). MDPI and/or the editor(s) disclaim responsibility for any injury to people or property resulting from any ideas, methods, instructions or products referred to in the content.

