Abstract
When the size of the molybdenum disulfide (MoS2) is reduced to a few nanometers, a distinctive photoluminescence is observed due to the strong effect of quantum confinement. In this study, we fabricated MoS2 quantum dots (QDs) using a simple and green process. We dissolved the powder of MoS2 in various solvents, including N-Methyl-2-pyrrolidone (NMP), ethanol (EtOH), and deionized water (DIW), and dispersed it by sonication or solvent-thermal exfoliation. The synthesized MoS2 QDs were characterized for their optical properties. Transmission electron microscopy (TEM) was used to analyze the particle size and morphology; UV-visible spectrometer and photoluminescence tests were employed to measure optical absorption, bandgaps, and optical emission. The photothermal test was designed for the evaluation of the optothermal conversion. In vitro cultures of 3T3 fibroblast cells were evaluated for the biocompatibility of the MoS2 QDs. Results from different experiments were cross-examined and analyzed to understand the relation among different syntheses, microstructures, and optical properties of MoS2 QDs. A yield of 15% MoS2 QDs was obtained when synthesized in ethanol by thermal exfoliation. They also showed satisfactory optothermal effects.
1. Introduction
Molybdenum disulfide (MoS2) is an inorganic compound that belongs to the class of transition metal dichalcogenides. Its appendages are silvery black and are the main ore of molybdenite in nature [1]. Since bulk MoS2 is a semiconductor with a narrow indirect band gap of approximately (~1.2 eV), it has been studied for photovoltaic and photocatalytic applications due to its strong absorption in the solar spectrum [2,3]. If the bulk size is reduced to a scale of dozens of nanometers, then the effects of quantum confinement dictate the electronic and optical properties of MoS2. This phenomenon has been observed in MoS2 films, nanoplates, and nanotubes [4,5].
Molybdenum disulfide (MoS2) quantum dots (QDs) are biocompatible [6] and semiconductive with high photothermal conversion efficiency [7]. Li et al. have recently shown that MoS2 flakes and ultra-small diameter MoS2 QDs can be used in the renal pathway, thereby reducing long-term toxicity in kidneys. For the synthesis of MoS2 QDs, top-down or bottom-up methods are used as available approaches. Chemical exfoliation, mechanical, electrochemical, emulsion, solvothermal, thermal ablation, and combined methods have been studied to produce MoS2 QDs effectively. Each approach has advantages and shortcomings, but a common problem is the low yields of production. This is a challenge for up-scaling industrial production of MoS2 QDs when compared to the production of carbon QDs [8].
The synthesis of MoS2 QDs by the solvent–thermal process is relatively simple. The powder of MoS2 is first dissolved in various solvents, including N-Methyl-2-pyrrolidone (NMP) and ethanol (EtOH), in deionized water (DIW). Then, either using sonication or solvent–thermal exfoliation, the MoS2 QDs are produced. For the material characterization, transmission electron microscopy (TEM) is used to examine the particle size and morphology; UV-visible spectrometer and photoluminescence tests are used to measure the optical absorption, bandgaps, and optical emission. The in vitro cell culture of 3T3 fibroblast cells is assessed for the biocompatibility of MoS2 QDs.
In this study, we used the sonification and solvent–thermal approach to investigate the synthesis of the MoS2 QDs using different solvents. The results provide a reference for further research and the efficient manufacture of MoS2 QDs.
2. Material and Method
2.1. Synthesis Method
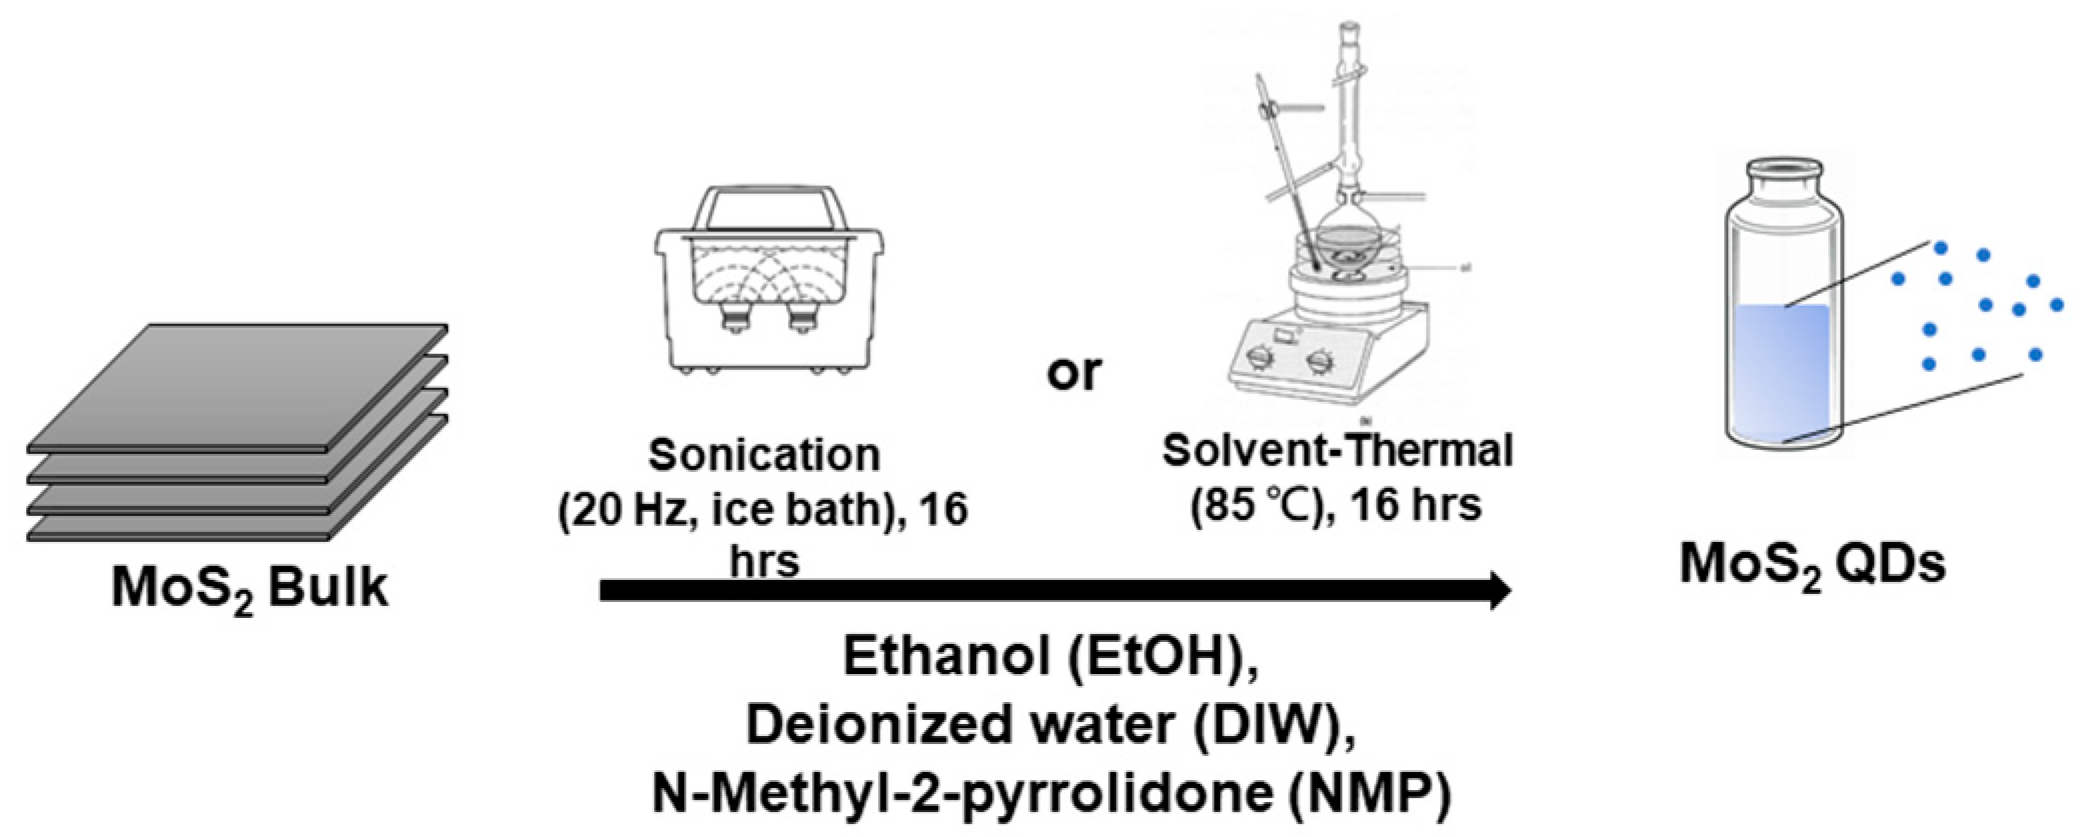
Commercially available MoS2 powders (~100–150 μm) were dispersed in ethanol (99.99%) by either ice-bath sonication (US) or solvent–thermal exfoliation (ST), as shown in Figure 1. Three solvents were used in this study: ethanol (EtOH), deionized water (DIW), and N-methyl-2-pyrrolidone (NMP). 20 mL of the solvents was used for the dispersion of MoS2 powders. Following the dispersion, the solutions were centrifuged at 10,000 rpm for 15 min to remove the remaining bulk-size MoS2. Then, the solutions were dialyzed by DIW through a dialysis membrane (molecular weight of 1 K Da) for three days to remove the excessive solvent. Finally, the dialyzed material was freeze-dried to increase its concentration.
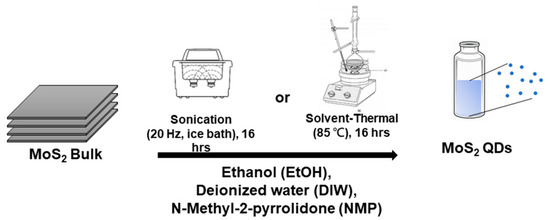
Figure 1.
The synthesis of MoS2 QDs.
2.2. Optical Characterization
The UV-VIS spectrum was measured using Biochrom Ultrospec 9000pc (Fisher Scientific Arendalsvägen Göteborg, Sweden). The range for optical absorption was between 300 and 800 nm. The Beer–Lambert law states that
where IT and I0 are the intensity of transmitted and incident laser light, ε is the molar attenuation coefficient or absorptivity of the attenuating species, ℓ is the optical path length, and c is the concentration of the attenuating species. For simplicity, we combine the last three terms into one single absorbance A:
IT = I0 e−εlc
A ≡ εlc = −ln(IT/I0)
If the attenuation of an incident beam of light within a homogeneous solution is assumed to be absorption only. A conventional scale to represent the optical absorbance in solution is log10 instead of ln, so the optical absorbance of the sample is taken as:
A = −log10(IT/I0) = (1/log10(e)) (IT/I0)
The photoluminance (PL) spectrum of MoS2 QDs was measured with a multimode microplate reader (SPARK®, TECAN, Männedorf, Switzerland). The light source of the excitation laser ranges from 300 nm to 400 nm with a resolution of 10 nm. There was a shift of 45 nm for optical emission to avoid the overlapping between the excitation and emission. The image of MoS2 QDs was examined with transmission electron microscopy (TEM) (JEM-2000EX II, JEOL, Tokyo, Japan) in magnified images obtained from ImageJ® 1.54j.
2.3. Ex-Vitro Photothermal Effect
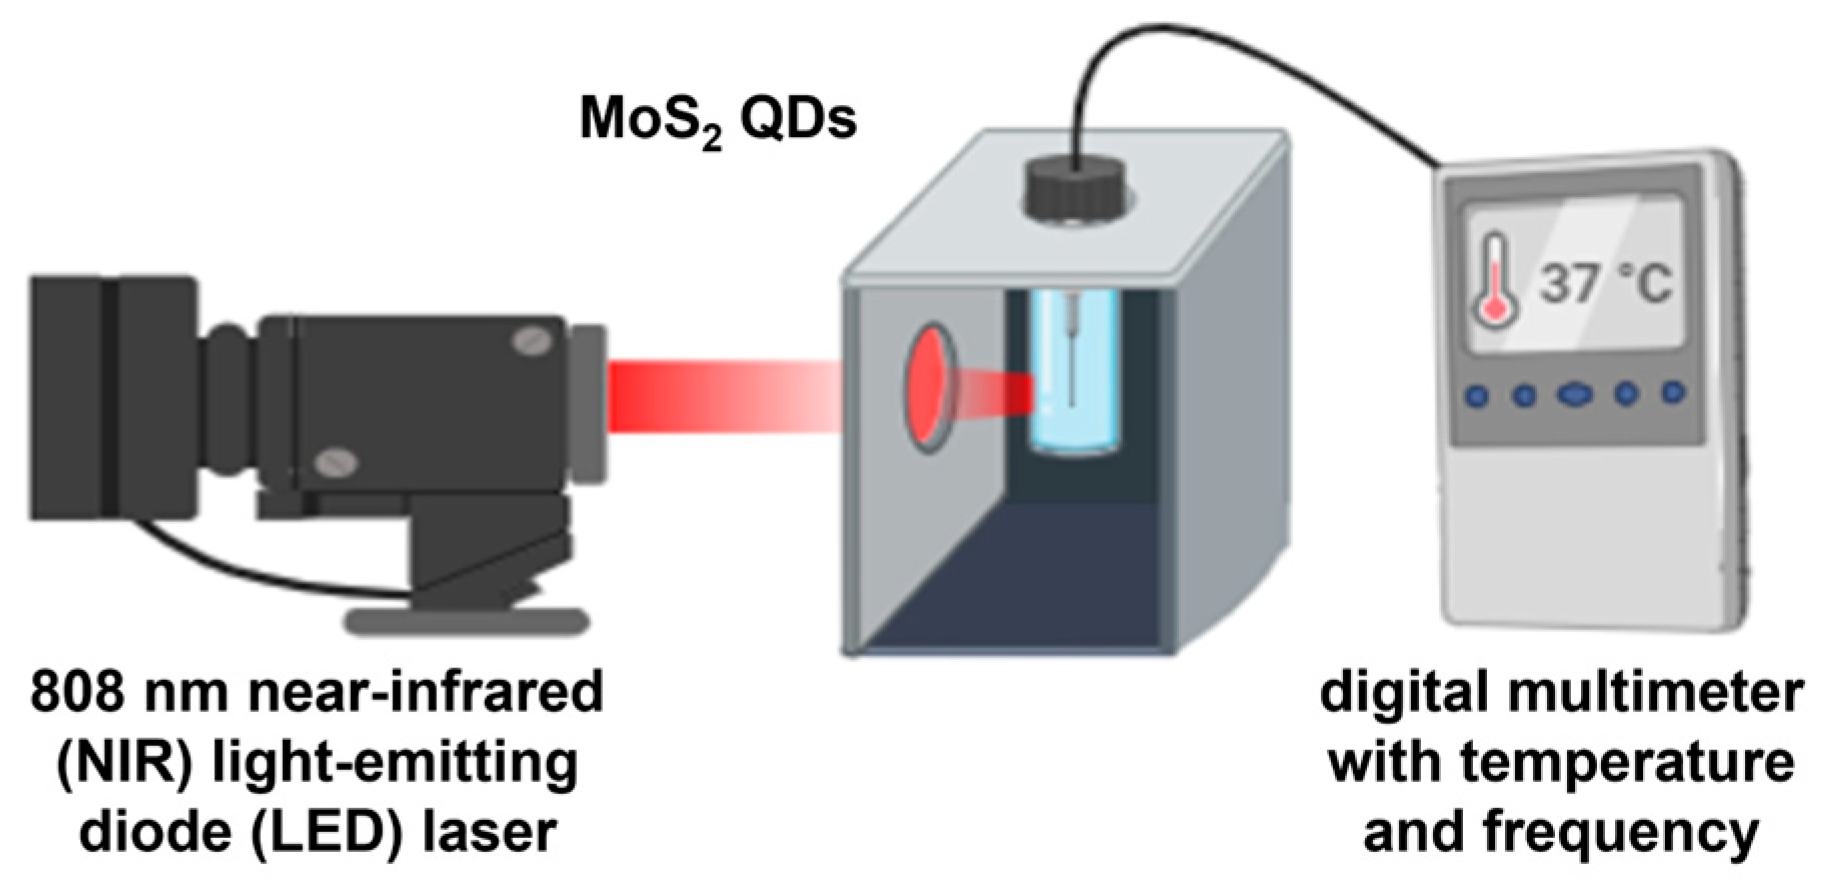
The photothermal effect of MoS2 QDs was assessed by direct irradiation using an 808 nm near-infrared (NIR) light-emitting diode (LED) laser at a distance of 20 mm. The specific near-infrared wavelength was selected considering its high transmission ratio into the human body and a range of therapeutic benefits such as reducing inflammation, pain, and increased blood flow [9,10]. The temperature variation was measured by a digital multimeter (600 V CAT III, Fluke Corporation, United States) every 15 s. The setup for the measurement is shown in Figure 2.
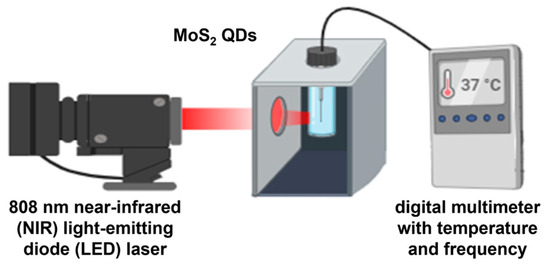
Figure 2.
Illustration of ex vitro photothermal measure of MoS2 QDs irradiated under 808 nm NIR LED laser.
2.4. In-Vitro Biocompatibility
To evaluate the biocompatibility of MoS2 QDs, we used the 3-(4,5-dimethylthiazol-2-yl)-2,5-diphenyltetrazolium bromide (MTT) assay and analyzed the viability of 3T3 fibroblast cells cultured with MoS2 QDs. 3T3 fibroblast cells were seeded in a 96-well tissue-culture plate at a density of 1 × 10⁴ cells per well in a culture medium (Dulbecco’s Modified Eagle Medium (DMEM), Gibco, New York, USA). The incubator (Thermo Forma 310, Thermo Fisher Scientific, Waltham, Massachusetts, USA) was controlled at 37 °C, a humidity of 95%, and a CO2 flow of 5%. MoS2 QDs of four different concentrations at 0.5, 0.25, 0.125, and 0.0625 mg/mL were mixed in the culture medium and tested for cell culture (testing group). The cell variability was assessed at 24 and 72 h after seeding. The MTT assay was measured by using a multimode microplate reader (SPARK®, TECAN, Männedorf, Switzerland) at the absorption peak of 560 nm. The biocompatibility was measured (n = 6) for the untreated (zero MoS2 QDs, the control group) cells as follows:
Relative Cell viability (%) = (Average of Intensity of Testing Group)/(Average of Intensity of Control Group) × 100%
3. Result
3.1. Yield of Synthesis
The yields of synthesis for MoS2 QDs by different methods are presented in Table 1. Among the three solvents, ethanol (EtOH) resulted in a higher yield of 15%, especially in the solvent–thermal method. This is attributed to the high solubility of MoS2 in ethanol (~0.1–5 mg/mL), by which a higher exfoliation rate resulted in [11,12].

Table 1.
The yield of different synthesis methods and solvents for molybdenum disulfide QDs.
3.2. Characterization
3.2.1. Particle Size and Morphology
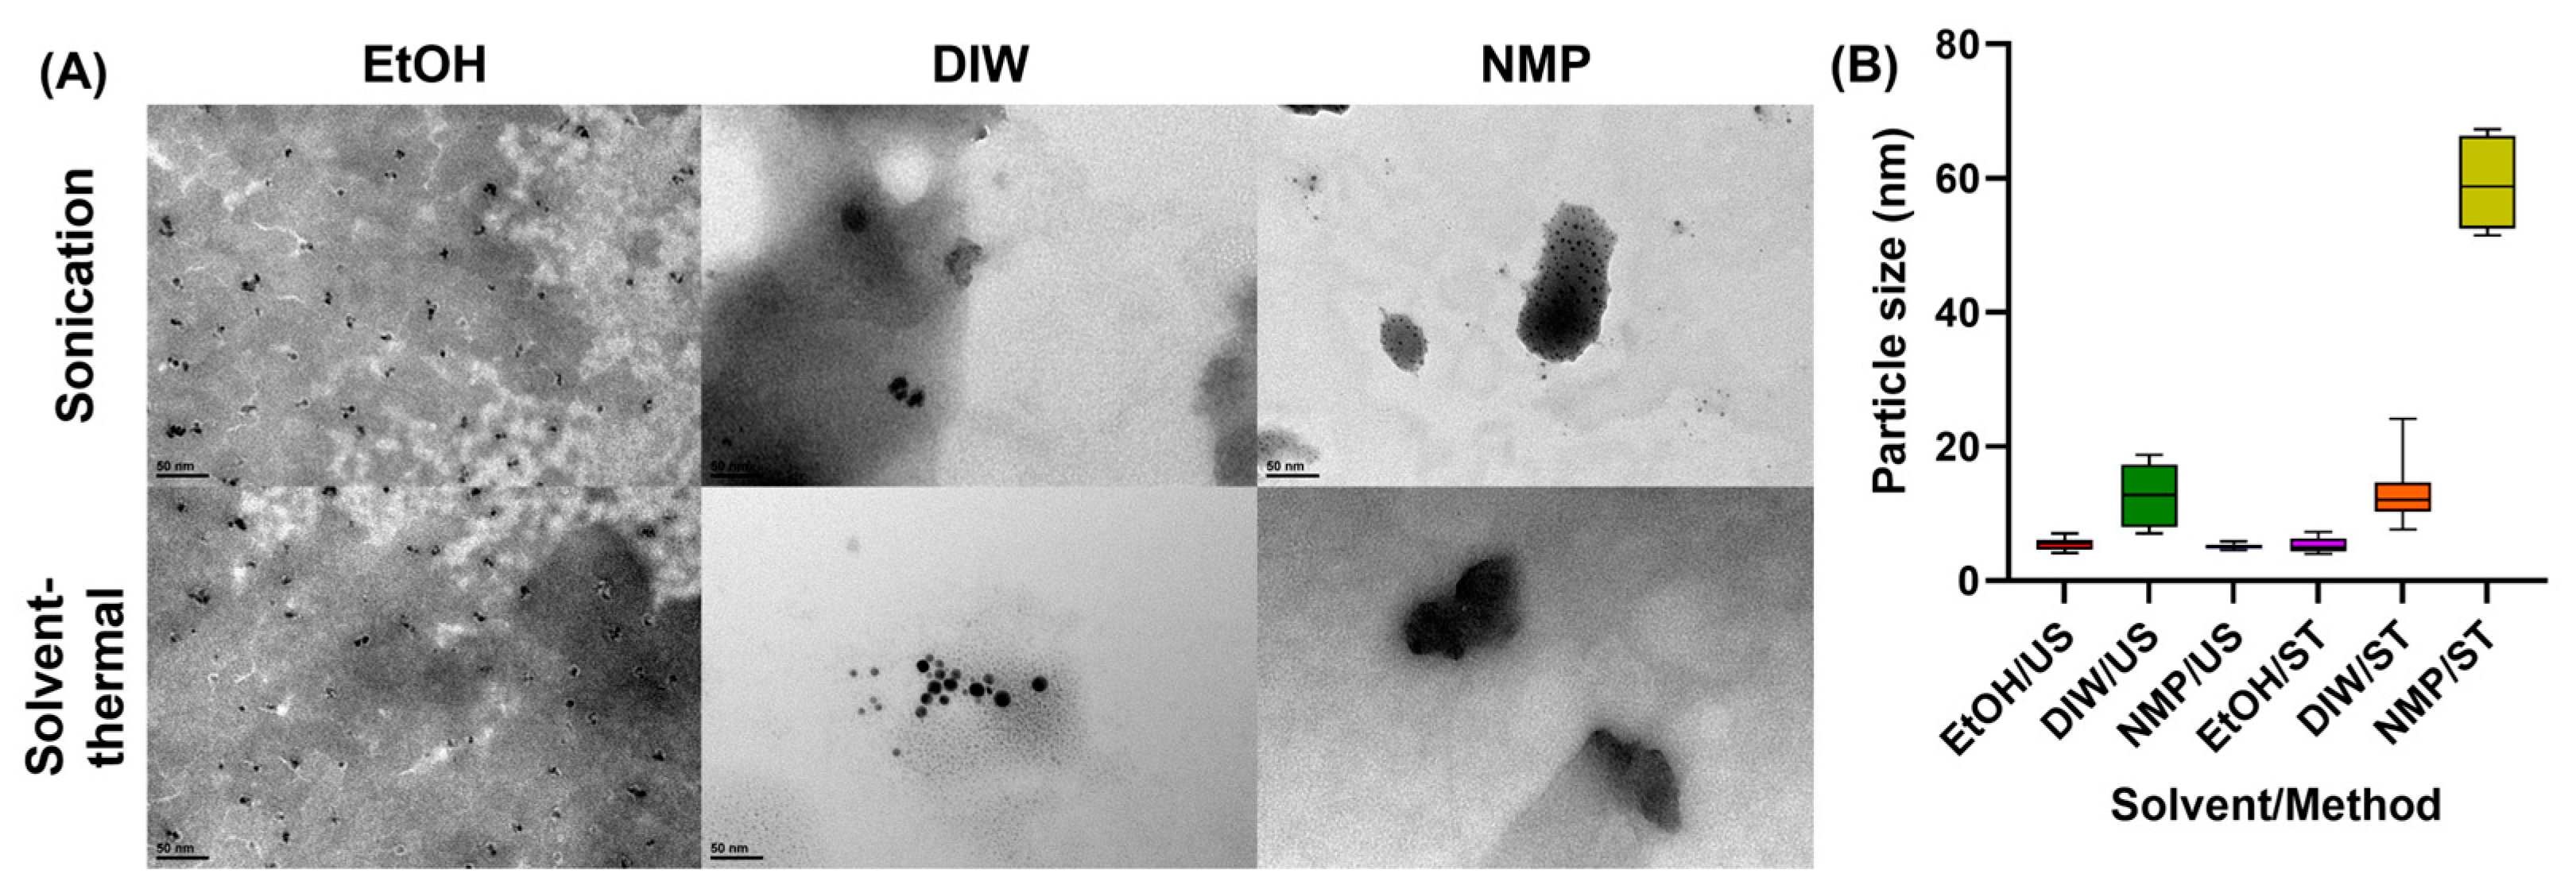
The particle size and morphology of MoS2 QDs are shown in Figure 3, where the size of the particle was analyzed by ImageJ®. Except for NMP under the solvent–thermal process, all samples showed particles of less than 20 nm. Among all solvents, ethanol effectively exfoliated bulk MoS2 to a few nanometers, whether by sonication or thermal treatment.
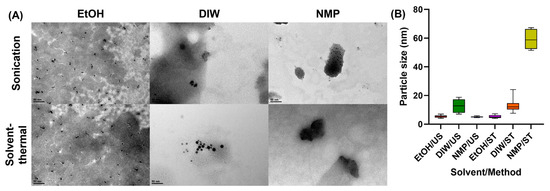
Figure 3.
(A) TEM image and (B) particle size distribution of MoS2 QDs synthesized using different methods and solvents.
3.2.2. UV-Visible Spectrum
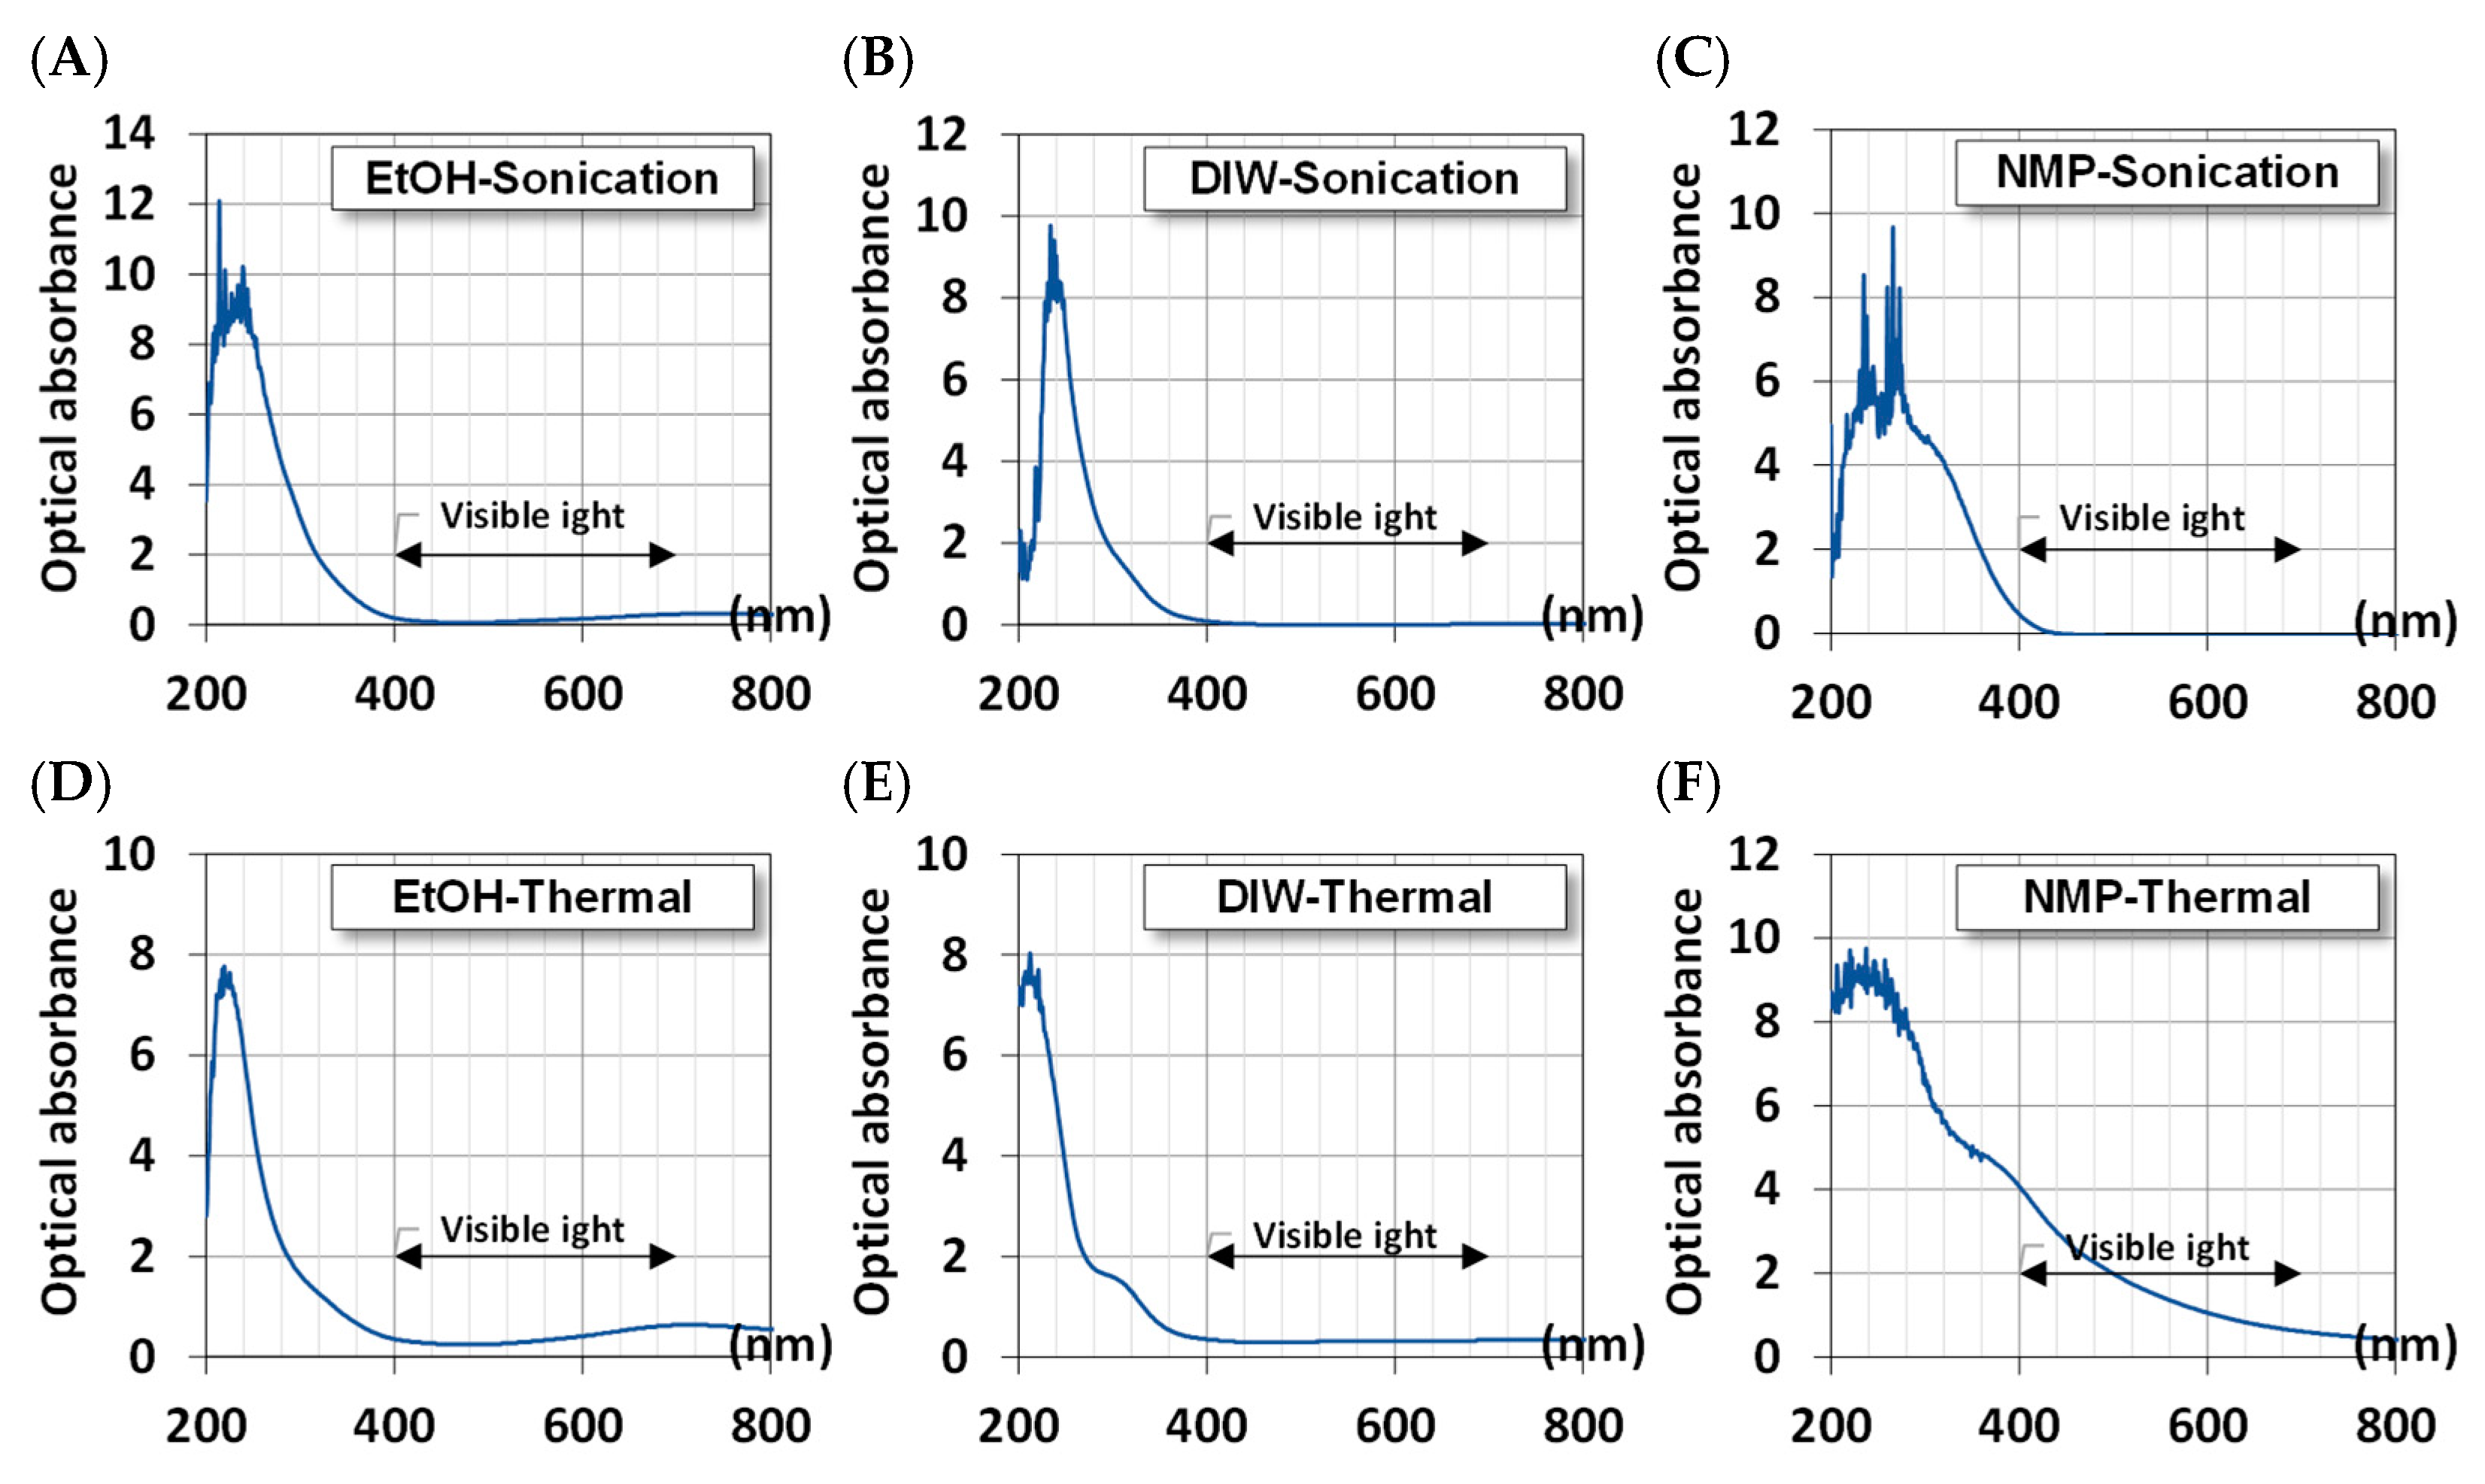
Figure 4 shows the UV-Vis spectra of MoS2 QDs. Broad absorption peaks in the UV range are common features of all samples, regardless of the method of synthesis. However, this broadband peak can be further broken down into two sub-band peaks. One shows a peak at 340 nm with the photon-induced excitons in MoS2 QDs, and the other has a peak between 220 and 300 nm due to the quasi-continuous electronic band structures by quantum confinement [13]. For samples synthesized in ethanol, another broadband peak of around 795 nm was observed (Figure 4A,D). This peak is related to the optothermal excitation. Absorbed photons at this long wavelength provide a red-shift energy release in MoS2 QDs.


Figure 4.
The UV-visible spectrum of MoS2 QDs was synthesized using different methods and solvents. Ultrasonically in (A) EtOH, (B) DIW, and (C) NMP; Thermally in (D) EtOH, (E) DIW, and (F) NMP.
3.2.3. Optical Absorbance
Given the UV-visible spectra, we estimated the absorbance of MoS2 QDs using the Beer–Lambert law and Equation (3). Figure 5 shows the calculated absorbance of QDs. All samples exhibit high optical absorbance in the range of 200–400 nm for ultraviolet light. This is the signature of nanosized crystals where the quantum effects become noticeable. However, for QDs synthesized in EtOH, there is another broadband absorption in the range of 700–900 nm, which can be the conversion of near-infrared thermal energy.
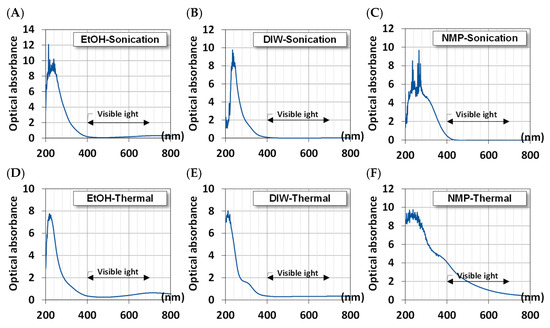
Figure 5.
The optical absorbance of synthesized MoS2 QDs using different methods and solvents. Ultrasonically in (A) EtOH, (B) DIW, and (C) NMP; Thermally in (D) EtOH, (E) DIW, and (F) NMP.
The NMP solvent presents a broad range of absorption due to the larger particle size of MoS2, as shown in Figure 3 from the TEM image.
3.2.4. Photoluminescence
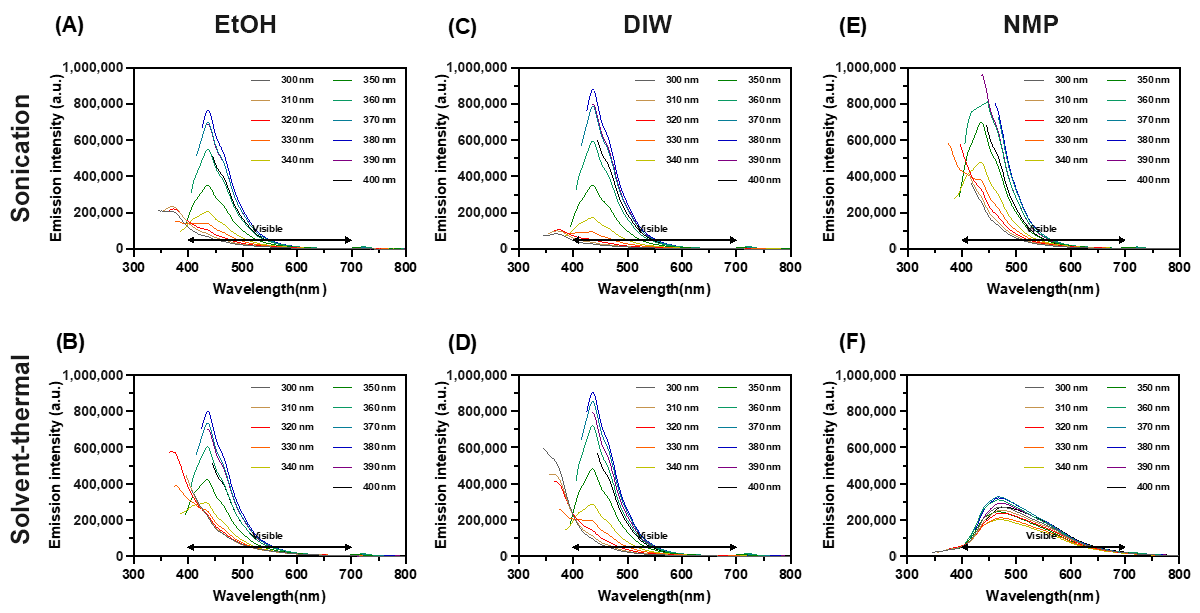
Figure 6 shows the photoluminescence of synthesized MoS2 QDs. The highest intensity of optical emission from samples was found centered around 440–450 nm when the wavelength of the excitation laser was 340 nm. Interestingly, this result did not change by the method of synthesis or solvents. In other words, resonantly excited electrons in the synthesized QDs released energy by emitting photons almost along the same relaxation pathway or changes between the same energy levels [14]. According to the location of emission peaks, this fluorescence emission redshifted at the edge of blue light. However, the emission was broadband with a shoulder between 450 and 500 nm. This indicates the excited electrons have a two-stage energy release of photons. In the NMP solvent–thermal process, a broad photoluminescence peak was observed due to a larger deviation in the particle size distribution (Figure 3). The photoluminescence ebbed as the quantum confinement weakened when particles became larger [15].
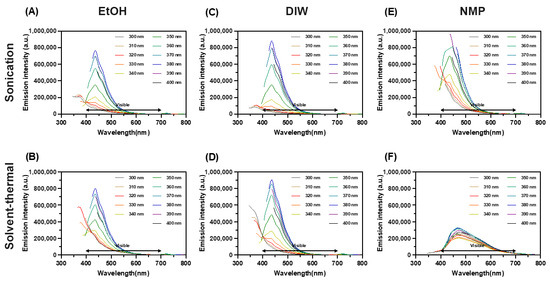
Figure 6.
The photoluminescence spectrum of synthesized MoS2 QDs using different methods and solvents as marked. Ultrasonically in (A) EtOH, (B) DIW, and (C) NMP; Thermally in (D) EtOH, (E) DIW, and (F) NMP.
The bangap of QDs can be estimated as ΔE = h(Δυ) ≈ h(C/λemission). For the peaks at 440–450 nm, the corresponding bandgap is around 2.82–2.76 eV. The energy change between excitation and emission is around ΔE = h(Δυ) ≈ h(C/λincident − C/λemission) = 0.8288 − 0.8914 eV. A freestanding monolayer MoS2 is predicted to have direct bandgaps around 1.8–2.8 eV, and the bulk MoS2 (hexagonal and rhombohedral symmetry) showed narrower indirect bandgaps around 1.2 eV [16,17,18,19,20,21]. Based on the nature of multiple bandgaps of polycrystallinity in QDs, the estimated bandgap from the photoluminescence spectra was roughly within the upper bound of the findings in the other studies.
3.3. Photothermal Effect
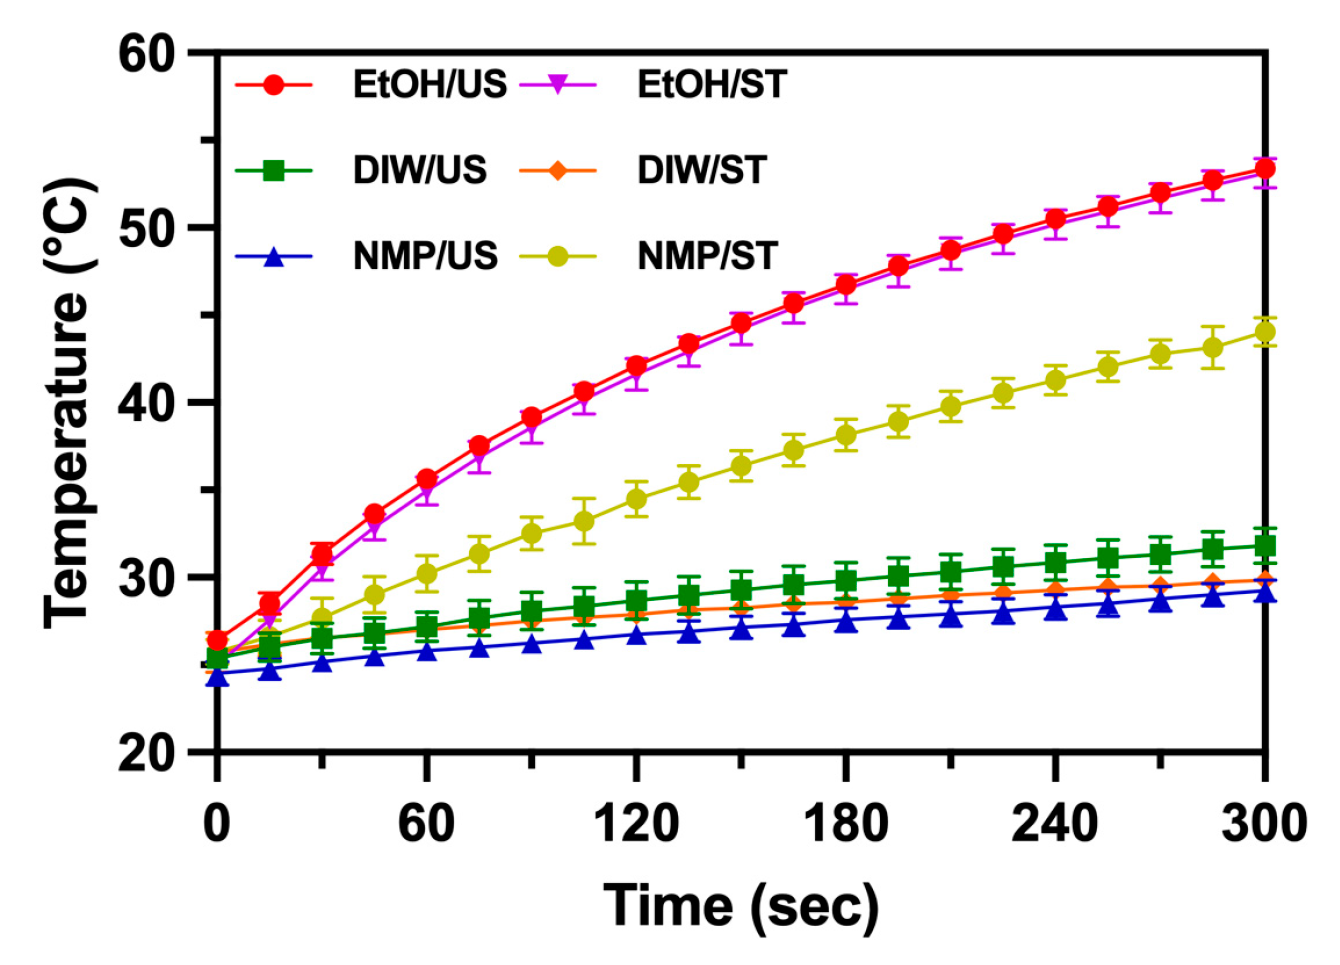
The UV-VIS absorption spectra showed the presence of a broadband peak around 795 nm. This absorption is useful for clinical treatment if properly utilized [22]. Figure 7 shows the variation of temperature when samples of MoS2 QDs were exposed to an 808 nm LED laser. MoS2 QDs synthesized in EtOH showed the temperature rise to 50 °C in 300 s. Other samples had a smaller temperature rise of around 25–30 °C in 300 s. The photothermal effect occurred due to the absorption of photons in the whole spectra, though the broadband peak had a major contribution to the effect because of the vicinity of 808 and 795 nm. At the wavelengths, the photon energy becomes more readily absorbed. MoS2 QDs synthesized in EtOH convert the energy efficiently because of their smaller size. The solvent–thermal synthesized NMP MoS2 QDs were noticed for their higher photothermal effect (temperature rise to 45 °C in 300 s). Figure 6F shows the broadband absorption that explains the enhanced photothermal conversion [23].
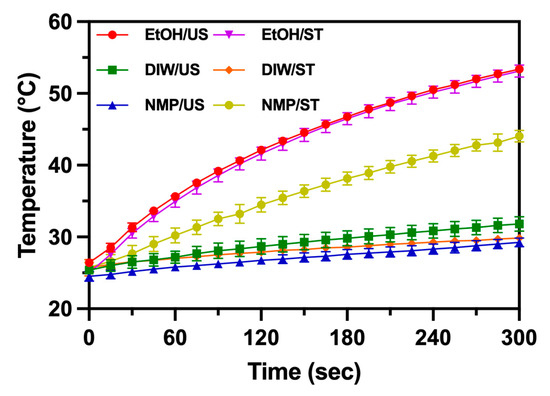
Figure 7.
The temperature variation of synthesized MoS2 QDs using different methods and solvents is marked. Samples were exposed to an 808 nm LED laser continuously.
3.4. Biocompatibility Evaluation
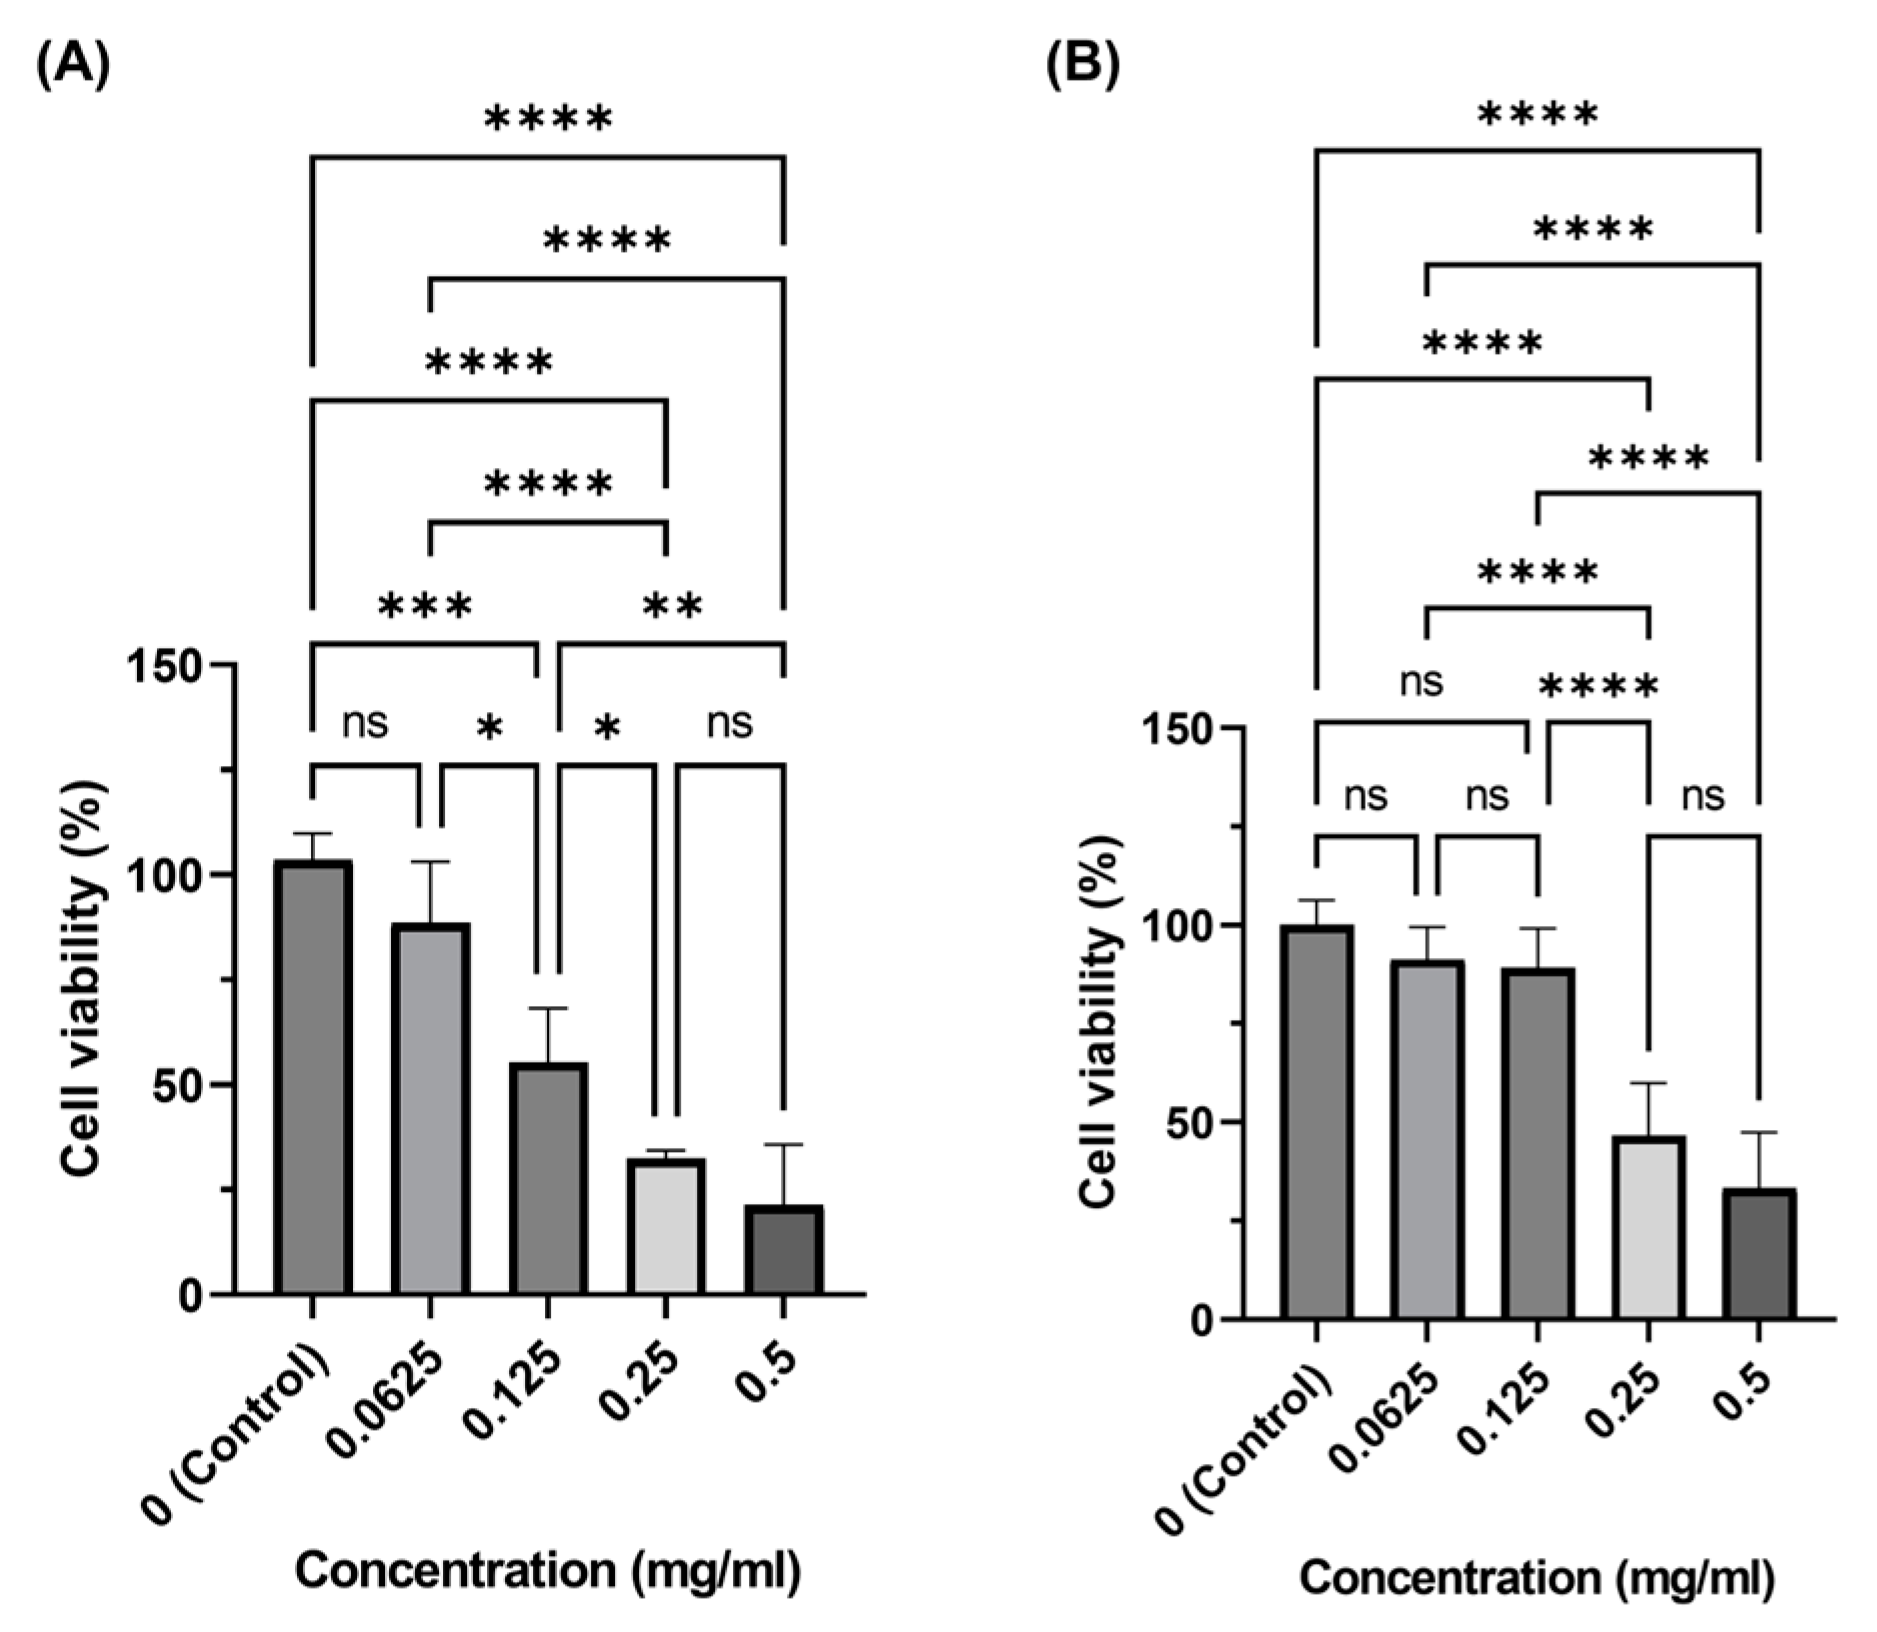
Figure 8 shows the relative cell viability for in vitro culture of 3T3 fibroblast cells. Only MoS2 QDs synthesized in the EtOH solvent–thermal process were tested in the in vitro cell culture because of their high optothermal effect. For medium mixed with MoS2 QDs, the viability was reduced as the concentration of MoS2 increased. However, the low concentration of 00625 and 0.125 mg/mL was appropriate for the treatment of cells, particularly after 72 h when cells were stabilized and started to proliferate. The relative cell viability of these two concentrations was maintained at a level above 90% in 72 h after seeding.
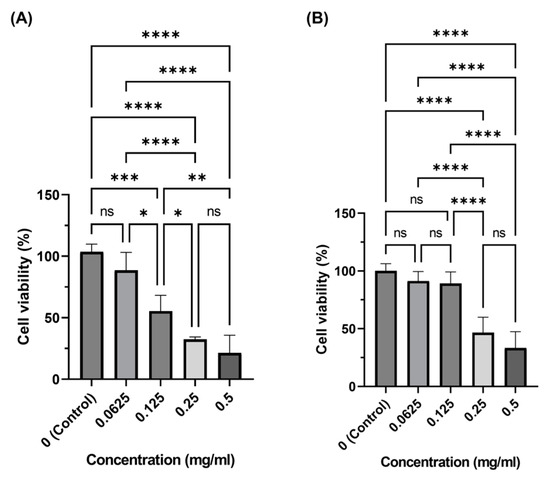
Figure 8.
The biocompatibility of EtOH/ST MoS2 QDs at (A) 24 hr and (B) 72 hr. (p-value: ****: 0.0001%, ***: 0.001%, **: 0.01%, *: 0.05%, ns: not significant).
4. Conclusions
The experimental results of this study showed the following findings: MoS2 QDs were successfully synthesized using ultrasonic and thermal exfoliation in various solvents, including EtOH, DIW, and NMP. The most effective solvent to yield MoS2 QDs was EtOH because of the high solubility of MoS2 in EtOH (~0.1–5 mg/mL), which leads to a higher exfoliation rate. The UV-visible spectra of MoS2 QDs showed a broadband absorption peak around 340 nm due to the photon-induced excitons. A smaller broadband peak around 795 nm was observed in the UV-visible spectra, related to the optothermal excitation. The photoluminescence of MoS2 QDs showed the highest emission intensity at 440–450 nm with the excitation laser of 340 nm. This fluorescence emission was redshifted and broadband at the edge of blue light. Temperature variation in the photothermal test under an 808 nm LED laser showed that MoS2 QDs synthesized in EtOH had the temperature rise to 50 °C in 300 s. Other samples had a smaller temperature rise of around 25–30 °C in 300 s. The result of in vitro 3T3 fibroblast cell culture indicated that low concentrations (0.0625 and 0.125 mg/mL) of MoS2 QDs in the EtOH solvent–thermal process were appropriate for maintaining cell viability.
Author Contributions
Conceptualization, H.-P.Y. and C.-J.W.; methodology, H.-P.Y., C.-J.W. and C.-Y.L.; validation, H.-P.Y.; formal analysis, H.-P.Y.; investigation, C.-J.W.; resources, H.-P.Y.; data curation, C.L. and C.-Y.L.; writing—original draft preparation, review, and editing, H.-P.Y., C.L. and C.-Y.L.; visualization, H.-P.Y.; supervision, C.L. and C.-Y.L.; project administration, C.-Y.L. and C.L.; funding acquisition, C.-Y.L. and C.L. All authors have read and agreed to the published version of the manuscript.
Funding
The funding was funded by Taoyuan General Hospital, the Ministry of Health and Welfare (PTH113060), the Nation Science and Technology Council (NSTC 112-2622-E-A49-017), and the Joint Developed Project of Taiwan Semiconductor Research Institute (JDP113-Y1-093).
Institutional Review Board Statement
Not applicable.
Informed Consent Statement
Not applicable.
Data Availability Statement
The raw data supporting the conclusions of this article will be made available by the authors upon request.
Acknowledgments
This work was supported by the Electron Microscopy Facility at National Yang Ming Chiao Tung University and the Center for Plasma and Thin Film Technologies at the Ming Chi University of Technology.
Conflicts of Interest
Author C. Y. Lee is an adjunct professor in the Department of Biomedical Engineering and also an M.D. of Radiology at Taoyuan General Hospital. There are no conflicts of interest for his role in this study. The remaining authors declare that the research was conducted in the absence of any commercial or financial relationships that could be construed as a potential conflict of interest.
References
- Mitchell, P.C.H.; Outteridge, T.; Kloska, K.; McMahon, S.; Epshteyn, Y.; Roger, F.S.; Burkin, A.R.; Dorfler, R.R.; Laferty, J.M.; Leichtfried, G.; et al. Molybdenum and Molybdenum Compounds. Ullmann’s Encycl. Ind. Chem. 2020, 1–63. [Google Scholar] [CrossRef]
- Splendiani, A.; Sun, L.; Zhang, Y.; Li, T.; Kim, J.; Chim, C.Y.; Galli, G.; Wang, F. Emerging Photoluminescence in Monolayer MoS2. Nano Lett. 2010, 10, 1271–1275. [Google Scholar] [CrossRef] [PubMed]
- Wu, F.Y.; Cheng, Y.S.; Wang, D.M.; Li, M.L.; Lu, W.S.; Xu, X.Y.; Zhou, X.H.; Wei, X.W. Nitrogen-Doped MoS2 QDs: Facile Synthesis and Application for the Assay of Hematin in Human Blood. Mater. Sci. Eng. C 2020, 112, 110898. [Google Scholar] [CrossRef]
- Jiang, J.; Chen, Z.; Hu, Y.; Xiang, Y.; Zhang, L.; Wang, Y.; Wang, G.C.; Shi, J. Flexo-Photovoltaic Effect in MoS2. Nat Nanotechnol 2021, 16, 894–901. [Google Scholar] [CrossRef] [PubMed]
- Guo, Y.; Li, J. MoS2 QDs: Synthesis, Properties and Biological Applications. Mater. Sci. Eng. C 2020, 109, 110511. [Google Scholar] [CrossRef]
- Chen, X.; Park, Y.J.; Kang, M.; Kang, S.K.; Koo, J.; Shinde, S.M.; Shin, J.; Jeon, S.; Park, G.; Yan, Y.; et al. CVD-Grown Monolayer MoS2 in Bioabsorbable Electronics and Biosensors. Nat. Commun. 2018, 9, 1690. [Google Scholar] [CrossRef]
- Gan, X.; Zhao, H.; Quan, X. Two-Dimensional MoS2: A Promising Building Block for Biosensors. Biosens. Bioelectron. 2017, 89, 56–71. [Google Scholar] [CrossRef]
- Guo, Y.; Zhang, L.; Zhang, S.; Yang, Y.; Chen, X.; Zhang, M. Fluorescent Carbon Nanoparticles for the Fluorescent Detection of Metal Ions. Biosens. Bioelectron. 2015, 63, 61–71. [Google Scholar] [CrossRef]
- Museux, N.; Perez, L.; Autrique, L.; Agay, D. Skin Burns after Laser Exposure: Histological Analysis and Predictive Simulation. Burns 2012, 38, 658–667. [Google Scholar] [CrossRef]
- Svobodova, B.; Kloudova, A.; Ruzicka, J.; Kajtmanova, L.; Navratil, L.; Sedlacek, R.; Suchy, T.; Jhanwar-Uniyal, M.; Jendelova, P.; Machova Urdzikova, L. The Effect of 808 nm and 905 nm Wavelength Light on Recovery after Spinal Cord Injury. Sci. Rep. 2019, 9, 7660. [Google Scholar] [CrossRef]
- Huang, H.; Liu, N.; Wang, X.; Zhong, M.; Huang, X. Application of Hydrothermal and Solvothermal Method in Synthesis of MoS2. Mater. Plast. 2022, 59, 26–35. [Google Scholar] [CrossRef]
- Li, Z.; Fan, R.; Hu, Z.; Li, W.; Zhou, H.; Kang, S.; Zhang, Y.; Zhang, H.; Wang, G. Ethanol introduced synthesis of ultrastable 1T-MoS2 for removal of Cr (VI). J. Hazard. Mater. 2020, 394, 122525. [Google Scholar] [CrossRef]
- Chikan, V.; Kelley, D.F. Size-Dependent Spectroscopy of MoS2 Nanoclusters. J. Phys. Chem. B 2002, 106, 3794–3804. [Google Scholar] [CrossRef]
- Kira, M.; Jahnke, F.; Koch, S.W. Quantum Theory of Secondary Emission in Optically Excited Semiconductor Quantum Wells. Phys. Rev. Lett. 1999, 82, 3544–3547. [Google Scholar] [CrossRef]
- Hari Krishna, P.; Ramrakhiani, M. Nano Particle Size Effect on Photo-Luminescence. Int. J. Nanotechnol. Appl. 2010, 4, 13–19. [Google Scholar] [CrossRef]
- Cao, H.; Wang, H.; Huang, Y.; Sun, Y.; Shi, S.; Tang, M. Quantification of Gold(III) in Solution and with a Test Stripe via the Quenching of the Fluorescence of Molybdenum Disulfide QDs. Microchim. Acta 2017, 184, 91–100. [Google Scholar] [CrossRef]
- Ryou, J.; Kim, Y.S.; Kc, S.; Cho, K. Monolayer MoS2 Bandgap Modulation by Dielectric Environments and Tunable Bandgap Transistors. Sci. Rep. 2016, 6, 29184. [Google Scholar] [CrossRef]
- Kobayashi, K.; Yamauchi, J. Electronic structure and scanning-tunneling-microscopy image of molybdenum dichalcogenide surfaces. Phys. Rev. B 1995, 51, 17085–17095. [Google Scholar] [CrossRef] [PubMed]
- Yun, W.S.; Han, S.W.; Hong, S.C.; Kim, I.G.; Lee, J.D. Thickness and strain effects on electronic structures of transition metal dichalcogenides: 2H-MX2 semiconductors (M = Mo, W; X = S, Se, Te). Phys. Rev. B 2012, 85, 033305. [Google Scholar] [CrossRef]
- Cheiwchanchamnangij, T.; Lambrecht, W.R.L. Quasiparticle band structure calculation of monolayer, bilayer, and bulk MoS2. Phys. Rev. B 2012, 85, 205302. [Google Scholar] [CrossRef]
- Qiu, D.Y.; da Jornada, F.H.; Louie, S.G. Optical spectrum of MoS2: Many-body effects and diversity of exciton states. Phys. Rev. Lett. 2013, 111, 216805. [Google Scholar] [CrossRef] [PubMed]
- Wu, X.; Suo, Y.; Shi, H.; Liu, R.; Wu, F.; Wang, T.; Ma, L.; Liu, H.; Cheng, Z. Deep-Tissue Photothermal Therapy Using Laser Illumination at NIR-IIa Window. Nanomicro Lett. 2020, 12, 38. [Google Scholar] [CrossRef] [PubMed]
- Jiang, Q.; Zeng, W.; Zhang, C.; Meng, Z.; Wu, J.; Zhu, Q.; Wu, D.; Zhu, H. Broadband Absorption and Enhanced Photothermal Conversion Property of Octopod-like Ag@Ag2S Core@shell Structures with Gradually Varying Shell Thickness. Sci. Rep. 2017, 7, 17782. [Google Scholar] [CrossRef] [PubMed]
Disclaimer/Publisher’s Note: The statements, opinions and data contained in all publications are solely those of the individual author(s) and contributor(s) and not of MDPI and/or the editor(s). MDPI and/or the editor(s) disclaim responsibility for any injury to people or property resulting from any ideas, methods, instructions or products referred to in the content. |
© 2024 by the authors. Licensee MDPI, Basel, Switzerland. This article is an open access article distributed under the terms and conditions of the Creative Commons Attribution (CC BY) license (https://creativecommons.org/licenses/by/4.0/).

