Abstract
Manufacturing is critical to the global economy and is a key sector of businesses in today’s world. The pressures of manufacturing mean that companies are often fighting to survive instead of investing in new technologies and factories in order to implement novel equipment that utilises industry 4.0 technology. This is particularly relevant for many SMEs who need solutions that can provide large benefits to their efficiency without requiring a large financial and/or time investment. The data that machinery produces is an often neglected vital resource that could hold the key to solving this problem, especially if this can be analysed in conjunction with production information. By using novel techniques, new discoveries that provide a wealth of knowledge and give a deeper understanding can be learnt. This allows for more informed decisions to be made and new hypotheses to be tested. This will lead to overall increases in process efficiency whilst still being cost and time effective. This paper will explore and propose examples of how visual analytics can be used to optimise manufacturing processes. The potential impact of analysing data, such as part quality, machine downtime and component life in conjunction, is discussed.
1. Introduction
The constraint of manufacturing requires that companies’ goods are made cheaper, faster, or produced in increased quantities. Manufacturing is a vital part of the local economy, with the Office for National Statistics (ONS) stating that, within the UK, there are 133,000 manufacturers that contribute GBP 6.7 tn to the global economy [1]. Successful manufacturing demands that companies continuously improve their efficiency; however, this can be difficult for SMEs to implement due to the burden this places onto them financially, as well as the load it puts on their workforce. Factories of the future are built from the ground up to implement new Industry 4.0 technologies, but little attention is currently being paid to how existing SMEs can incorporate these technologies in an easy and effective way.
An area of manufacturing that is not widely noted to be an area regarding improving efficiency is downtime. Machine downtime results in both the loss of time and an increase in company spending, with OneServe estimating that downtime costs British manufacturing GBP 180 bn per year [1]. Downtime can be attributed to two main areas, planned and unplanned, which can also be referred to as corrective and preventative. Planned downtime can then be segregated into predetermined, e.g., daily checks and condition-based maintenance (CBM), where machine data and prescriptive analysis is used to determine the relationship between key data values and when faults are likely to occur. In many cases, this planned maintenance is done at arbitrary intervals instead of being driven by the data. Through effective utilisation of the data already being produced, the optimum point for planned maintenance can be established, reducing downtime and increasing process efficiency.
2. Data Analytics
Data are a high value resource that can provide previously undiscovered insights into the manufacturing process as well as identify key process parameters. The amount of data being produced is rapidly increasing each year. It is therefore vital that this large amount of data is collected accurately in order to be able to draw useful conclusions with valuable benefits. Data exists in various forms, such as numerical, text and video. Unique methods of analysis must be used that allow this to be examined quickly and efficiently. One method of this is through the use of visual analytics.
3. Visual Analytics
Visual analytics utilises visualisations with interactive analysis to aid understanding, reasoning and decision making for large, diverse, and complex datasets [2]. Visual analytics aims to do this by first analysing to show important information. This can then be zoomed into and filtered to allow for further analysis, a process referred to as details on demand [3]. Using a combination of statistical graphics, analysis, animation and interaction, the aim is to enable users to explore and understand their data and allow them to form hypotheses by optimising the cognitive process [4].
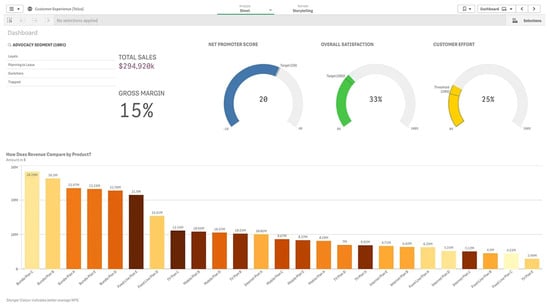
A dashboard is a visual tool that is designed to convey key information in a concise manner on a single screen that can be quickly interpreted by the user or “at a glance”. Figure 1 shows an example of a dashboard showing revenue for a company. Dashboards first appeared in the early 1990s, having been of interest to researchers by providing a means of summarising important information and visualising it with graphical components such as charts, graphs, diagrams, and maps.

Figure 1.
Dashboard showing company sales [5].
4. Case Study
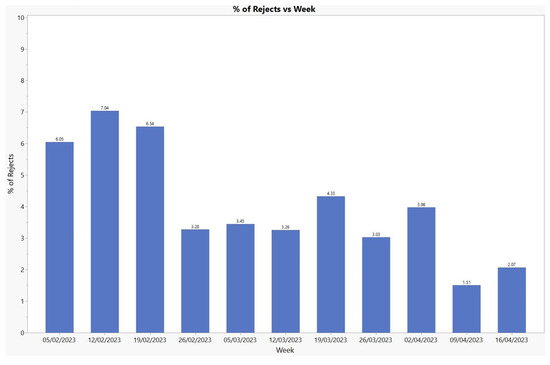
In order to validate the use of visual analytics as a method of reducing downtime, a case study is being performed. Currently a high pressure die casting company (HPDC) services their dies at arbitrary intervals and did not record the life of their components. HPDC is a highly complex process that contains many parameters and machinery that is difficult to maintain efficiently. It would therefore be an ideal candidate for implementing novel data analytic techniques. The company is now recording their downtime, process parameters and service history digitally; previously this was done either manually or not recorded at all. It is therefore now possible to analyse key values in the process, such as the reject percentage (Figure 2), in tandem with the downtime and the component life, allowing for new discoveries to be made.

Figure 2.
Bar chart of reject rates for a product by week.
With the aid of a visual analytics dashboard, this information can be easily presented to the maintenance department, allowing them to make more informed decisions in regard to servicing instead of the previous arbitrary method. Using the dashboard now, the optimum service schedule can be calculated considering the various key pieces of data that were not considered before, such as the downtime, component expected life and the reject rate. This should allow the time between services to be increased, as the process can take between 160–200 h. This provides a large amount of time and cost saving to the company, with very little financial investment.
5. Conclusions
Visual analytics is a powerful tool that, when used correctly, can be used to optimise the manufacturing process for little financial cost. It allows various forms of data to be presented, allowing for more informed decisions to be made and new trials to be conducted in order to improve process efficiency.
Author Contributions
Conceptualisation, D.S. and A.L.; methodology, D.S., A.L. and A.J.; software, A.L. and A.J.; validation, D.S., A.L. and A.J.; formal analysis, A.J.; investigation, A.J.; resources, D.S. and A.L.; data curation, A.L.; writing—original draft preparation, A.J.; writing—review and editing, D.S. and A.L.; visualisation, A.L. and A.J.; supervision, D.S. and A.L. project administration, D.S. and A.L. funding acquisition, D.S. and A.L. All authors have read and agreed to the published version of the manuscript.
Funding
This research was funded by InvestNI, grant number 1911/13179868.
Institutional Review Board Statement
Not applicable.
Informed Consent Statement
Not applicable.
Data Availability Statement
Restrictions apply to the availability of these data. Data were obtained from Ryobi, Inc. (Carrickfergus, Northern Ireland, UK) and are available d.soban@qub.ac.uk with the permission of Ryobi, Inc.
Conflicts of Interest
The authors declare no conflicts of interest.
References
- Williamson, J. Downtime Costs UK Manufacturers £180bn a Year. The Manufacturer, 17 October 2017. Available online: https://www.themanufacturer.com/articles/machine-downtime-costs-uk-manufacturers-180bn-year/ (accessed on 3 March 2023).
- Keim, D.; Kohlhammer, J.; Ellis, G.; Mansmann, F. Mastering the Information Age: Solving Problems with Visual Analytics; Eurographics Association: Bad Langensalza, Germany, 2010. [Google Scholar]
- Keim, D. Scaling Visual Analytics to Very Large Data Sets. In Proceedings of the Workshop on Visual Analytics, Darmstadt, Germany, 4 June 2005. [Google Scholar]
- Maciejewski, R. Data Representations, Transformations, and Statistics for Visual Reasoning; Springer: Cham, Switzerland, 2011; pp. 1–85. [Google Scholar] [CrossRef]
- Qlik, Visual Analytics. Qlik. Available online: https://www.qlik.com/us/data-visualization/visual-analytics (accessed on 30 May 2023).
Disclaimer/Publisher’s Note: The statements, opinions and data contained in all publications are solely those of the individual author(s) and contributor(s) and not of MDPI and/or the editor(s). MDPI and/or the editor(s) disclaim responsibility for any injury to people or property resulting from any ideas, methods, instructions or products referred to in the content. |
© 2024 by the authors. Licensee MDPI, Basel, Switzerland. This article is an open access article distributed under the terms and conditions of the Creative Commons Attribution (CC BY) license (https://creativecommons.org/licenses/by/4.0/).