Abstract
In the age of digitalization and Industry 4.0, the novel use of sensor technology is enabling much greater insight into manufacturing processes and presents new opportunities for more efficient process chains. For example, the use of sound measurement and low-cost microphones to infer the quality/integrity of part quality can be more widely applied in production. Specifically, this paper investigates the suitability of Acoustic Resonance Testing (ART) for quality detection considering the detection of cracks/defects in metal plates and joints. A methodology involving a combination of finite element analysis (FEA) and experimental tests was developed and results demonstrate that ART has the potential for defect detection with modest- to low-cost measurement hardware.
1. Introduction
It is well known that the evaluation of eigenfrequencies and eigenmodes can be used to validate the quality of parts [1,2]. However, it is often unclear what the sensitivity is for the component’s shape and features relative to the sensitivity to the defect. Therefore, this research was set out to examine in a methodological manner the sensitivity to geometry and features as well as sensitivity to artificially generated defects. Specifically, this work investigated how the eigenfrequencies and eigenmodes behave when the external geometry of laser-cut metal plates is altered, or artificial cracks are added to these plates with Wire Electrical Discharge Machining (WEDM). By doing this, it can be said with certainty what kind of cracks (position and depth) can be detected using ART when a standard manufacturing tolerance of the laser cutting process is considered.
It is also well known that eigenfrequencies and eigenmodes can be determined by modelling in FEA [3,4]. This enables sensitivity analyses for external geometry changes, different crack positions and depths to be carried out. With the help of this data, it can be determined which eigenfrequencies or eigenmodes show the greatest potential for the detection of certain defects and cracks.
Furthermore, by comparing simulation data and experimental data, it is possible to determine which measurement methods are suitable for determining which eigenfrequencies and which correction factors must be applied [5,6].
2. Methods
If the metal plates are simplified with a mass–spring system with one degree of freedom, the eigenfrequency can be determined with Equation (1).
where ω is the eigenfrequency, k is the stiffness, and m is the mass of the system.
Geometric deviations influence the mass, and cracks influence the stiffness of the metal plates. In order to be able to determine defective parts with certainty, the influence of these two factors must be checked in a sensitivity analysis.
2.1. Sensitivity Analysis in FEA
FEA enables the influence of multiple crack positions and crack depth variations to be examined. In addition, by systematically varying the defect position and types, a multidimensional view can be presented to the user. This ‘heat map’ could show the influences of the defect positions on the different eigenmodes and provide a more informed result that allows for a fine tuning of the ART measurement system for quality control.
2.2. Experimental Approach
Laser-cut metal plates were designed and manufactured to carry out the experimental ART. These test specimens included plates with the desired dimensions and plates that had geometric deviations of ±0.3 mm in length and width. Subsequently, some of the panels with the desired dimensions were provided with artificial cracks of depths of 0.25 mm, 0.5 mm, 1 mm, and 2 mm by the WEDM process (see Figure 1).
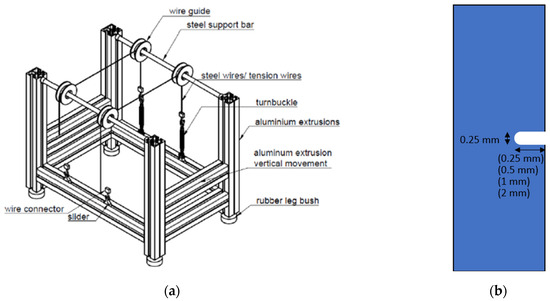
Figure 1.
Experimental equipment: (a) test rig used for experimental approach; (b) schematic of the test plate with a defect.
For the experimental determination of the eigenfrequencies, the test bodies were excited to free vibration. A specialist test rig was designed and developed as shown in Figure 1. Two different support approaches were tested and compared, whereby, the parts were either suspended, or they were supported on two steel wires (see Figure 1). The emitted sound was recorded with a microphone (Audiomoth, Openacousticdevices, UK) The audio file was then subjected to a Frequency Domain Analysis (Fourier Transformation) to extract the eigenfrequencies.
3. Results
The different eigenmodes or eigenfrequencies have different sensitivities with respect to the different parameters. In Figure 2, only the seventh eigenmode is considered and shown as an illustration of the approach used.
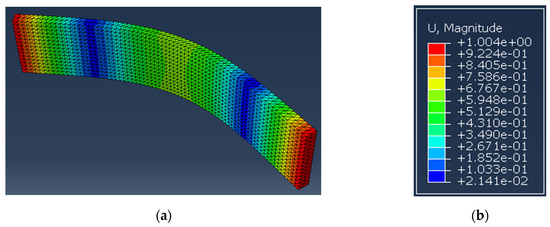
Figure 2.
Simulation results: (a) seventh eigenmode of the plate in FEA; (b) corresponding magnitude scale.
3.1. Sensitivity of Geometric Variations in FEA
In the seventh eigenmode, changes in length are strongly visible, while changes in width are not. In other eigenmodes, changes in width are more visible than changes in length.
3.2. Sensitivity of Crack Depth in FEA
The seventh eigenmode shown below demonstrated the variation in sensitivity with crack depth (see Figure 3).
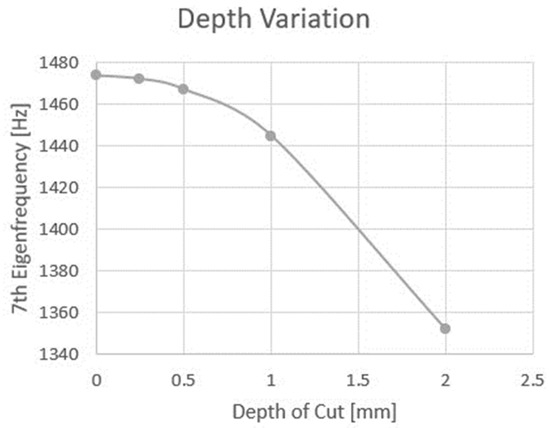
Figure 3.
Depth variation for the centre, wide crack in the seventh eigenmode.
3.3. ‘Heat Map’ of Defect Position in FEA
With regard to the defect position of the centre, wide crack, the seventh eigenmode has different sensitivity zones. By systematically moving the crack along the X-axis of the part, these sensitivity zones can be determined. Work is currently underway to develop a method of displaying this phenomenon.
3.4. Numerical and Experimental Results
The seventh eigenfrequency of the defect-free component was simulated and then measured experimentally in the two configurations of work holding. The different values are shown in Table 1 where there is broad alignment and further testing, and investigation work is ongoing.

Table 1.
Eigenfrequencies for seventh eigenmode.
4. Discussion
ART offers the possibility to detect defects, but parameters such as manufacturing deviations, crack depth and crack position as well as differences between simulated and experimentally determined results have to be considered. These influencing parameters may limit the spectrum of defect positions and defect depths that can be determined with ART.
Author Contributions
Conceptualization, G.E.O.; methodology, G.E.O.; software, N.B. and N.L.; validation, N.B., J.K. and N.L.; formal analysis, G.E.O.; investigation, N.B., N.L. and J.K.; resources, N.B.; writing—original draft preparation, N.B.; writing—review and editing, N.B. and G.E.O.; visualization, N.B. and N.L.; supervision, G.E.O.; project administration, G.E.O. All authors have read and agreed to the published version of the manuscript.
Funding
This research received no external funding.
Institutional Review Board Statement
Not applicable for this research work.
Informed Consent Statement
Not applicable.
Data Availability Statement
Data are contained with the article.
Acknowledgments
This work has been supported in part by Enterprise Ireland and European Commission under the Horizon 2020 Marie Skłodowska-Curie Actions.
Conflicts of Interest
The authors declare no conflicts of interest. The funders had no role in the design of the study; in the collection, analyses, or interpretation of data; in the writing of the manuscript, or in the decision to publish the results.
References
- Schwarz, J.J.; Rhodes, G.W. Resonance Inspection for Quality Control. In Review of Progress in Quantitative Nondestructive Evaluation; Thompson, D.O., Chimenti, D.E., Eds.; Plenum Press: New York, NY, USA, 1996; Volume 15, pp. 2265–2271. [Google Scholar] [CrossRef][Green Version]
- DGZfP-Richtlinie US 6. Akustische Resonanzverfahren zur Zerstörungsfreien Prüfung: Prinzip, Vorgehensweise, Merkmale, Validierung; Deutsche Gesellschaft für Zerstörungsfreie Prüfung e.V.: Berlin, Germany, 2009; ISBN 978-3-940283-23-8. [Google Scholar]
- Lai, C.; Sun, X.; Dasch, C.; Harmon, G.; Jones, M. Quantify Resonance Inspection with Finite Element-Based Modal Analyses. J. Vib. Acoust. 2011, 133, 031004. [Google Scholar] [CrossRef]
- Hertlin, I. Acoustic Resonance Analysis Using FEM and Laser Scanning For Defect Characterization in In-Process NDT. In Proceedings of the 9th European Conference on Non-Destructive Testing (ECNDT), Berlin, Germany, 25–29 September 2006. [Google Scholar]
- Heinrich, M.; Rabe, U.; Valeske, B. Simulation-based generation and valid training data for acoustic resonance testing. Appl. Sci. 2020, 10, 6059. [Google Scholar] [CrossRef]
- Heinrich, M.; Valeske, B.; Rabe, U. Efficient detection of defective parts with acoustic resonance testing using synthetic training data. Appl. Sci. 2022, 12, 7648. [Google Scholar] [CrossRef]


Disclaimer/Publisher’s Note: The statements, opinions and data contained in all publications are solely those of the individual author(s) and contributor(s) and not of MDPI and/or the editor(s). MDPI and/or the editor(s) disclaim responsibility for any injury to people or property resulting from any ideas, methods, instructions or products referred to in the content. |
© 2024 by the authors. Licensee MDPI, Basel, Switzerland. This article is an open access article distributed under the terms and conditions of the Creative Commons Attribution (CC BY) license (https://creativecommons.org/licenses/by/4.0/).