Proceeding Paper

Method for Determining Fracture Energy of a Polypropylene Coarse Lightweight Aggregate Concrete Beam Using Digital Image Correlation †

Department of Civil Engineering, Faculty of Engineering, Universitas Indonesia, Depok 16424, Indonesia
*
Author to whom correspondence should be addressed.
Presented at the 7th Mechanical Engineering, Science and Technology International Conference, Surakarta, Indonesia, 21–22 December 2023.
Eng. Proc. 2024, 63(1), 19; https://doi.org/10.3390/engproc2024063019
Published: 5 March 2024

Abstract

:
This study aimed to propose a method for determining the fracture behavior of sand-coated polypropylene coarse aggregate lightweight concrete (PP-LWAC). To understand the fracture response, an experimental investigation is carried out on 36 beam specimens and PP-LWAC is prepared using sand-coated PP aggregate based on previous study. The mix proportion is designed to match with three different specified compressive strengths. The Work of Fracture Method (WFM) and Size Effect Method (SEM) is used to define the fracture parameters, proposing the relationship between the fracture parameters and the compressive strength. Additionally, the crack mechanism is studied using the Digital Image Correlation (DIC) method.

1. Introduction

Polypropylene Coarse Lightweight Aggregate Concrete (PP-LWAC) is an innovative class of lightweight concrete, using polypropylene as a coarse aggregate. This material shows the shift towards more sustainable and environmentally friendly construction practices, according to several Sustainable Development Goals (SDGs), particularly those related to sustainable cities and communities, responsible consumption and production, as well as climate action. The use of polypropylene, often sourced from recycled plastics, reduces the waste stream and the overall weight of the concrete, leading to lower transportation emissions and minimal structural load.
Previous study has shown that the use of lightweight concrete offers advantages such as reduced structural component size, enhanced design flexibility, reduced dead load of structures, improved structural response to dynamic or seismic loads, and reduction in steel bars [1]. Additionally, it provides increased thermal insulation [2]. The application of lightweight concrete in structural elements also has positive effects, including improved ductility [3], increased cracking load [4], enhanced collapse load capacity, larger deflection values, and minimized crack width [5]. However, this material has a higher friction compared to normal concrete, as indicated by lower fracture energy value [6], limiting its use in the construction industry.
Although the use of polypropylene aggregate in concrete offers numerous advantages, careful consideration is required regarding its influence on structural integrity. One main aspect of assessing the durability and safety of this material is understanding the fracture mechanism. Generally, cracks are inherent properties of quasi-brittle materials such as concrete, which can rapidly lead to failure. Therefore, there is a need to investigate the fracture energy to fully understand the implications of using polypropylene aggregate. This understanding is essential for predicting and mitigating potential failures in structures using PP-LWAC.
The methods that have been established for determining the fracture energy in concrete [7] are categorized into two primary methods:, namely the Work of Fracture Method (WFM) and the Size Effect Method (SEM). WFM has been used for determining the fracture energy of various lightweight concrete types, including foam concrete [8], polypropylene fiber concrete [9], and limestone [10]. Meanwhile, SEM is widely applied for lightweight concrete using expanded clay aggregates [11]. Several studies have integrated both methods to ascertain the fracture energy of lightweight concrete, by combining WFM and SEM [6,12,13,14], as well as SEM and the Boundary Effect Method [15]. However, there is limited information on the fracture energy determination in sand-coated PP-LWAC.
Digital Image Correlation (DIC) is a non-invasive optical method that enables the monitoring of structures without inflicting damage. This method is effective in detecting and tracking crack initiation as well as progression to analyze fracture mechanisms [16,17,18,19]. Several studies have applied DIC to determine the fracture energy in various materials, including asphalt concrete [20], full-graded dam concrete specimens [21], and hydraulic concrete [22]. However, its application in investigating the fracture energy in lightweight concrete aggregates, particularly those composed of sand-coated polypropylene, has not been documented.
Based on the background above, this study aimed to investigate the fracture mechanism of sand-coated PP-LWAC using DIC. Initially, existing literature on the fracture energy determination method is reviewed, with a focus on WFM and SEM, as well as the application in various concrete types. This was followed by a detailing of the method used, emphasizing the innovative use of DIC as a non-invasive technique for observing crack propagation in lightweight concrete.

2. Proposed Method

Proposed method used for investigating the fracture energy in sand-coated PP-LWAC included WFM and SEM. Additionally, DIC was used to capture detailed visualizations of the crack initiation and propagation, as well as to analyze the fracture mechanisms.

2.1. Work of Fracture Method (WFM)

WFM is commonly used for determining the fracture energy in line with RILEM FMC-50 [23] and based on the Hillerborg cohesive crack model [24]. The determination of the fracture energy was carried out by a three-point bending test on a notched beam and calculated using the following Equation (1):
G F = W F d a 0 b
where GF is the total fracture energy in N/mm, while WF denotes the total consumed fracture energy correlated with the area under the load−displacement curve, measured in N.mm. Additionally, b, d, and a0 correspond to the width, height, and notch depth of the beam, respectively, each measured in mm.
The brittleness and ductility of concrete will be evaluated through the material characteristic length (Lch) using Equation (2):
L c h = E G F f 2 t
where Lch, E, and ft denote the characteristic length (mm), modulus of elasticity (GPa), and tensile strength (MPa), respectively. A higher Lch value indicates that the concrete shows greater ductility, implying an enhanced ability to resist crack propagation.

2.2. Size Effect Method (SEM)

According to RILEM FMT-89 [25], SEM is recommended as an easier and simpler method for determining fracture energy. This method includes performing a three-point bending test on the geometrically similar notched beam of various sizes. In this method, the primary fracture parameters obtained are fracture energy (Gf), length of fracture-prone zone (Cf), brittleness number (β), fracture toughness (KIC), and effective crack-tip opening displacement at maximum load (δC).
A five-step calculation process is carried out to accurately determine the fracture energy. The first step is to determine the weight compensation by calculating the peak load correction of P0 using Equation (3):
P 0 j = P j + 2 S j L j 2 S j m j g j = 1 , , n
where S and L are the distance between support and length of the specimen, respectively; m is the mass of the specimen; and g represents gravitational acceleration. The second step uses a linear regression analysis, which is conducted by plotting the ordinate Y and the abscissa X with:
X j = d j , Y j = b d j P 0 j 2
Y = AX + C
In which X = d , Y = 1 σ N 2 , d 0 = C A , B = 1 C .
The third step entails the determination of the specific fracture energy and effective length of fracture process zone:
G f = g α 0 A E
C f = g α 0 g α 0 × C A
where Gf is the fracture energy in N/m, Cf is the effective length of the process zone in mm, E is Young’s modulus of concrete, A is the slope of the line obtained from regression, C is the intersecting point of the y-axis with the regression line, g α 0 is the dimensionless energy rate, which is function of structural geometry, and g α 0 is the first derivative with respect to the initial crack relative length ( α 0 = ( a 0 d ) ). Akbari et al. [6] stated that g α 0 and g α 0 are the functions that depend on the specimen geometry and are obtained as per LEFM.
The fourth step includes the calculation of mode I fracture toughness and effective crack-tip opening displacement:
K I C = E G f
δ C = 8 K I C E × C f 2 π
where KIC is in MPa.mm0.5 and δ C in mm.
Nominal strength of geometrically similar specimens in SEM uses size effect law and can be calculated with:
σ N = B 1 + β , β = d d 0
where σ N is the nominal strength in MPa and parameter β is the Bazant and Kazemi’s brittleness number [26]. When β is greater than 10, linear elastic fracture mechanics (LEFM) is used to indicate the failure. When the value is less than 0.1, the failure determination can use plastic limit analysis. Among these limit values, the determination of the failure is expressed as fracture mechanics. For specimens with a similar geometry in two dimensions, σ N can be calculated using Equation (11):
σ N = C n P u b d
where Pu is the maximum load (N), Cu is the constant coefficient, b is the beam width (mm), and d is the beam depth (mm).

2.3. Digital Image Correlation (DIC)

DIC commences with capturing a reference image of a sample before loading. Throughout the loading or testing phase, continuous images of the specimen are captured. Subsequently, software that functions as an image correlation is used during the testing process for comparison with reference image. The comparison results show the deformation or movement the specimen passes through during the test [20]. A stochastic contrast speckle pattern, which must first be applied to the surface under study, is used to measure deformations in line with the DIC method. This pattern is crucial for accurate measurement of deformations, requiring adherence to certain criteria to ensure high-confidence experimental results and minimal noise. The criteria include high contrast, constant speckle sizes, surface filling, isotropy, as well as randomness [27]. Moreover, adherence to these standards ensures that the DIC method provides reliable and detailed insights into the material’s behavior under stress, serving as an invaluable tool in the study of fracture mechanics in sand-coated PP-LWAC.

3. Experimental Program
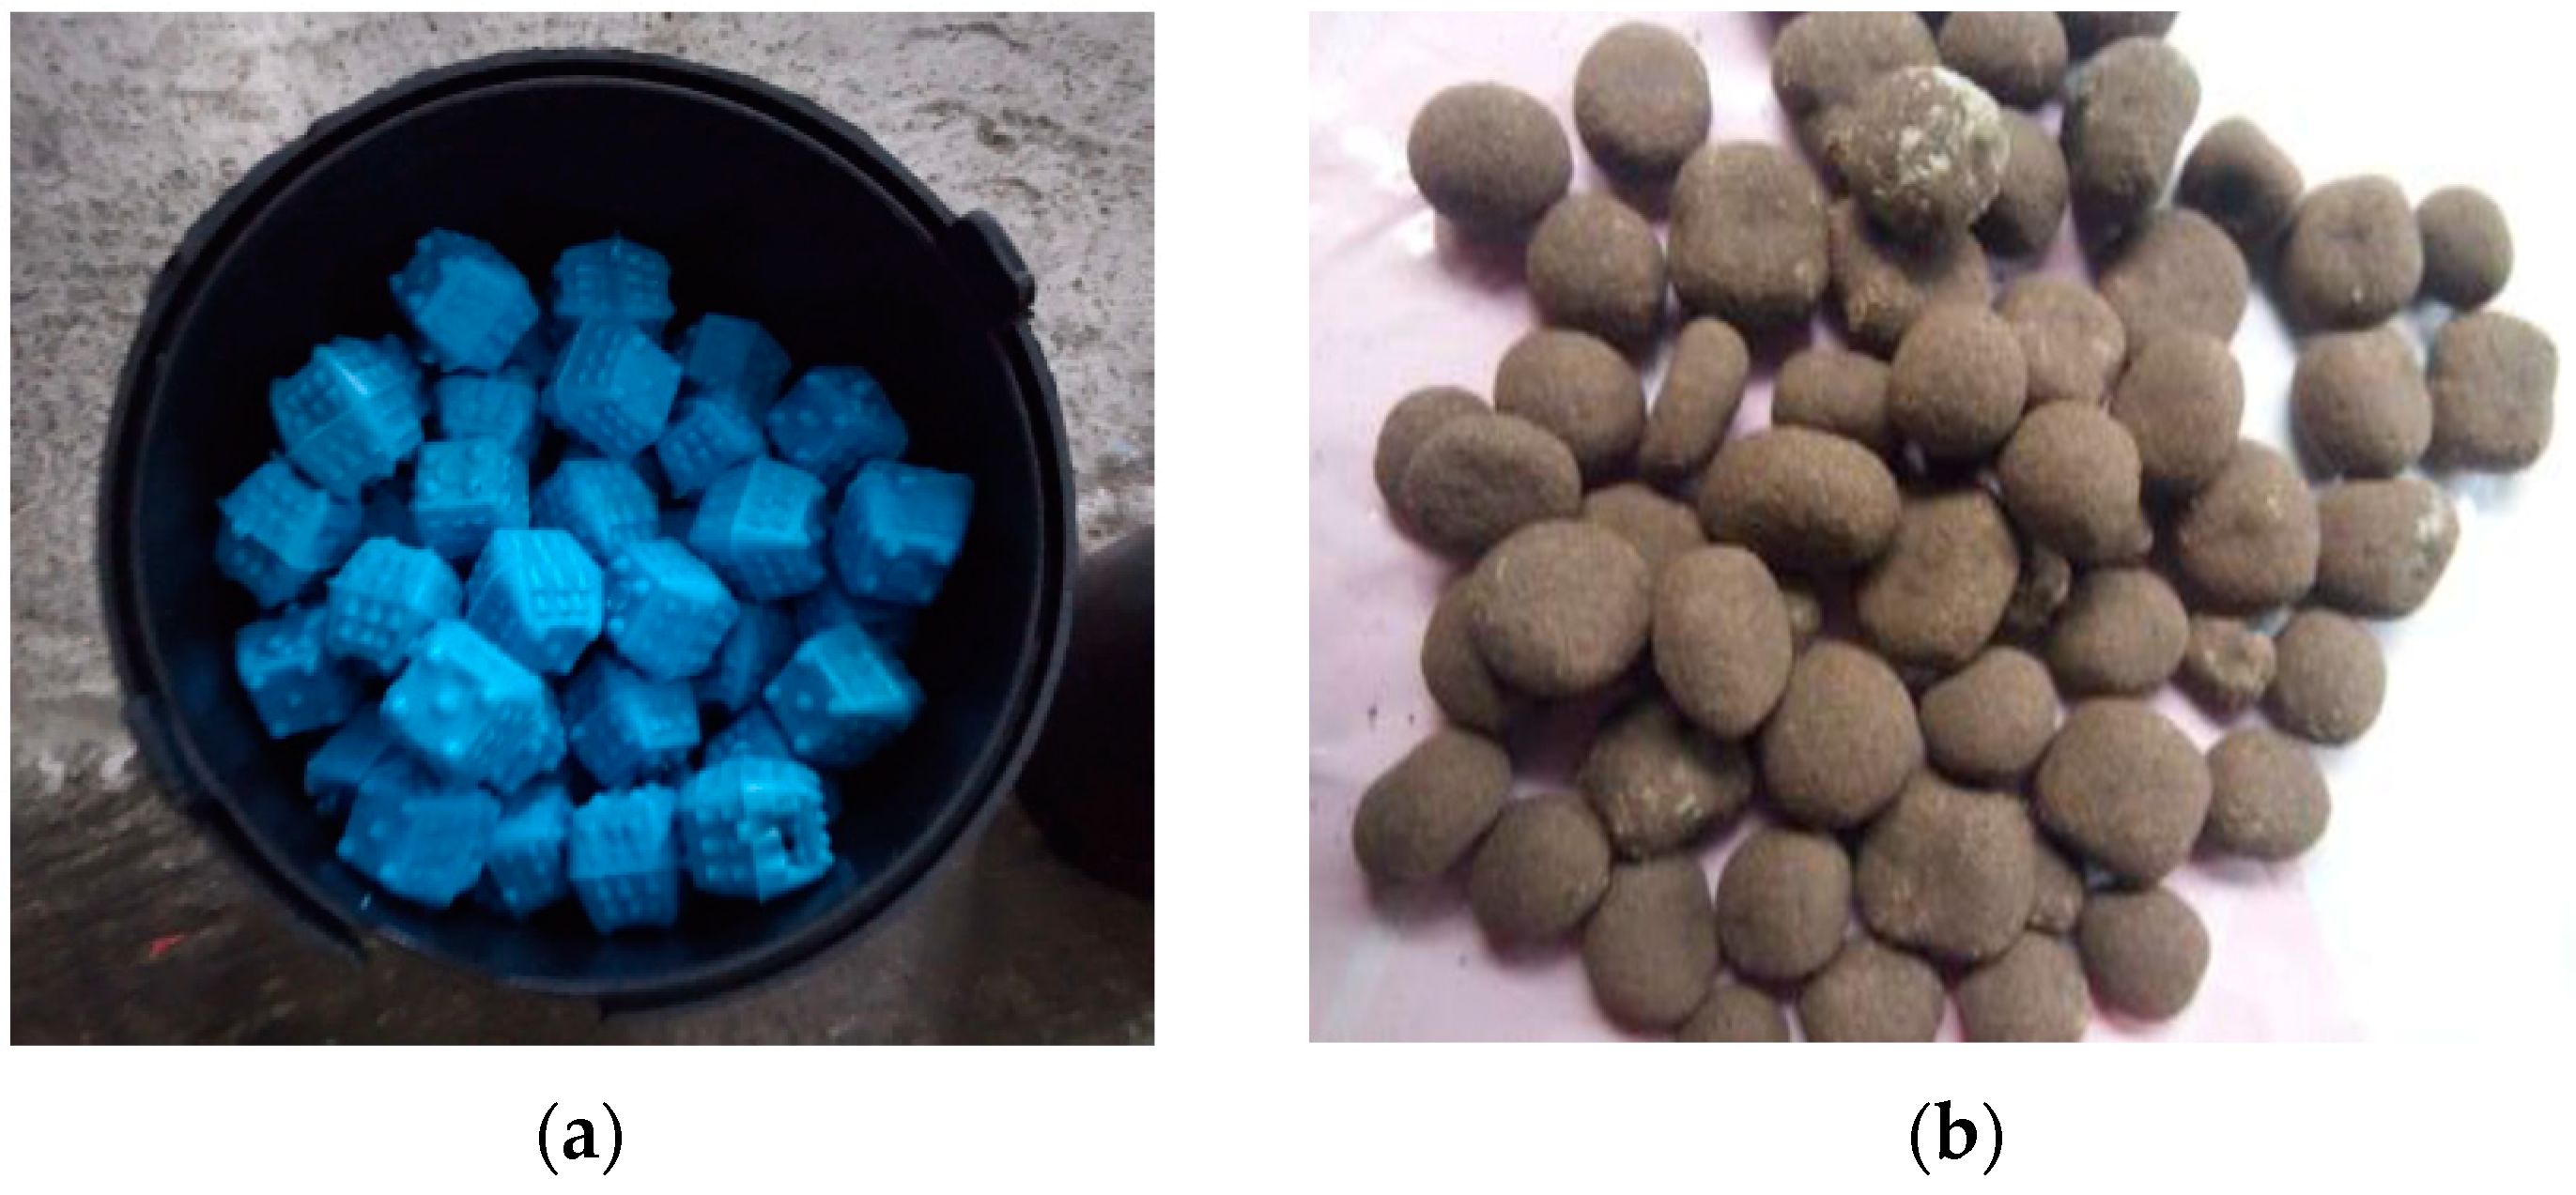
3.1. Materials

In this study, the fine aggregate used is sourced from Cimangkok, West Java, Indonesia. Furthermore, the fine aggregate has a bulk specific gravity of 2.54 and a fineness modulus of 2.686, with a particle size less than 9.5 mm. The superplasticizer (SP) will be incorporated as the mixture material for all water/cement (w/c) ratios to enhance fresh concrete workability. This additive has a specific gravity ranging between 1.18 and 1.2 at 27 °C.
The Portland Cement Composite is used as the primary binder and polypropylene (PP) plastic waste will be processed into coarse aggregate. The initial form of this uncoated plastic aggregate, resembling the design created by G. Pamudji et al. [28] is shown in Figure 1a. Typically, the largest pieces of the aggregate measures 10 mm in thickness, 20 mm in length, and 20 mm in width. The production process for the coated aggregate follows a similar procedure, where the plastic aggregate is melted and molded under hydraulic pressure using an automatic temperature control manual injection plastic machine, at a melting point range of 130°C ± 10°C. After formation, the plastic aggregate is cooled, and the uncoated sample is covered with hot sand to produce the final sand-coated plastic aggregate, as shown in Figure 1b.

3.2. Mix Design and Test Specimen Preparation
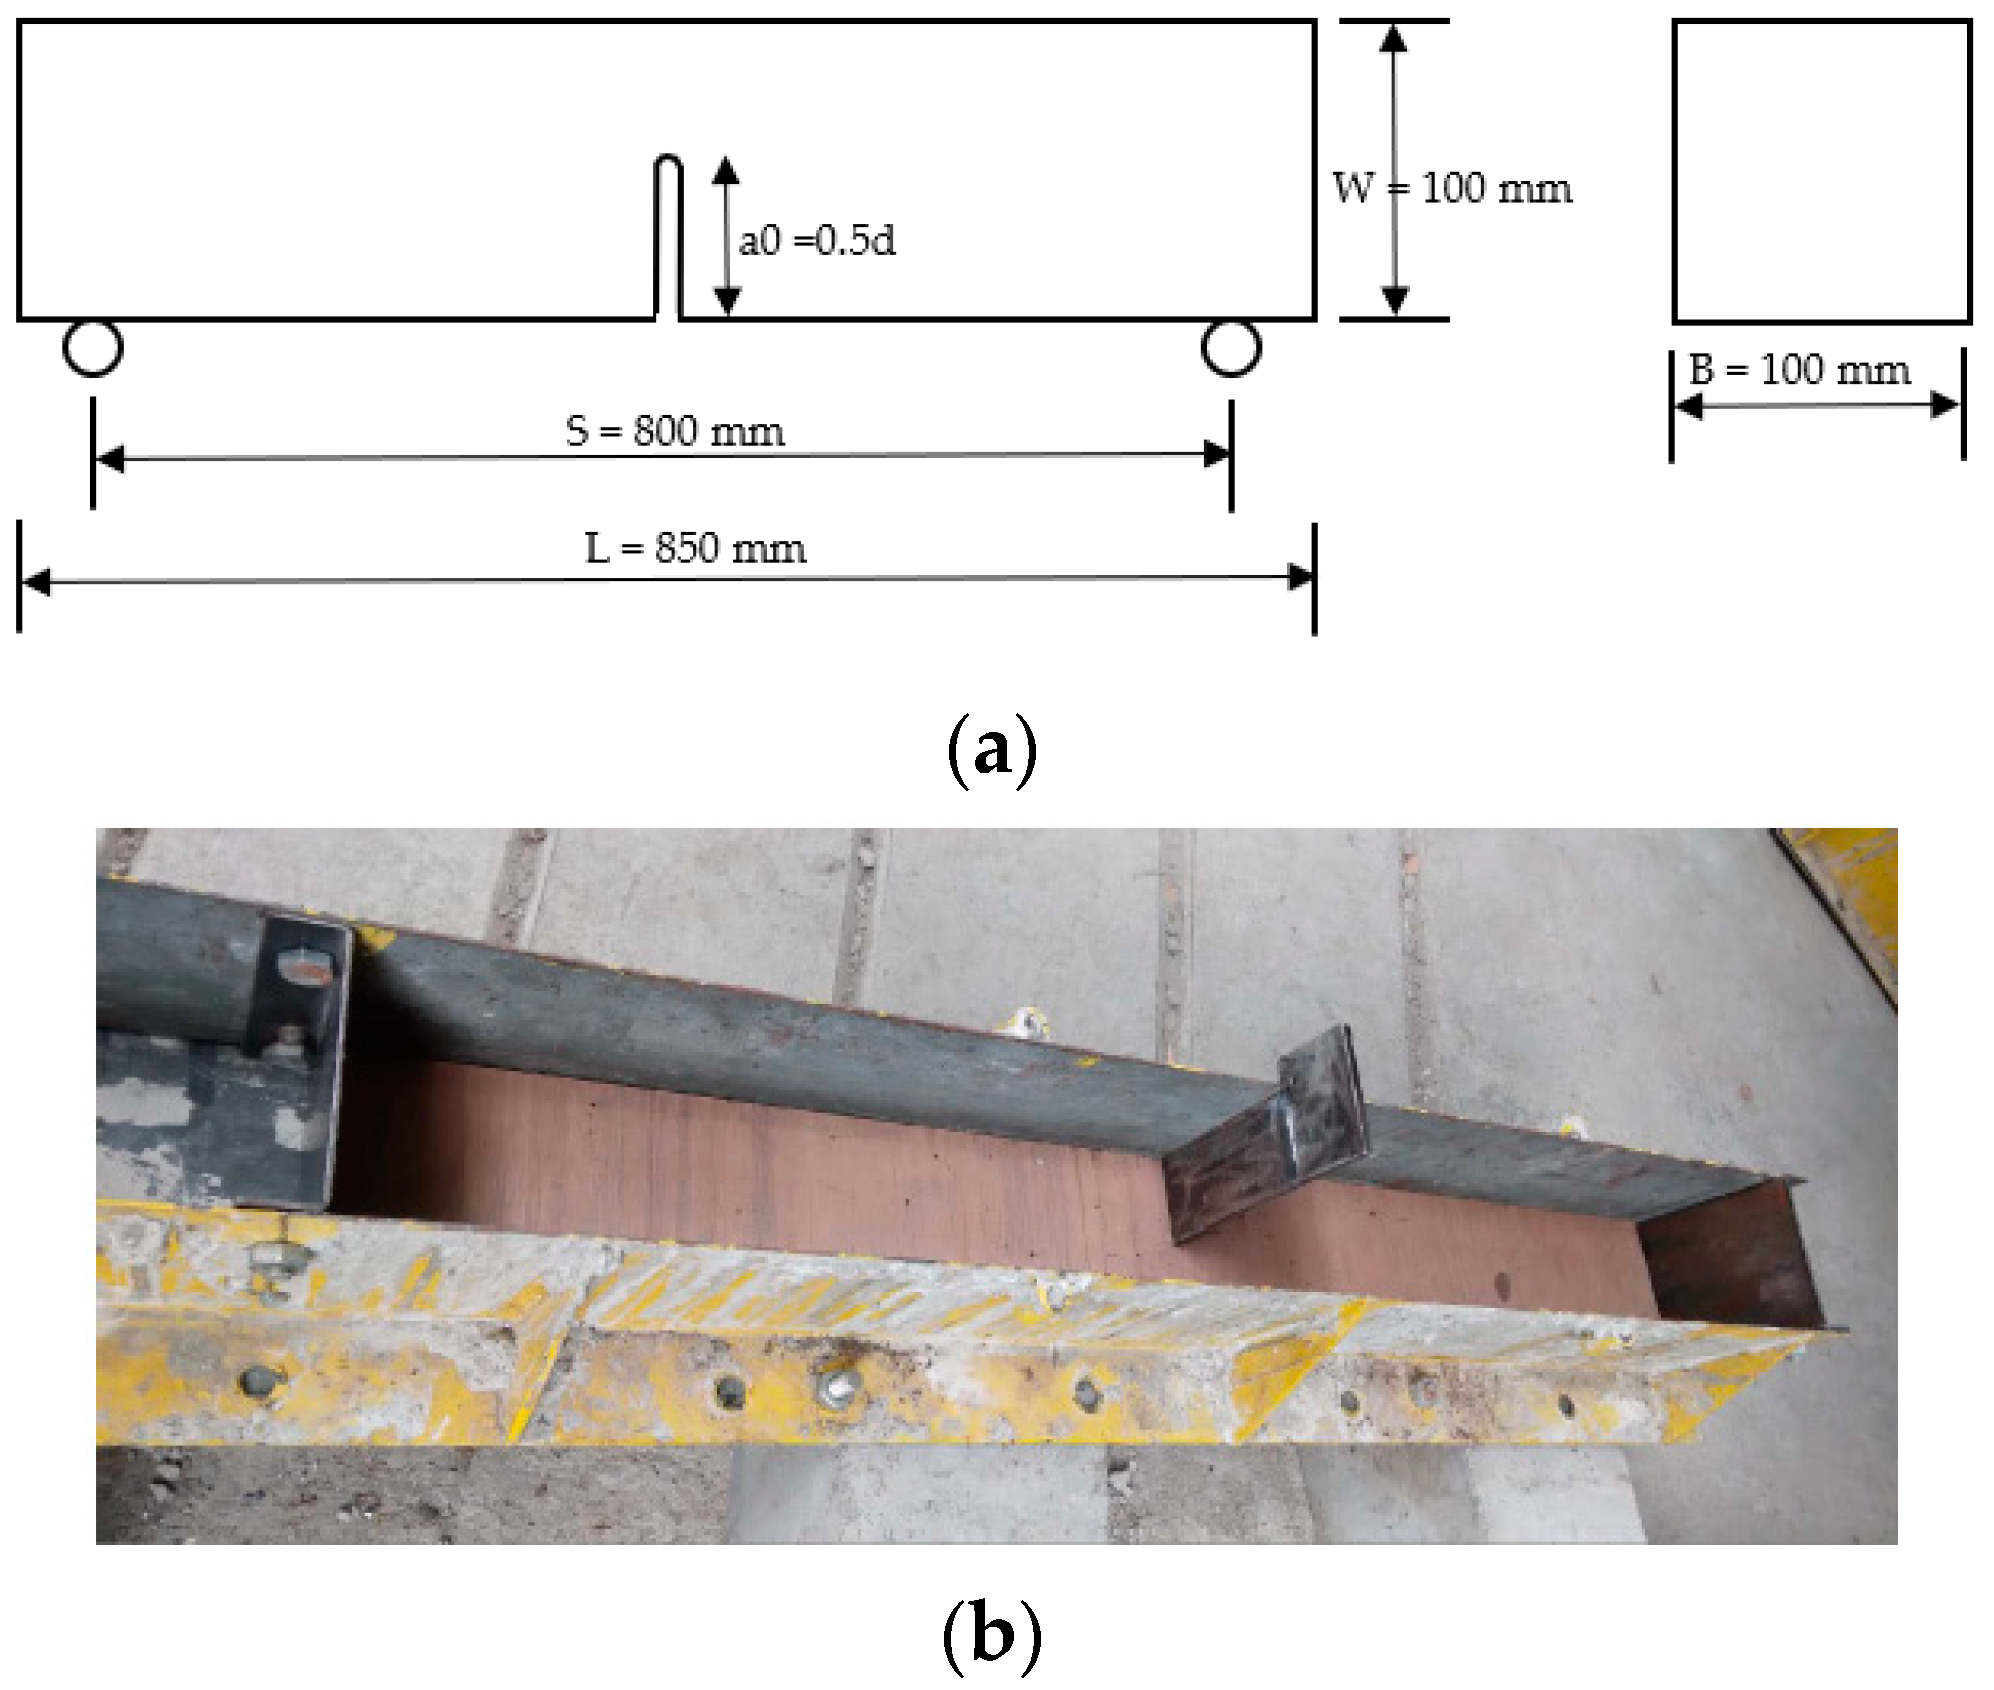
An experimental program will be designed in this study, following the procedures stated in previous study [29]. The design consisted of three concrete mixes corresponding to the target strength class, as shown in Table 1. The dry mix concrete will be used as the normal concrete, serving as the control specimen, which provided a baseline for comparison with the modified concrete mixes. The production process of the concrete refers to ASTM C192.

3.3. Test Procedure

In this study, nine cylindrical specimens measuring 150 × 300 mm will be fabricated for each concrete mix series. Several tests are conducted consisting of three specimens each allocated for measuring modulus of elasticity (E), determining Poisson’s ratio, and tensile strength test (ft) in accordance with ASTM C469. Additionally, three smaller cylindrical specimens measuring 100 × 200 mm will be prepared for each mix to determine the compressive strength (fc) base” on ’STM C39.
To evaluate the fracture parameters using WFM, three notched beams will be crafted for every target strength class. The beams have dimensions of 100 × 100 × 840 mm (depth × width × length) and an 800 mm span. An illustrative example of concrete beams prepared for WFM testing is shown in Figure 2a. On the bottom fiber (material under tension), a steel plate will be positioned centrally on the beam to introduce a vertical notch, with a uniform width of 5 mm. The ratio of the vertical notch depth to the three beam’s depth is set at 0.5 (a0 = 0.5d), as depicted in the beam framework shown in Figure 2b. During testing, a displacement-controlled load is employed, applying a concentrated load at the center of the beam’s span. Throughout each test, the load applied to the beam and deformations of specimens were simultaneous, ensuring a comprehensive understanding of the material’s fracture behavior under stress.
A set of notched beams, designed according to RILEM FMT-89 [25], will be further fabricated to assess the fracture parameters using SEM. Table 2 shows the specific dimensions of the beams scaled in a ratio of 0.75:1:1.25, with three beams will be fabricated for each target strength category. Subsequently, a continuous vertical notch with a depth of a0 = 0.2d will be introduced at the midspan of each beam by embedding a steel plate into the bottom fiber during the concrete casting process. A universal testing machine (UTM) with a maximum capacity of 50 kN will be used to test all notched beams under three-point static loading. The beams will be loaded at a constant rate of 0.1 mm/min for SEM and 0.5 mm/min at WFM.
The test procedure for DIC includes the use of a high-speed digital camera to capture a series of digital pictures of the concrete specimen. Using black ink, each speckle on the test specimen’s surface is marked individually [21]. Subsequently, the camera is set up vertically two meters from the specimen’s surface and mounted on a tripod, with LED cold light placed in front serving as the light source. Before testing, the DIC system is calibrated to ensure accurate deformation measurements. A reference image is captured to assess the speckle quality and confirm the accuracy of the calibration’s precision. To ensure that sufficient photos are obtained for recording the evolution of the crack, image acquisition frequency is adjusted during the test based on the loading rate. This sequential method ensures a detailed and accurate recording of the fracture process, providing valuable insights into the material’s behavior.

4. Analysis Mechanism

4.1. Mechanical Properties

A total of 45 cylindrical and 45 prism specimens will be fabricated in the Structural and Material Laboratory at the Universitas Indonesia. The fabrication process is carried out using two types of mixes, namely normal weight concrete (NWC) and lightweight concrete (LWC). The mechanical properties of the concrete, including modulus elasticity, Poisson’ Ratio, and direct tensile strength, will be derived from the experiment. A comparative analysis between the NWC and LWC will be conducted to determine their performance. Subsequently, the analysis of the material properties is carried out by observing the general trends occurring in each of the mechanical characteristics and investigating influencing factors. The results showing the mechanical properties will be systematically presented through figures and tables, providing a clear and comprehensive understanding of how the two concrete types compare in terms of their characteristics.
Total fracture energy (GF), or the energy required to propagate a crack with a unit surface area, is determined using WFM. This study will show variations in GF for both NWC and LWC across different target strength classes, investigating all potential factors. The data obtained will be compared with other studies to contextualize the results within the broader study landscape. Subsequently, a relationship will be proposed between GF and the compressive strength of LWC, specifically sand-coated polypropylene coarse aggregate lightweight concrete (PP-LWAC).
The characteristic length Lch is a key parameter in WFM for determining the ductility and brittleness of concrete. This parameter is intrinsically correlated to the length of the fracture process zone (FPZ) in the fictitious crack model. During the analysis, Equation (2) will be used to calculate Lch, and the result will be shown in the figures for further analysis. Moreover, a nonlinear regression analysis will be conducted to express Lch (mm) as a function of the compressive strength f′c (MPa) of LWC.

4.2. Analysis of Fracture Parameters based on SEM

In accordance with the guidelines provided by RILEM FMT-89 [25], the peak load calculation for NWC and LWC specimens is expected to include adjustments for the weight of the beam. This correction is crucial to ensure that the peak load accurately reflects the specimens’ capacity to withstand applied forces. During the analysis, Equation (3) will be used to modify the peak loads for the NWC and LWC specimens. Moreover, a linear regression analysis, in line with RILEM TC89-FMT guidelines, will be conducted to ascertain the primary fracture parameters in SEM, including the initial fracture energy (Gf), the effective length of the fracture process zone (Cf), and the fracture toughness (KIC), among others. Subsequently, the relationship between the initial fracture energy Gf (N/mm) and compressive strength f′c (MPa) for LWC is expressed by an equation. The results are compared with other studies to validate the conclusions.

4.3. DIC Analysis of Fracture Behavior

During the fracture test, strain and displacement measurements will be obtained from the captured image through DIC method. A two-dimensional (2D)-DIC setup will be used with a Fuji film X-A3 camera and two light sources. Using the reference image as a guide, the DIC analysis tracks the speckles in distorted images. Subsequently, GOM Correlate 2021 software, a renowned tool in the field of digital image processing, will be used to analyze the images captured.
By using the same software, the postprocessing will be performed to extract the DIC analysis result. The horizontal displacements of the notch can be extracted from the specimens’ surface using a line-type inspection gauge. The line drawn at the crack mouth opening displacement (CMOD) clip gauge level on the processed image is divided into various index points, to extract all the readings. As the points in the middle part overlap with the notch opening, the values of displacement indicate zero. Subsequently, the experimental clip gauge and the load-CMOD curves from DIC will be compared and presented in a figure.

5. Conclusions

In conclusion, this study design an extensive experimental program to investigate the fracture behavior of NWC and LWC using a combination of WFM and SEM, as stated by RILEM FMT-89. Adjustments for the weight of beam specimens and a series of linear regression analyses will be conducted to determine the primary fracture parameters and establish a relationship between fracture energy and compressive strength for LWC. The DIC method, using a 2D setup with a Fuji film X-A3 camera, will be used to capture strain and displacement measurements, which will be analyzed by software. Comparative analysis between experimental clip gauge data and DIC-derived load-CMOD curves will be used to validate the efficacy of the DIC method. This comprehensive method will focus on providing a better understanding of fracture mechanics in concrete, contributing valuable insights for the development of more resilient and sustainable construction materials.

Author Contributions

Conceptualization and methodology, H.P.; software development, H.P. and N.H.; validation, H.P. and N.H.; formal analysis, S.M. and N.H.; investigations, S.M. and N.H.; resources, S.M., H.P., N.H.; data curation S.M.; writing-original draft preparation, S.M.; writing-review and editing, N.H.; visualization; S.M. and N.H.; supervision and funding acquisition, H.P. and N.H. All authors have read and agreed to the published version of the manuscript.

Funding

This study received no external funding.

Institutional Review Board Statement

Not applicable.

Informed Consent Statement

Not applicable.

Data Availability Statement

The data presented in this study are available on request from the corresponding author.

Conflicts of Interest

The authors declare no conflicts of interest.

References

  1. Kulbhushan, K.; Kumar, S.; Chaudhary, R.; Ahmad, S.; Gupta, S.; Chaurasia, R. A Contextual Analysis of the advantages by using lightweight concrete blocks as substitution of bricks. Int. Res. J. Eng. Technol. 2018, 5, 6. [Google Scholar]
  2. Poonyakan, A.; Rachakornkij, M.; Wecharatana, M.; Smittakorn, W. Potential use of plastic wastes for low thermal conductivity concrete. Materials 2018, 11, 1938. [Google Scholar] [CrossRef] [PubMed]
  3. Adnan, H.M.; Dawood, A.O. Strength behavior of reinforced concrete beam using re-cycle of PET wastes as synthetic fibers. Case Stud. Constr. Mater. 2020, 13, e00367. [Google Scholar] [CrossRef]
  4. Mohammed, A.A.; Rahim, A.A.F. Experimental behavior and analysis of high strength concrete beams reinforced with PET waste fiber. Constr. Build. Mater. 2020, 244, 118350. [Google Scholar] [CrossRef]
  5. Noori, A.Q.N.; Numan, H.A. Behavior of sustainable reinforced concrete building containing waste plastic and fibers. In IOP Conference Series: Materials Science and Engineering; IOP Publishing: Bristol, UK, 2020; Volume 870, p. 012094. [Google Scholar]
  6. Akbari, M.; Tahamtan, M.H.N.; Fallah-Valukolaee, S.; Herozi, M.R.Z.; Shirvani, M.A. Investigating fracture characteristics and ductility of lightweight concrete containing crumb rubber by means of WFM and SEM methods. Theor. Appl. Fract. Mech. 2022, 117, 103148. [Google Scholar] [CrossRef]
  7. Khalilpour, S.; BaniAsad, E.; Dehestani, M. A review on concrete fracture energy and effective parameters. Cem. Concr. Res. 2019, 120, 294–321. [Google Scholar] [CrossRef]
  8. Falliano, D.; De Domenico, D.; Sciarrone, A.; Ricciardi, G.; Restuccia, L.; Ferro, G.; Tulliani, J.-M.; Gugliandolo, E. Influence of biochar additions on the fracture behavior of foamed concrete. Frat. Integrità Strutt. 2020, 14, 189–198. [Google Scholar] [CrossRef]
  9. Li, J.; Wan, C.; Zhang, X.; Niu, J. Fracture property of polypropylene fibre-reinforced lightweight concrete at high temperatures. Mag. Concr. Res. 2020, 72, 1147–1154. [Google Scholar] [CrossRef]
  10. Yang, J.; Song, C.; Wang, Q. Comparative analysis of the effects of aggregates and fibres on the fracture performance of lightweight aggregate concrete based on types I and II fracture test methods. Theor. Appl. Fract. Mech. 2022, 117, 103202. [Google Scholar] [CrossRef]
  11. Afzali-Naniz, O.; Mazloom, M.; Karamloo, M. Effect of nano and micro SiO2 on brittleness and fracture parameters of self-compacting lightweight concrete. Constr. Build. Mater. 2021, 299, 124354. [Google Scholar] [CrossRef]
  12. Mehrab, A.H.; Esfahani, M.R. Experimental Study on Size Effect and Fracture Properties of Polypropylene Fiber Reinforced Lightweight Aggregate Concrete. Period. Polytech. Civ. Eng. 2022, 66, 1278–1293. [Google Scholar]
  13. Dabbaghi, F.; Fallahnejad, H.; Nasrollahpour, S.; Dehestani, M.; Yousefpour, H. Evaluation of fracture energy, toughness, brittleness, and fracture process zone properties for lightweight concrete exposed to high temperatures. Theor. Appl. Fract. Mech. 2021, 116, 103088. [Google Scholar] [CrossRef]
  14. Karamloo, M.; Afzali-Naniz, O.; Doostmohamadi, A. Impact of using different amounts of polyolefin macro fibers on fracture behavior, size effect, and mechanical properties of self-compacting lightweight concrete. Constr. Build. Mater. 2020, 250, 118856. [Google Scholar] [CrossRef]
  15. Nikbin, I.M.; Farshamizadeh, M.; Jafarzadeh, G.A.; Shamsi, S. Fracture parameters assessment of lightweight concrete containing waste polyethylene terephthalate by means of SEM and BEM methods. Theor. Appl. Fract. Mech. 2020, 107, 102518. [Google Scholar] [CrossRef]
  16. Parmadi, B.J.; Handika, N.; Sutanto, D.; Sentosa, B.O. Recycled aggregate concrete beam: Experimental study using digital image correlation (DIC) and numerical study using multi-fibre Timoshenko beam element in CAST3M. In AIP Conference Proceedings; AIP Publishing: Damansara, Malaysia, 2023; Volume 2847. [Google Scholar]
  17. Ernawan, E.; Sjah, J.; Handika, N.; Astutiningsih, S.; Vincens, E. Mechanical Properties of Concrete Containing Ferronickel Slag as Fine Aggregate Substitute Using Digital Image Correlation Analysis. Buildings 2023, 13, 1463. [Google Scholar] [CrossRef]
  18. Deltanto, A.D.; Handika, N.; Sentosa, B.O.B. Response of load-displacement on cubical sample of Oil-Palm shell with fly ash concrete using digital image correlation system. In AIP Conference Proceedings; AIP Publishing: Depok, Indonesia, 2021; Volume 2376. [Google Scholar]
  19. Hongsen, K.; Melhan, M.; Handika, N.; Sentosa, B.O.B. Parameterization of Oil Palm Shell Concrete on Numerical Damage Model Based on Laboratory Experiment using Digital Image Correlation. J. Phys. Conf. Ser. 2021, 1858, 012029. [Google Scholar] [CrossRef]
  20. Sudarsanan, N.; Zeng, Z.A.; Kim, Y.R. Laboratory investigation into the crack propagation mechanism of geosynthetic reinforced asphalt concrete using digital image correlation technique. Int. J. Pavement Eng. 2023, 24, 2251079. [Google Scholar] [CrossRef]
  21. Bu, J.; Wu, X.; Xu, H.; Chen, X. The rate effect on fracture mechanics of dam concrete based on DIC and AE techniques. J. Strain Anal. Eng. Des. 2022, 57, 496–510. [Google Scholar] [CrossRef]
  22. Ning, Y.; Ye, L.; Bai, L.; Xie, C.; Xu, H. Experimental Study on Fracture Properties of Hydraulic Concrete with Different Crack-Depth Ratios Based on Acoustic Emission and DIC Techniques. Adv. Mater. Sci. Eng. 2022, 2022, 8771674. [Google Scholar] [CrossRef]
  23. Recommendation, R.D. Determination of the fracture energy of mortar and concrete by means of three-point bend tests on notched beames. Mater. Struct. 1985, 18, 285–290. [Google Scholar]
  24. Hillerborg, A.; Modéer, M.; Petersson, P.-E. Analysis of crack formation and crack growth in concrete by means of fracture mechanics and finite elements. Cem. Concr. Res. 1976, 6, 773–781. [Google Scholar] [CrossRef]
  25. D’Essai, M.; Mé, T.; De La Rilem, P. Size-effect method for determining fracture energy and process zone size of concrete. Mater. Struct. 1990, 1, 7. [Google Scholar]
  26. Bazant, Y.; Kazemi, M. Determination of fracture energy, process zone longth and brittleness number from size effect, with application to rock and conerete. Int. J. Fract. 1990, 44, 111–131. [Google Scholar] [CrossRef]
  27. Blikharskyy, Y.; Kopiika, N.; Khmil, R.; Blikharskyy, Z. Digital Image Correlation Pattern for Concrete Characteristics—Optimal Speckle. In International Conference Current Issues of Civil and Environmental Engineering Lviv-Košice–Rzeszów; Springer: Berlin/Heidelberg, Germany, 2013; pp. 22–31. [Google Scholar]
  28. Pamudji, G.; Purnomo, H.; Katili, I.; Imran, I. The use of plastics waste as coarse aggregates for moderate strength concrete. In Proceedings of the 6th Civil Engineering Conference in Asia Region: Embracing the Future through Sustainability, Hotel Borobudur, Jakarta, 20–22 August 2013; pp. 602–978. [Google Scholar]
  29. Perdani. Kajian Numerik Pull-Out Beton Ringan Beragregat Polipropilen Menggunakan Variasi Diameter Tulangan Dengan Fokus Eksperimen Pada Tes Tekan Silinder. Undergraduate Thesis, Universitas Indonesia, Depok, Indonesia, 2017.
Figure 1. Polypropene coarse aggregate: (a) uncoated plastic aggregate and (b) plastic aggregate coated with sand.
Engproc 63 00019 g001
Figure 2. Notched beam specimens: (a) specimens for WFM analyzing and (b) framework of notched beam.
Engproc 63 00019 g002
Table 1. Mix composition of the PP coarse aggregate concrete.
Target Strength Classw/c RatioCementSandPP AggregateWaterSP
17–18.9 MPa0.29122.60.850.60%
19–20.9 MPa0.281220810.70%
>21 MPa0.286121.80.90.80%
Table 2. Summary of experimental design.
SpecimensStandardNumber of Repetitions Per MixAchievable Parameter
150 × 300 mm3
cylindrical specimen
ASTM C496threeModulus of elasticity
threeDirect tensile strength
threePoisson’s Ratio
100 × 200 mm3
cylindrical specimen
ASTM C39threeCompressive strength
100 × 100 × 840 mm3
beam specimen
RILEM FMC-50threeFracture toughness (WFM)
RILEM FMT-89threeFracture toughness (SEM)
75 × 75 × 630 mm3
beam specimen
RILEM FMT-89threeFracture toughness (SEM)
125 × 125 × 1050 mm3
beam specimen
RILEM FMT-89threeFracture toughness (SEM)
Disclaimer/Publisher’s Note: The statements, opinions and data contained in all publications are solely those of the individual author(s) and contributor(s) and not of MDPI and/or the editor(s). MDPI and/or the editor(s) disclaim responsibility for any injury to people or property resulting from any ideas, methods, instructions or products referred to in the content.

