Proceeding Paper

Design and Simulations of 2D Planar Antenna for Dielectric Characterization of Biological Samples †

Department of Physics and Computer Science, Dayalbagh Educational Institute, Agra 282005, Uttar Pradesh, India
*
Author to whom correspondence should be addressed.
Presented at the 8th International Symposium on Sensor Science, 17–28 May 2021; Available online: https://i3s2021dresden.sciforum.net/.
Published: 17 May 2021
(This article belongs to the Proceedings of The 8th International Symposium on Sensor Science)

Abstract

:
The dielectric parameters help in understanding the structural, compositional and functional analysis of biological samples. These parameters have also been widely adopted in biomedical and therapeutic fields. In the microwave region, these parameters attract interest because the principal constituent of most biological cells is water. Therefore, it is difficult to isolate the dielectric response of water present in a biological composite. Therefore, the technique with enhanced sensitivity is essential for measuring the dielectric properties of biological samples. In this paper, we report the design and CST simulation of a 2D-planar patch type antenna with capacitive coupling introduced by dividing the patch through a gap. The aforementioned design further improves the antenna’s sensitivity to the dielectric properties of materials. Here, we simulated ten biological phantoms by measuring the shift in resonant frequency and return loss. Our results were identical when loading samples on either of the two introduced patches. These results suggest the repeatability and further improvements in a cavity-based technique where the sample localization is an important issue. Moreover, we analytically studied the dependency of gain and directivity of the antenna on the capacitive coupling, which plays a major role in the antenna’s sensitivity to dielectric characterization.

1. Introduction

The patch antennas are extensively used for implantable medical devices for various applications, such as microwave hyperthermia treatment, cancer tumor detection, tissue characterization, and imaging [1,2,3,4,5]. A patch antenna can be used as a dielectric-based biosensor which resonates depending upon the dielectric and other physical properties of the biological tissues. However, the patch antennas have a few disadvantages, which include low gain and relatively large size [6,7]. Patch antennas generally use multiple array system to enhance their gain [8]. However, the use of multiple patches in a multiple array system causes overall antenna size to increase, which makes this technique unsuitable for devices where size is the limitation. We, in our simulations, observed that the gain and sensitivity of patch antennas can be increased by introducing extra capacitance in the patch. We also observed that our technique enhances the sensitivity of the patch towards the dielectric properties of biological samples, which makes it an apt design for biological sample characterization.

2. Simulation Procedure

2.1. Design Parameters forPatch Antenna

The design parameters for the patch antenna were calculated using the equations reported for4 GHz resonant frequency ( f r ) [9]. We chose FR-4 as a substrate ( r   = 4.3). The ground plane and patch were made of copper. The resonant frequency of the antenna not only depends upon the width and length of the antenna but also on the combination of inductance and capacitance introduced in the patch [10]. Here, we report that by introducing an additional capacitance the antenna gain, radiation field and sensitivity increase. We introduced the additional capacitance by cutting a small area surrounding the perimeter of a rectangle (Figure 1d(ii)); this rectangle is then further divided in two small patches separated by a small gap (Figure 1d(iii)).

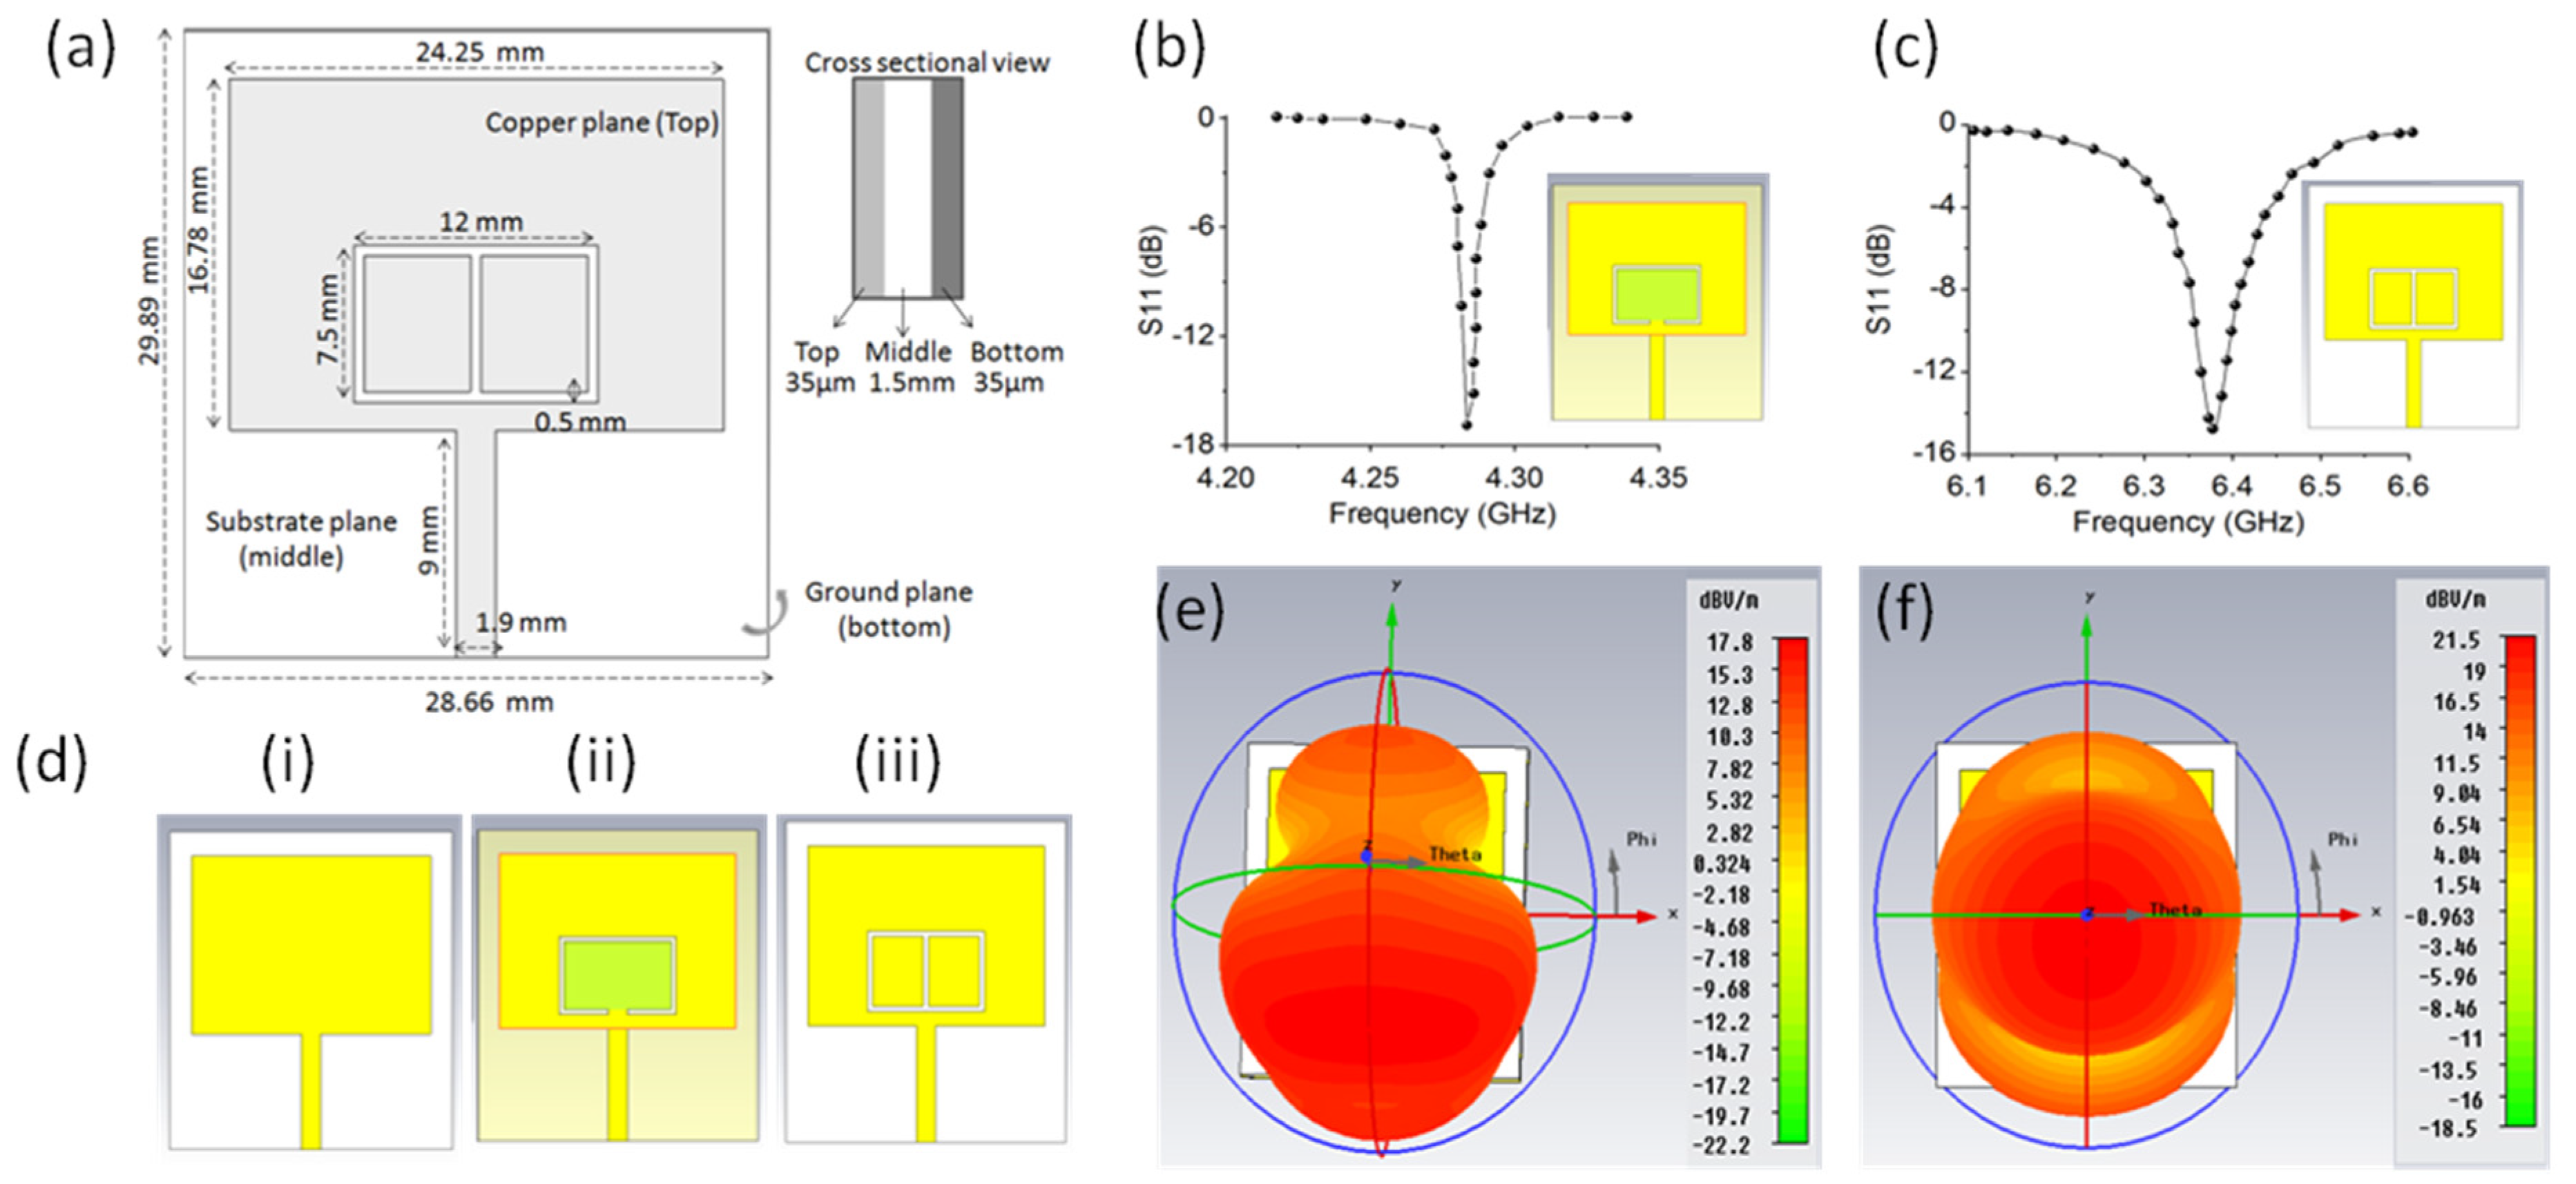
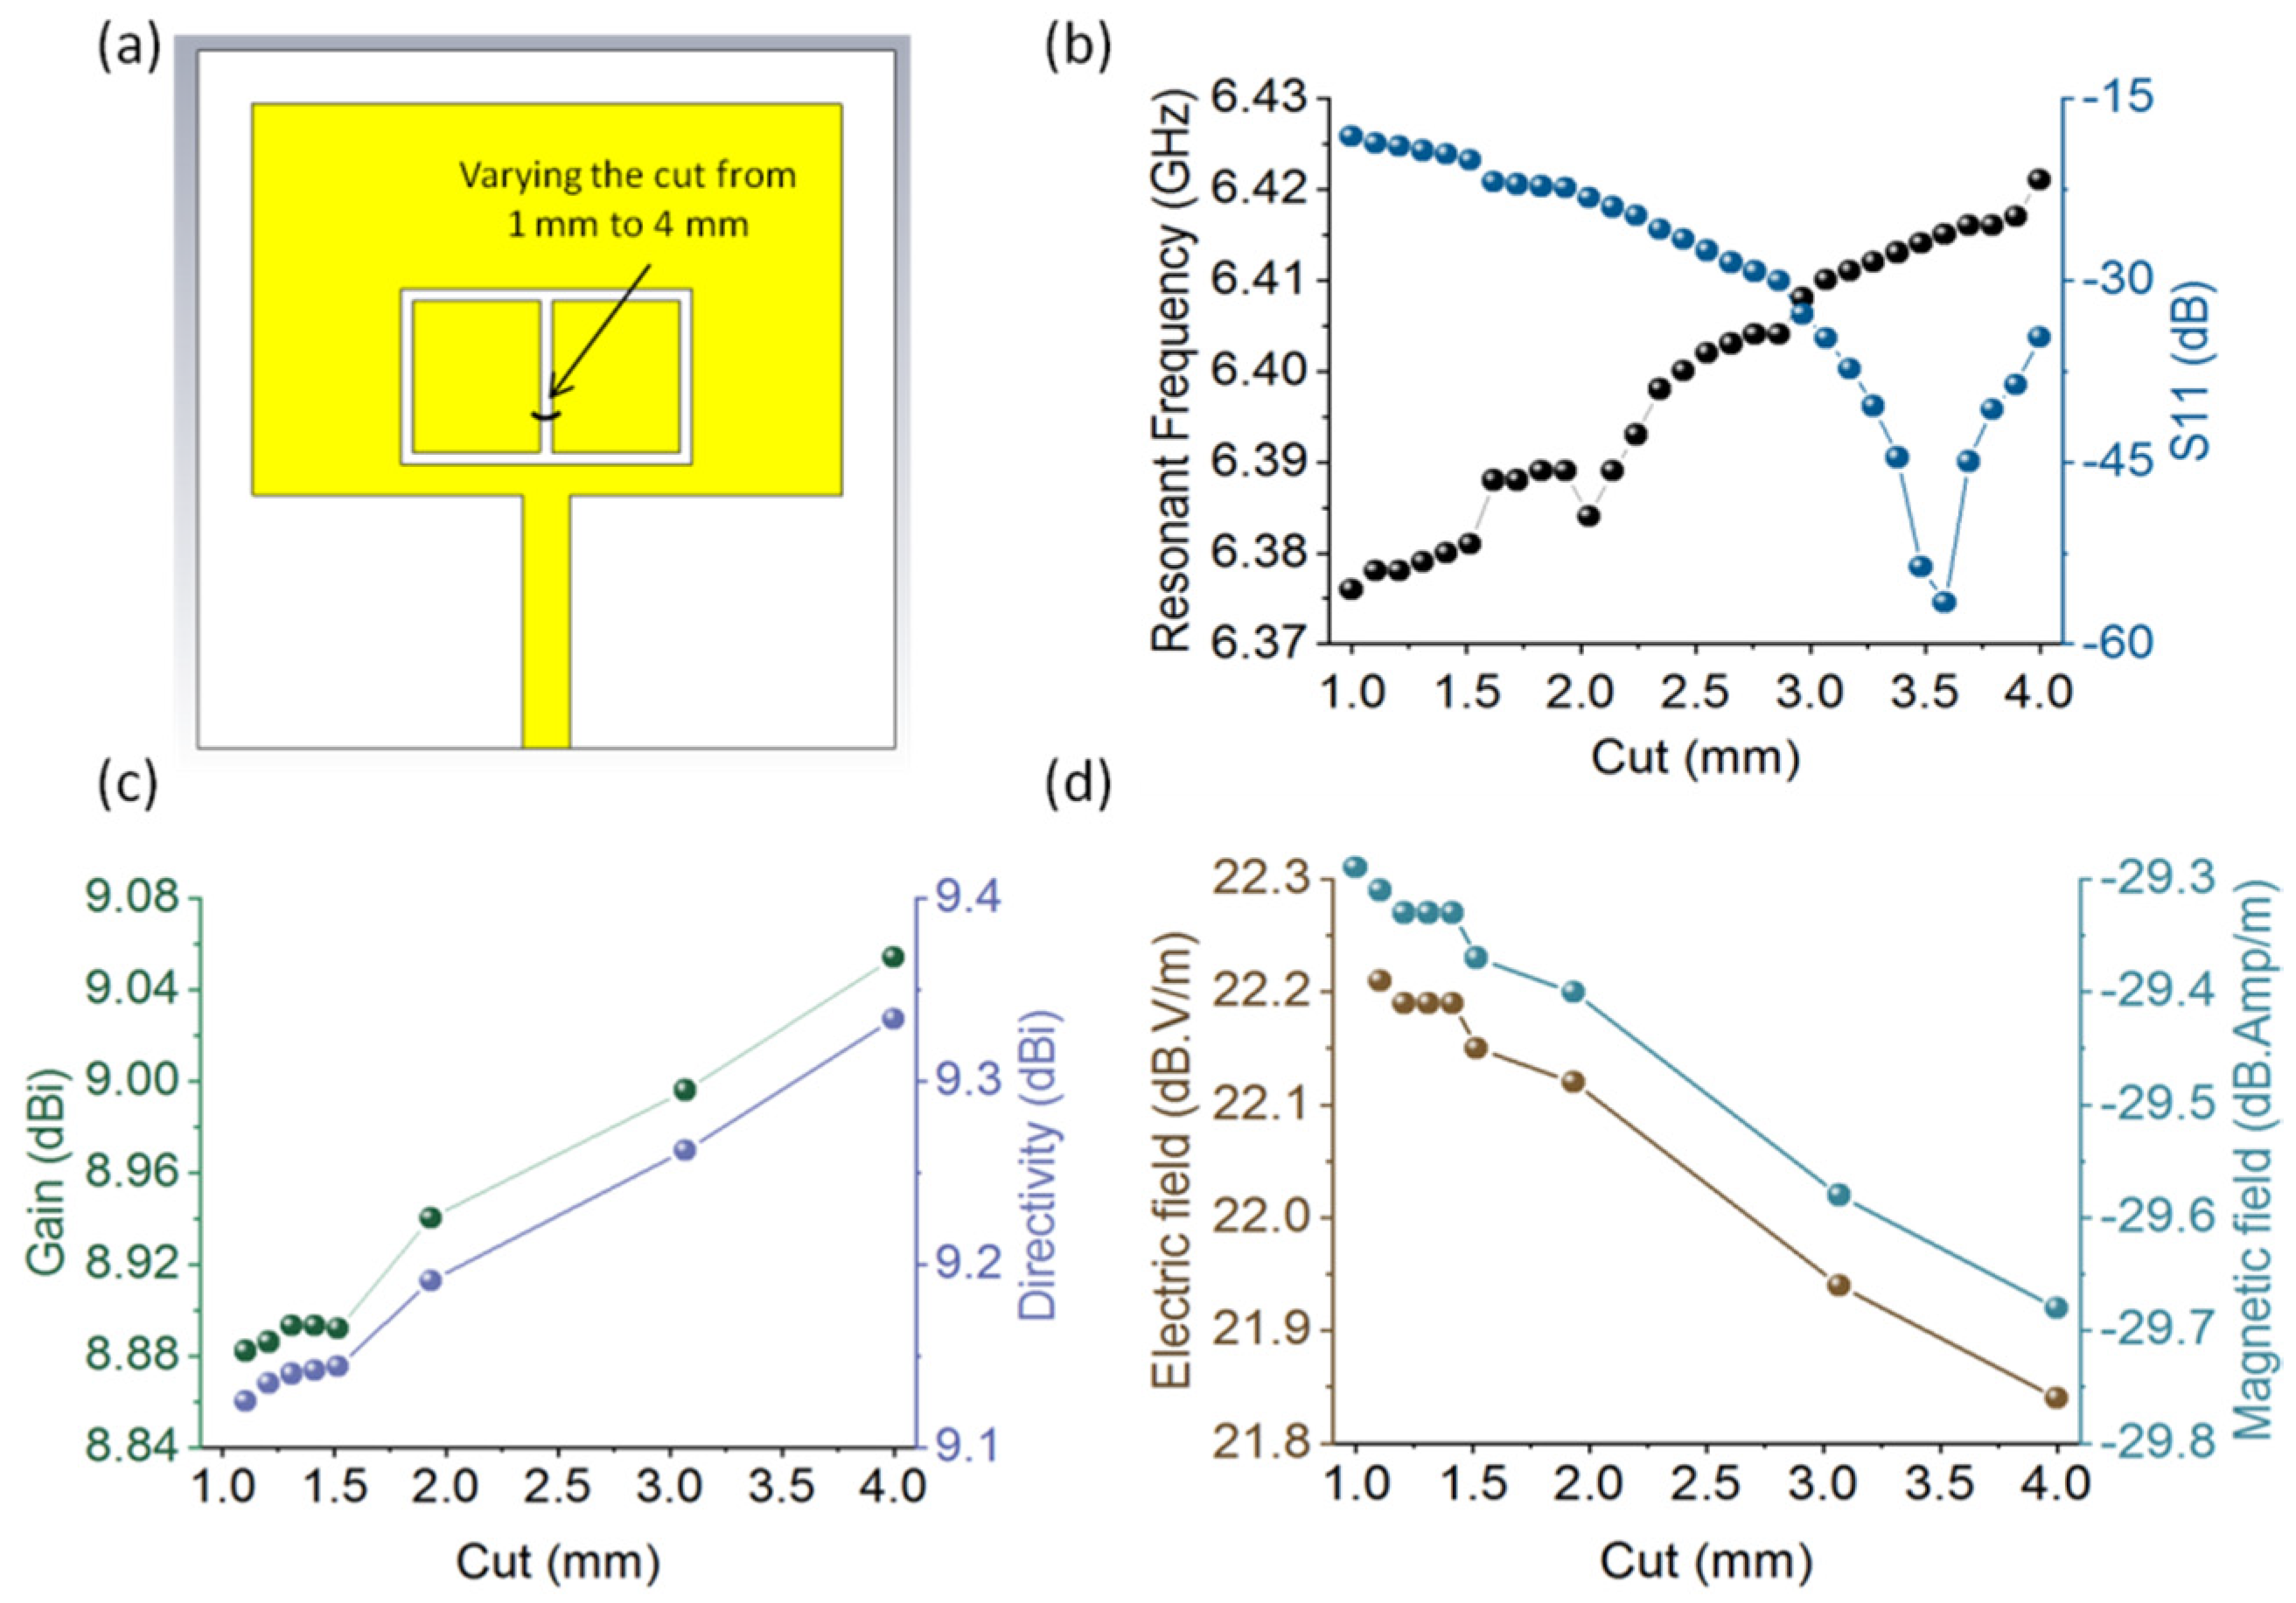
2.2. CST Simulations

The initial design (D1) (Figure 1d(i)) was simulated using CST Microwave Studio (version 2019) and the resonating frequency was found to be 4.122 GHz. D1 was modified (Figure 1d(ii), D2), and resonant frequency, S11 and electric field were found to be 4.2832 GHz, −17.14 dB and 17.8 dB V/m, respectively. D2 was further modified (Figure 1d(iii), D3) in two patches by introducing a gap in the center. This final design has resonant frequency, S11 parameter and maximum electric field at 6.376 GHz, −14.8565 dB and 21.5 dB V/m, respectively. This design has an enhanced radiation field and has applications in advanced biomedical, agriculture and wireless technology [11,12,13]. To check the sensitivity, ten biological phantoms were loaded on D2 and D3. We found that the shift in resonant frequency and S11 response reached the maximum in the D3.

3. Results

The resonant peak ofD1was broad and had a low quality factor, gain and directivity, which show the low radiation efficiency. However, in D2, the peak became narrow as compared to D1. D2 had ahigh quality factor, resonant frequency, gain and directivity. Furthermore, when D2 was modified to D3, gain and directivity further increased. To check the sensitivity of theD2 and D3, various biological phantoms (thickness 1 mm) were loaded in simulation. The frequency shift of the antenna due to the presence of samples is shown in Table 1. Here, we simulated 10 samples in which tooth phantom has a low dielectric constant 9 and water has a high dielectric constant of 78. In the results, we found that tooth and fat have the difference of 1 unit of dielectric constant, the frequency shift measured in D3 was 9 MHz, as compared to D2, which showed a shift of only 0.1 MHz frequency. Due to the high electric field, D3 was sensitive to half of the volume used in D1. In D3, we obtained, on he left and right, two small patches. To understand the symmetry of the left and right sections of patches in D3, samples (thickness 1 mm) were loaded separately on these sections. We found that the frequency and S11 shift of the left and right sections were nearly the same as shown in the Table 1. Further, by varying the cut from 1 mm to 4 mm, resonant frequency and corresponding S11 response changed, as shown in Figure 2. As we increased the cut, resonant frequency, quality factor, gain and directivity also increased. Therefore, cut plays an important role in optimizing the performance of the patch.

4. Discussion

This paper presents a method to increase the sensitivity of the patch by artificially introducing capacitive effects for the dielectric characterization of biological samples. This analysis is important for tuning the resonant frequency and optimizing the sensitive area on the patch without varying its size. Even when loading the sample separately on the two sections, the frequency shift and return loss appear symmetric, and the proposed antennae can be used as an alternative to the bulky cavity perturbation technique, in which device handling and the sample position present some limitations. Furthermore, validation of the results with the fabricated antenna will play a crucial role in biosensing.

Authors Contribution

Conceptualization U. and S.D.K.; Methodology, Investigation, Data Analysis and Writing U.; CST simulation analysis U. and Z.S.; writing—review and editing: U., Z.S., S.D.K. and M.K. All authors have read and agreed to the published version of the manuscript.

Funding

This research received no external funding.

Data Availability Statement

Data can be made available on demand.

Conflicts of Interest

The authors declare no conflict of interest.

References

  1. Sánchez-Fernández, C.J.; Quevedo-Teruel, O.; Requena-Carrión, J.; Inclán-Sánchez, L.; Rajo-Iglesias, E. Dual-band microstrip patch antenna based on short-circuited ring and spiral resonators for implantable medical devices. IET Microw. Antennas Propag. 2010, 4, 1048–1055. [Google Scholar] [CrossRef]
  2. Alibakhshikenari, M.; Virdee, B.S.; Shukla, P.; Parchin, N.O.; Azpilicueta, L.; See, C.H.; Abd-Alhameed, R.A.; Falcone, F.; Huynen, I.; Denidni, T.A.; et al. Metamaterial-inspired antenna array for application in microwave breast imaging systems for tumor detection. IEEE Access 2020, 21, 174667–174678. [Google Scholar] [CrossRef]
  3. Baskaran, D.; Arunachalam, K. Design of Site-Specific Microwave Phased Array Hyperthermia Applicators Using 434 MHz Reduced Cavity-Backed Patch Antenna. Bioelectromagnetics 2020, 41, 630–648. [Google Scholar] [CrossRef] [PubMed]
  4. Shanwar, A.R.; Othman, N.S. UWB printed antenna for medical applications. In Proceedings of the 2017 IEEE Region 10 Conference (TENCON 2017), Penang, Malaysia, 5–8 November 2017; pp. 2931–2936. [Google Scholar]
  5. Rishani, N.R.; Shubair, R.M.; Aldabbagh, G. On the design of wearable and epidermal antennas for emerging medical applications. In Proceedings of the 2017 Sensors Networks Smart and Emerging Technologies (SENSET), Beiriut, Lebanon, 12–14 September 2017. [Google Scholar]
  6. Parmar, N.; Saxena, M.; Nayak, K. Review of Microstrip patch antenna for WLAN and Wimax application. Int. J. Eng. Res. Appl. 2014, 4, 168–171. [Google Scholar]
  7. Guo, Y.X.; Luk, K.M.; Lee, K.F.; Chow, Y.L. Double U-slot rectangular patch antenna. Electron. Lett. 1998, 34, 1805–1806. [Google Scholar] [CrossRef]
  8. Stanley, M.; Huang, Y.; Wang, H.; Zhou, H.; Alieldin, A.; Joseph, S. A capacitive coupled patch antenna array with high gain and wide coverage for 5G smartphone applications. IEEE Access 2018, 6, 41942–41954. [Google Scholar] [CrossRef]
  9. Afridi, M.A. Microstrip patch antenna—Designing at 2.4 GHz frequency. Biol. Chem. Res. 2015, 2015, 128–132. [Google Scholar]
  10. Bao, X.L.; Ruvio, G.; Ammann, M.J. Low-profile dual-frequency GPS patch antenna enhanced with dual-band EBG structure. Microw. Opt. Technol. Lett. 2007, 49, 2630–2634. [Google Scholar] [CrossRef]
  11. Rajurkar, H.; Akojwar, S. On the Parametric Analysis of Bio Inspired Printed Monopole Antenna for Wireless Sensor Network in Agriculture. In International Conference on Intelligent Data Communication Technologies and Internet of Things; Springer: Cham, Switzerland, 2018; pp. 587–594. [Google Scholar]
  12. Hasan, R.R.; Shanto, M.A.; Howlader, S.; Jahan, S. A novel design and miniaturization of a scalp implantable circular patch antenna at ISM band for biomedical application. In Proceedings of the Intelligent Systems Conference (IntelliSys), London, UK, 7–8 September 2017; pp. 166–169. [Google Scholar]
  13. Maddio, S.; Pelosi, G.; Righini, M.; Selleri, S. A Slotted Patch Antenna with Enhanced Gain Pattern for Automotive Applications. Prog. Electromagn. Res. 2021, 95, 135–141. [Google Scholar] [CrossRef]
Figure 1. (a) Design parameters of patch antenna. (b,c) S11 response of patch shown in inset. (d) (i) initial design of patch. (ii) improvement in the initial design. (iii) final design. (e,f) electric field corresponding to patch d(ii) and d(iii), respectively.
Engproc 06 00042 g001
Figure 2. CST Simulations: (a) Front view of the design, (b) The change in resonant frequency and corresponding maximum S11 response, (c) Maximum Gain and Directivity, (d) Maximum electric field and magnetic field by varying the cut from 1 to 4 mm as shown the above patch shown in Figure 1d(iii)).
Engproc 06 00042 g002
Table 1. The Resonant Frequency (R.F.), Return Loss (R.L.) and Frequency Shift (F.S.) of D2 (See Figure 1d(ii)) and D3 (See Figure 1d(iii)) by loading the various samples.
Single Patch (Figure 1d(ii))Dual Patch (Figure 1d(iii))
Sample LoadingLeft Side LoadingRight Side Loading
No.SamplesεrσR.F.R.L.F.SR.F.R.L.F.SR.F.R.L.F.S.
1Empty--4.283−17.14506.376−14.85606.376−14.8560
2Skin tissue353.94.238−8.86044.36.321−10.082556.321−10.08555
3Water7810−64.225−10.89257.66.290−12.473866.290−12.45586
4Tooth91.24.246−24.32536.36.329−13.740476.329−13.74047
5Tongue tissue475.54.235−14.681486.311−11.231656.311−11.23065
6Bile tissue637.54.231−10.733526.304−9.857726.304−9.85772
7Blood tissue526.84.236−11.12846.46.310−10.826666.309−10.83667
8Brain tissue395.24.236−11.12846.46.314−11.452626.314−11.45262
9Fat tissue108.74.246−27.32536.46.320−10.393566.320−10.38556
10Lung tissue182.24.243−23.588406.323−12.199536.323−12.20053
11Reproductive tissue384.54.236−19.82046.46.314−11.626626.314−11.62662
Publisher’s Note: MDPI stays neutral with regard to jurisdictional claims in published maps and institutional affiliations.

