Abstract
Previous work has demonstrated the relevance of Fourier Tr and IR investigation on gingival crevicular fluid (GCF) for monitoring orthodontic treatments. Previously, FT-IR spectra of GCF samples have been acquired in reflectance mode by dropping a few microliters of GCF on a reflecting support. A faster procedure for collecting GCF spectra can be obtained by exploiting the Attenuated Total Reflection (ATR) contact sampling method, which allows the collection of good-quality infrared spectra with almost no sample preparation. The objective of the present investigation is to validate the ATR approach for GCF analysis by comparing the spectra acquired in reflectance using the GCF samples extracted via paper cones versus those directly collected from the blotter, employing the ATR approach.
1. Introduction
Previous work has demonstrated the relevance of Fourier Transform Infrared (FT-IR) spectroscopic investigation on gingival crevicular fluid (GCF) for monitoring orthodontic tooth movement during treatment with fixed appliances in permanent dentition [1]. FT-IR spectra of GCF samples have been acquired in reflectance mode by dropping a few microliters of GCF on a reflecting support. A faster procedure for collecting GCF spectra can be obtained by exploiting a different acquisition geometry. The Attenuated Total Reflection (ATR) approach allows the collection of good-quality infrared spectra from any solid or liquid sample with almost no sample preparation and spectra are recorded in a few minutes [2].
It has been demonstrated that an unfolding process occurs during the initial stage of orthodontic treatments followed by some recovery during the following days. Modifications could also result from the formation of amyloid aggregates that can be induced by mechanical stress due to the application of orthodontic forces [3].
One of the advantages of using GCF is the fluid collection method, which is non-traumatic, minimally invasive, and relatively simple to perform. Several sampling and analyzing methods have been described to collect GSF samples, each with advantages and disadvantages.
The objective of this research is to validate the ATR approach for GCF investigation by comparing the spectra acquired from GCF samples extracted with paper cones, and examined using conventional reflecting supports, compared to those collected by employing the ATR method. Using the ATR geometry, the measurement time is greatly shortened and there is no risk that the spectra can be affected by the extraction procedures. These findings can be pivotal for future research in order to make the GCF analysis fast and easy for the monitoring of orthodontic tooth movement in complex cases.
2. Materials and Methods
Patients aged between 13 and 21 years seeking an orthodontic treatment in full permanent dentition were recruited from the Orthodontic Program of the University of Campania Luigi Vanvitelli, Naples, Italy. GCF samples were collected before the beginning of the orthodontic treatment. Two different paper blotters were used: the standard sterile absorbent paper cones and PerioPaper strips, inserted 1 mm into the gingival crevice for about 30 s without any plaque or blood contamination of the fluid.
For FT-IR measurements in reflection geometry, GCF was extracted as reported in Ref. [4], whereas PerioPaper supports with GCF inside were directly used for the ATR acquisition mode. A Perkin Elmer Spectrum One FT-IR spectrometer was used for FT-IR in specular-reflection mode and a Universal ATR accessory was adopted for the other type of measurements.
Preliminary subtraction of the properly acquired background spectrum was performed for all spectra. Afterwards, the spectra were normalized using the Standard Normal Variate (SNV) method as described in Ref. [5]. The spectra were also analyzed using the convolution of Gaussian-shaped vibrational modes. The starting conditions of the procedure were manually selected and a best-fit routine from the GRAMS–AI software (2001, Thermo Fischer Scientific, Waltham, MA, USA) was used to estimate the optimized intensity, position, and width of the peaks. The χ2 parameter was used to assess the convolution procedure performance.
For ATR spectra, it was also necessary to take into account the contribution of cellulose content of PerioPaper strips, since the measurements were performed on them after the GCF collection. In this case, both the cellulose component of PerioPaper and the GCF contribute to the spectroscopy signal; thus, a numerical data treatment needs to distinguish the two signal components. The measured ATR signals of GCF-embedded samples were compared with the signal obtained from bare PerioPaper.
The signal intensity was previously normalized with respect to the average value using the SNV method mentioned above. After that, the normalized signals were compared using linear regression, and the substrate signal, mainly assigned to cellulose, was subtracted from the whole signal, and thus obtained the spectral contributions due to GCF.
3. Results and Discussion
3.1. FT-IR Spectroscopy in Reflection Mode on Extracted Fluid
A typical FT-IR spectrum acquired in reflection mode is shown in Figure 1. Two regions of interest in the spectrum were identified: the 3020–2750 cm−1 range (Figure 1a, high-wavenumber range) and the 1800–950 cm−1 range (Figure 1b, fingerprint range).
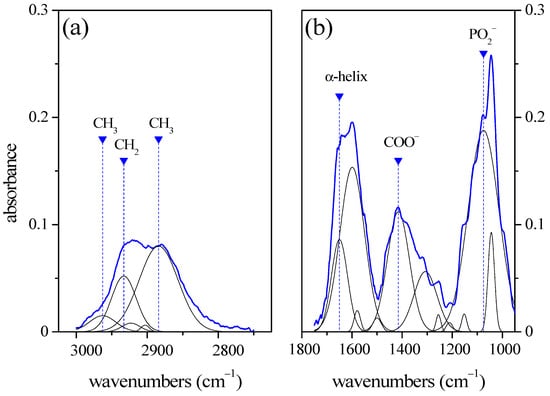
Figure 1.
Typical FTIR spectrum of GCF acquired in reflectance mode. On the left, we see the 3020–2750 cm−1 high-wavenumber range (a) and on the right, we see the 1800–950 cm−1 fingerprint range (b). Blue curves refer to the experimental data. The positions, area, and width of the peaks are reported in Table 1.
The spectrum in Figure 1a is mainly related to the C-H vibrational modes of lipids [4]. Two prominent peaks occur at 2933 cm−1 and 2884 cm−1 that can be assigned to CH2 asymmetric and CH3 symmetric stretching, respectively. A smaller component at 2963 cm−1 is attributed to the CH3 asymmetric stretching mode.
The spectrum in Figure 1b is mainly the result of protein vibrational modes. The spectrum is dominated by the Amide I band centered at about 1650 cm−1. The main component is assigned to α-helix vibrational mode. This allows us to obtain essential information on the structural configuration of the proteins when the relative intensity of the α-helix mode is compared with those of the other Amide I band components, namely the β-sheet modes, centered at 1588 cm−1 and 1599 cm−1 [5]. In addition to the Amide I band, two other major bands occur at about 1415 cm−1 and 1075 cm−1. The former is attributed to COO− stretching modes of amino acids. The band ranging into 1000–1100 cm−1 is related to C-O stretching mode. The prevalent component is centered at 1075 cm−1 and it is assigned to the PO2− stretching mode of nucleic acid [4].
A list of the Gaussian components obtained using the deconvolution process of the spectrum of Figure 1a,b is reported in Table 1. As said before, the mode peaks have been modeled by Gaussian functions. For each component, the spectral position xci, the relative peak area (in percent) Ai, and the peak width at half signal σi are reported.

Table 1.
Spectral features of GCF samples from FT-IR spectra acquired in reflection mode from the fluid extracted from the paper cones, and in ATR mode from GCF in PerioPapers. The analysis was performed using a deconvolution procedure using the overlap of Gaussian functions as model. The peak position, the normalized area, and the σ peak width are reported for each mode. The peak areas have been normalized to the whole area of 3020–2750 cm−1 range and 1800–950 cm−1 range, respectively.
3.2. ATR Spectroscopy on GCF in PerioPapers
The ATR configuration permitted the IR absorption spectrum of the GCF to appear directly on the PerioPapers supports, without any extraction process. The resulting IR spectrum of GCF in ATR configuration is reported in Figure 2. As in the case of conventional FT-IR, two regions of interest are shown in Figure 2a for wavenumbers ranging between 3020 and 2750 cm−1, and Figure 2b for the 1800–950 cm−1 range. In the high-wavenumber region, (Figure 1a) the spectrum is similar to the one resulting from the FT-IR spectroscopy shown in Figure 1a, but the spectral features are better resolved, and four peaks are clearly evinced. They were assigned to symmetric and antisymmetric stretching modes of CH2 (2851 cm−1 and 2919 cm−1) and CH3 (2870 cm−1 and 2961 cm−1), respectively. The ATR spectrum of GCF in the 1800–950 cm−1 wavenumber range is reported in Figure 2b. Also, in this region of the spectrum, it is possible to notice better-resolved spectral characteristics. The Amide I band located at 1644 cm−1 and assigned to α-helix mode and the peak at 1542 cm−1 assigned to Amide II band are clearly evident. The COO− stretching mode of amino acids occurs at 1150 cm−1, as in the case of spectra acquired in reflection mode. Instead, the intensity of the PO2− mode is drastically reduced due to the influence of the cellulose contained in the PerioPaper supports. In fact, in the FT-IR spectrum of cellulose, a large absorbance band occurs at 1083 cm−1 due to the C-O stretching ring modes [6]. This dramatically increases the radiation attenuation of the excitation signal and affects the ATR signal of CGF in this wavenumber region.
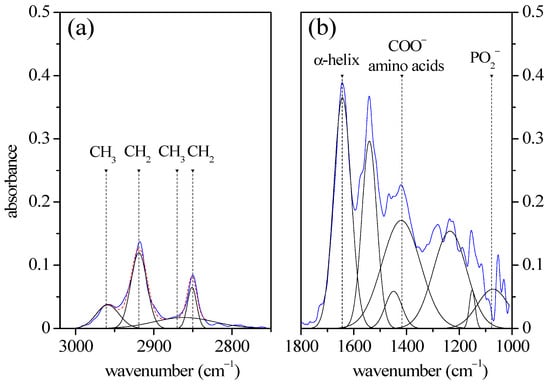
Figure 2.
Typical FTIR spectrum of GCF acquired in ATR mode. On the left, we see the 3020–2750 cm−1 high-wavenumber range (a) and on the right, we see the 1800–950 cm−1 fingerprint range (b). Blue curves refer to the experimental data. The positions, area, and width of the peaks are reported in Table 1.
As in the case of FT-IR spectrum acquired in reflection mode, the deconvolution of the spectrum in Gaussian terms allowed us to determine the main vibrational modes. Their spectral positions, areas, and widths are reported in Table 1 and compared with FT-IR data. In general, a good agreement between the two acquisition geometries is found. In the high-wavenumber region, the broadening of the peak in the spectrum acquired in reflection mode determines some slight intensity differences, but the spectrum behavior is the same. In the fingerprint region, similarities occur between the spectra acquired in the two different geometries, even if the band intensity is drastically lowered in the 1000–1200 cm−1 range.
4. Conclusions
Analytical vibrational spectroscopies are widely recognized to have a relevant impact on new medical approaches and contribute to improving diagnosis and monitoring processes in terms of time, reliability, and sensitivity. The ATR approach for FT-IR investigation of CGF samples has been explored directly on the PerioPaper probe. This is an important aspect of clinical practice, since it facilitates the use of spectroscopy analysis.
A general agreement has been found between spectral data obtained via FT-IR in reflection mode and ATR spectroscopy of CGF. However, a reduced IR absorbance signal is measured in the 1000–1200 cm−1 wavenumber range of the ATR spectrum, due to the influence of the cellulose contained in the PerioPaper. A more efficient procedure for subtracting cellulose contribution in this region that could offer better results is under investigation.
Author Contributions
Conceptualization, M.P., F.d. and M.L.; methodology, L.N. and C.C.; validation, M.P. and M.L.; investigation, F.d., M.P. and L.N.; data curation, C.C. and M.P.; writing—review and editing, C.C., F.d. and M.L. All authors have read and agreed to the published version of the manuscript.
Funding
This research received no external funding.
Institutional Review Board Statement
The study was conducted in accordance with the Declaration of Helsinki and approved by the Ethics Committee of University of Campania “L. Vanvitelli” (N. Prot. 207).
Informed Consent Statement
Informed consent was obtained from all subjects involved in the study.
Data Availability Statement
Data are available on request.
Conflicts of Interest
The authors declare no conflict of interest.
References
- d’Apuzzo, F.; Nucci, L.; Delfino, I.; Portaccio, M.; Minervini, G.; Isola, G.; Serino, I.; Camerlingo, C.; Lepore, M. Application of vibrational spectroscopies in the qualitative analysis of gingival crevicular fluid and periodontal ligament during orthodontic tooth movement. J. Clin. Med. 2021, 10, 1405. [Google Scholar] [CrossRef] [PubMed]
- Vigano, C.; Manciu, L.; Buyse, F.; Goormaghtigh, E.; Ruysschaert, J.M. Attenuated total reflection IR spectroscopy as a tool to investigate the structure, orientation and tertiary structure changes in peptides and membrane proteins. Biopolymers 2000, 55, 373–380. [Google Scholar] [CrossRef] [PubMed]
- Camerlingo, C.; Portaccio, M.; d’Apuzzo, F.; Nucci, L.; Perillo, L.; Delfino, I.; Lepore, M. An investigation on the Amide I band in vibrational spectra of gingival crevicular fluid during orthodontic treatments. In SPIE 12627, Translational Biophotonics: Diagnostics and Therapeutics III; SPIE: Munich, Germany, 2023; p. 1262732. [Google Scholar]
- Portaccio, M.; d’Apuzzo, F.; Perillo, L.; Grassia, V.; Errico, S.; Lepore, M. Infrared spectroscopy characterization of gingival crevicula fluid during orthodontic treatment. J. Mol. Struct. 2019, 1176, 847–854. [Google Scholar] [CrossRef]
- Camerlingo, C.; Portaccio, M.; d’Apuzzo, F.; Nucci, L.; Perillo, L.; Lepore, M. μ-FTIR, μ-Raman, and SERS analysis of Amide I spectral region in oral biofluid samples during orthodontic treatment. Sensors 2022, 22, 7874. [Google Scholar] [CrossRef] [PubMed]
- Blackwell, J.; Vasko, P.D.; Koenig, J.L. Infrared and Raman Spectra of the Cellulose from the Cell Wall of Valonia ventricosa. J. Appl. Phys. 1970, 41, 4375–4379. [Google Scholar] [CrossRef]
Disclaimer/Publisher’s Note: The statements, opinions and data contained in all publications are solely those of the individual author(s) and contributor(s) and not of MDPI and/or the editor(s). MDPI and/or the editor(s) disclaim responsibility for any injury to people or property resulting from any ideas, methods, instructions or products referred to in the content. |
© 2023 by the authors. Licensee MDPI, Basel, Switzerland. This article is an open access article distributed under the terms and conditions of the Creative Commons Attribution (CC BY) license (https://creativecommons.org/licenses/by/4.0/).