
Performance Evaluation of a Specialized Pressure Sensor for Pick and Place Operations †


Abstract
:1. Introduction
2. Materials and Methods
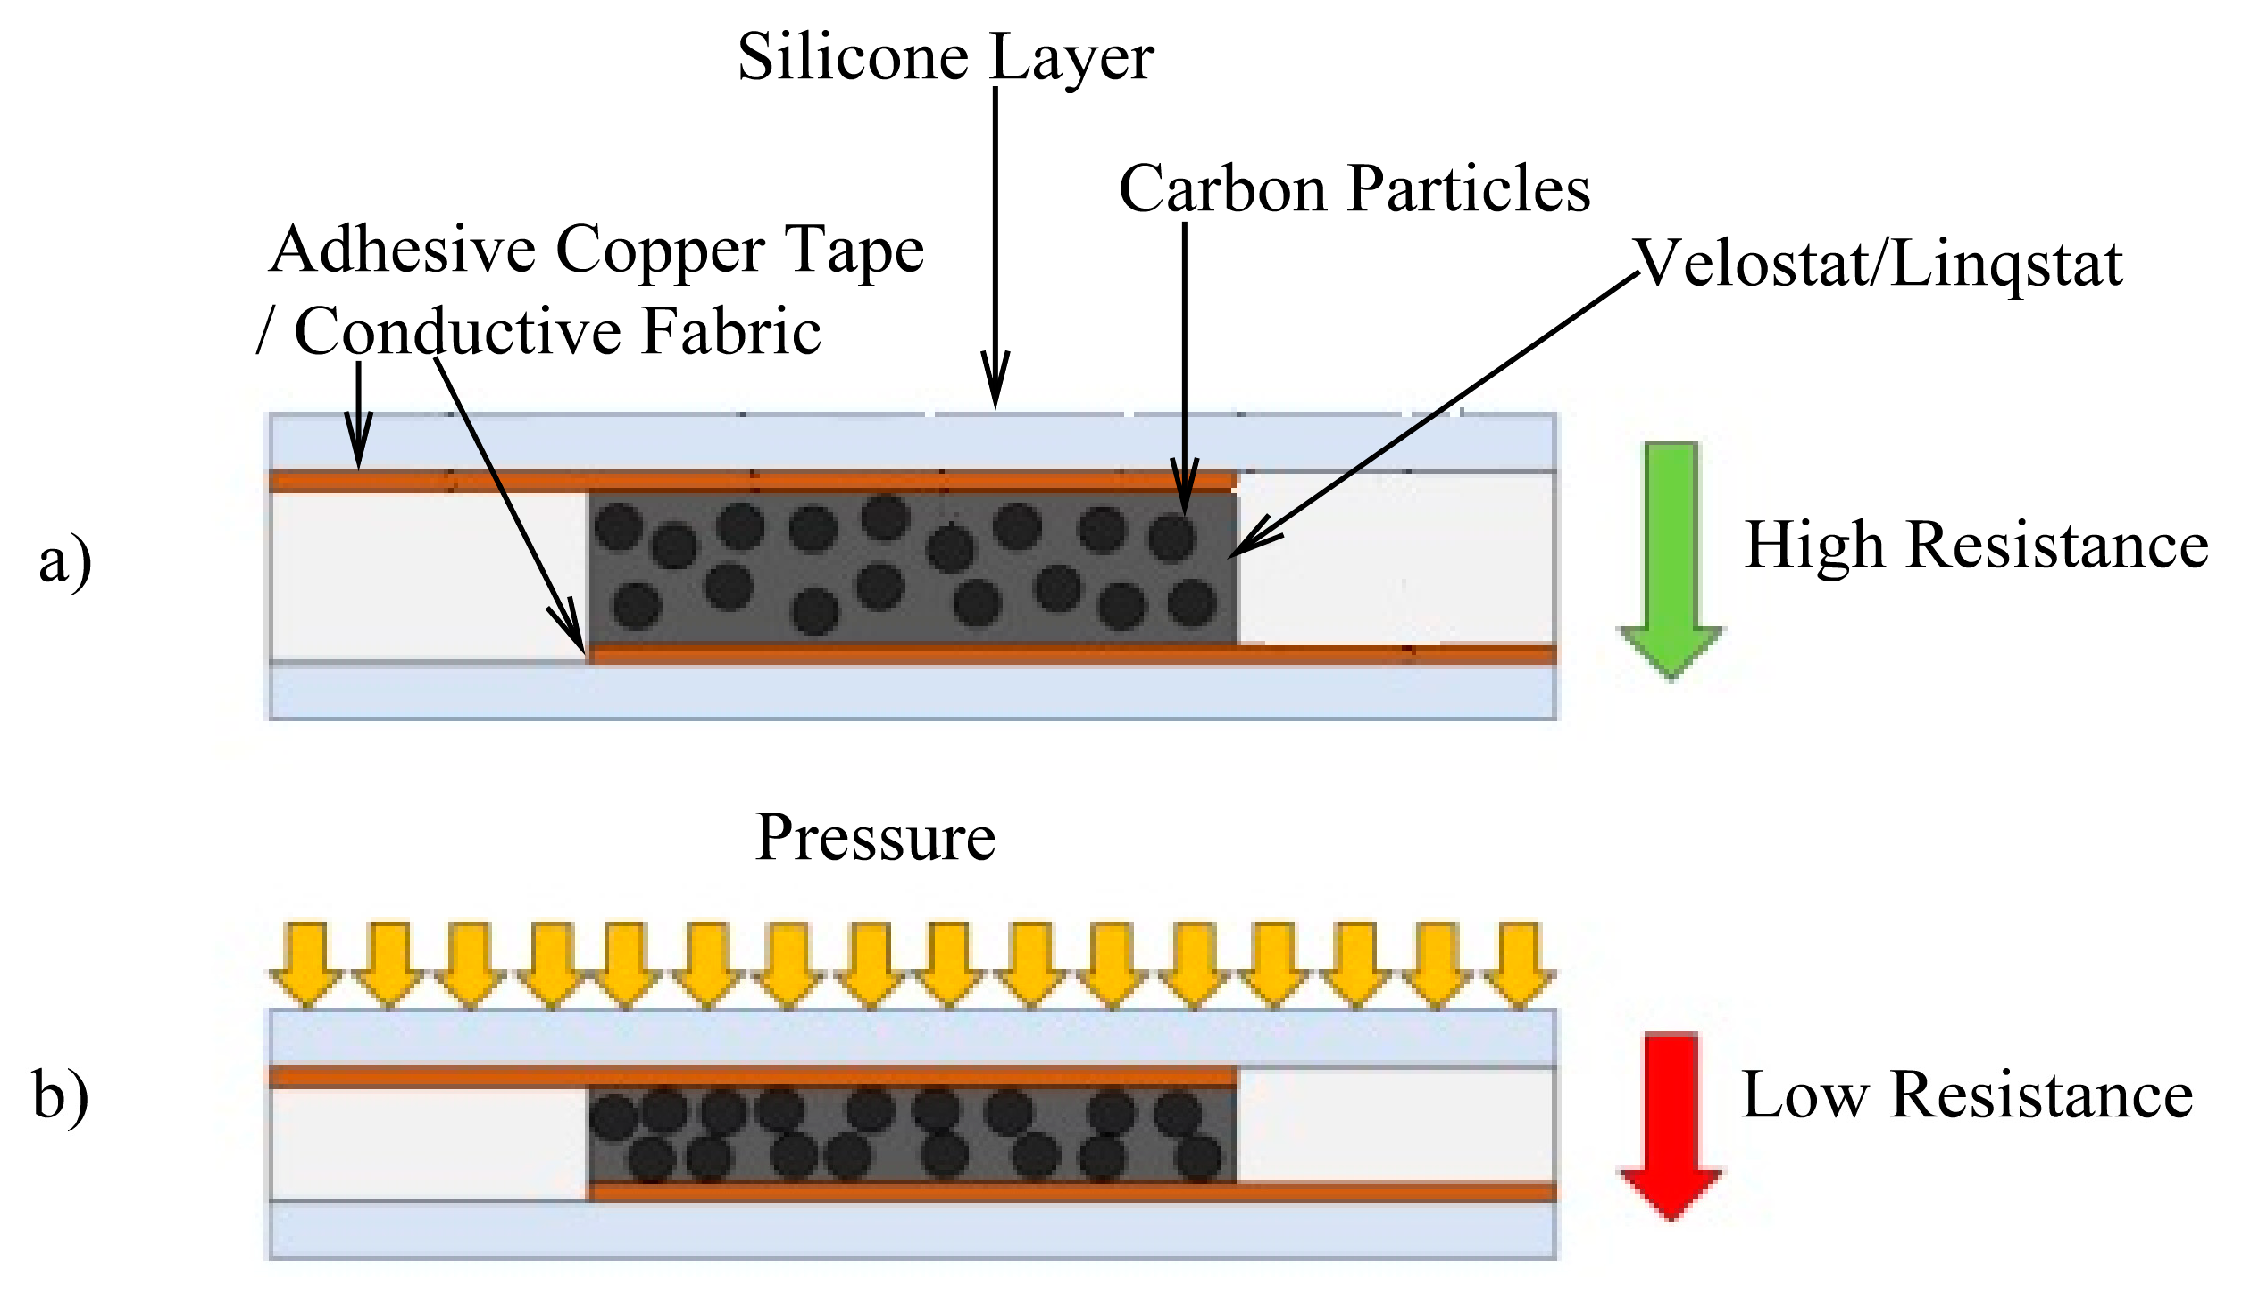
2.1. Sensor Fabrication
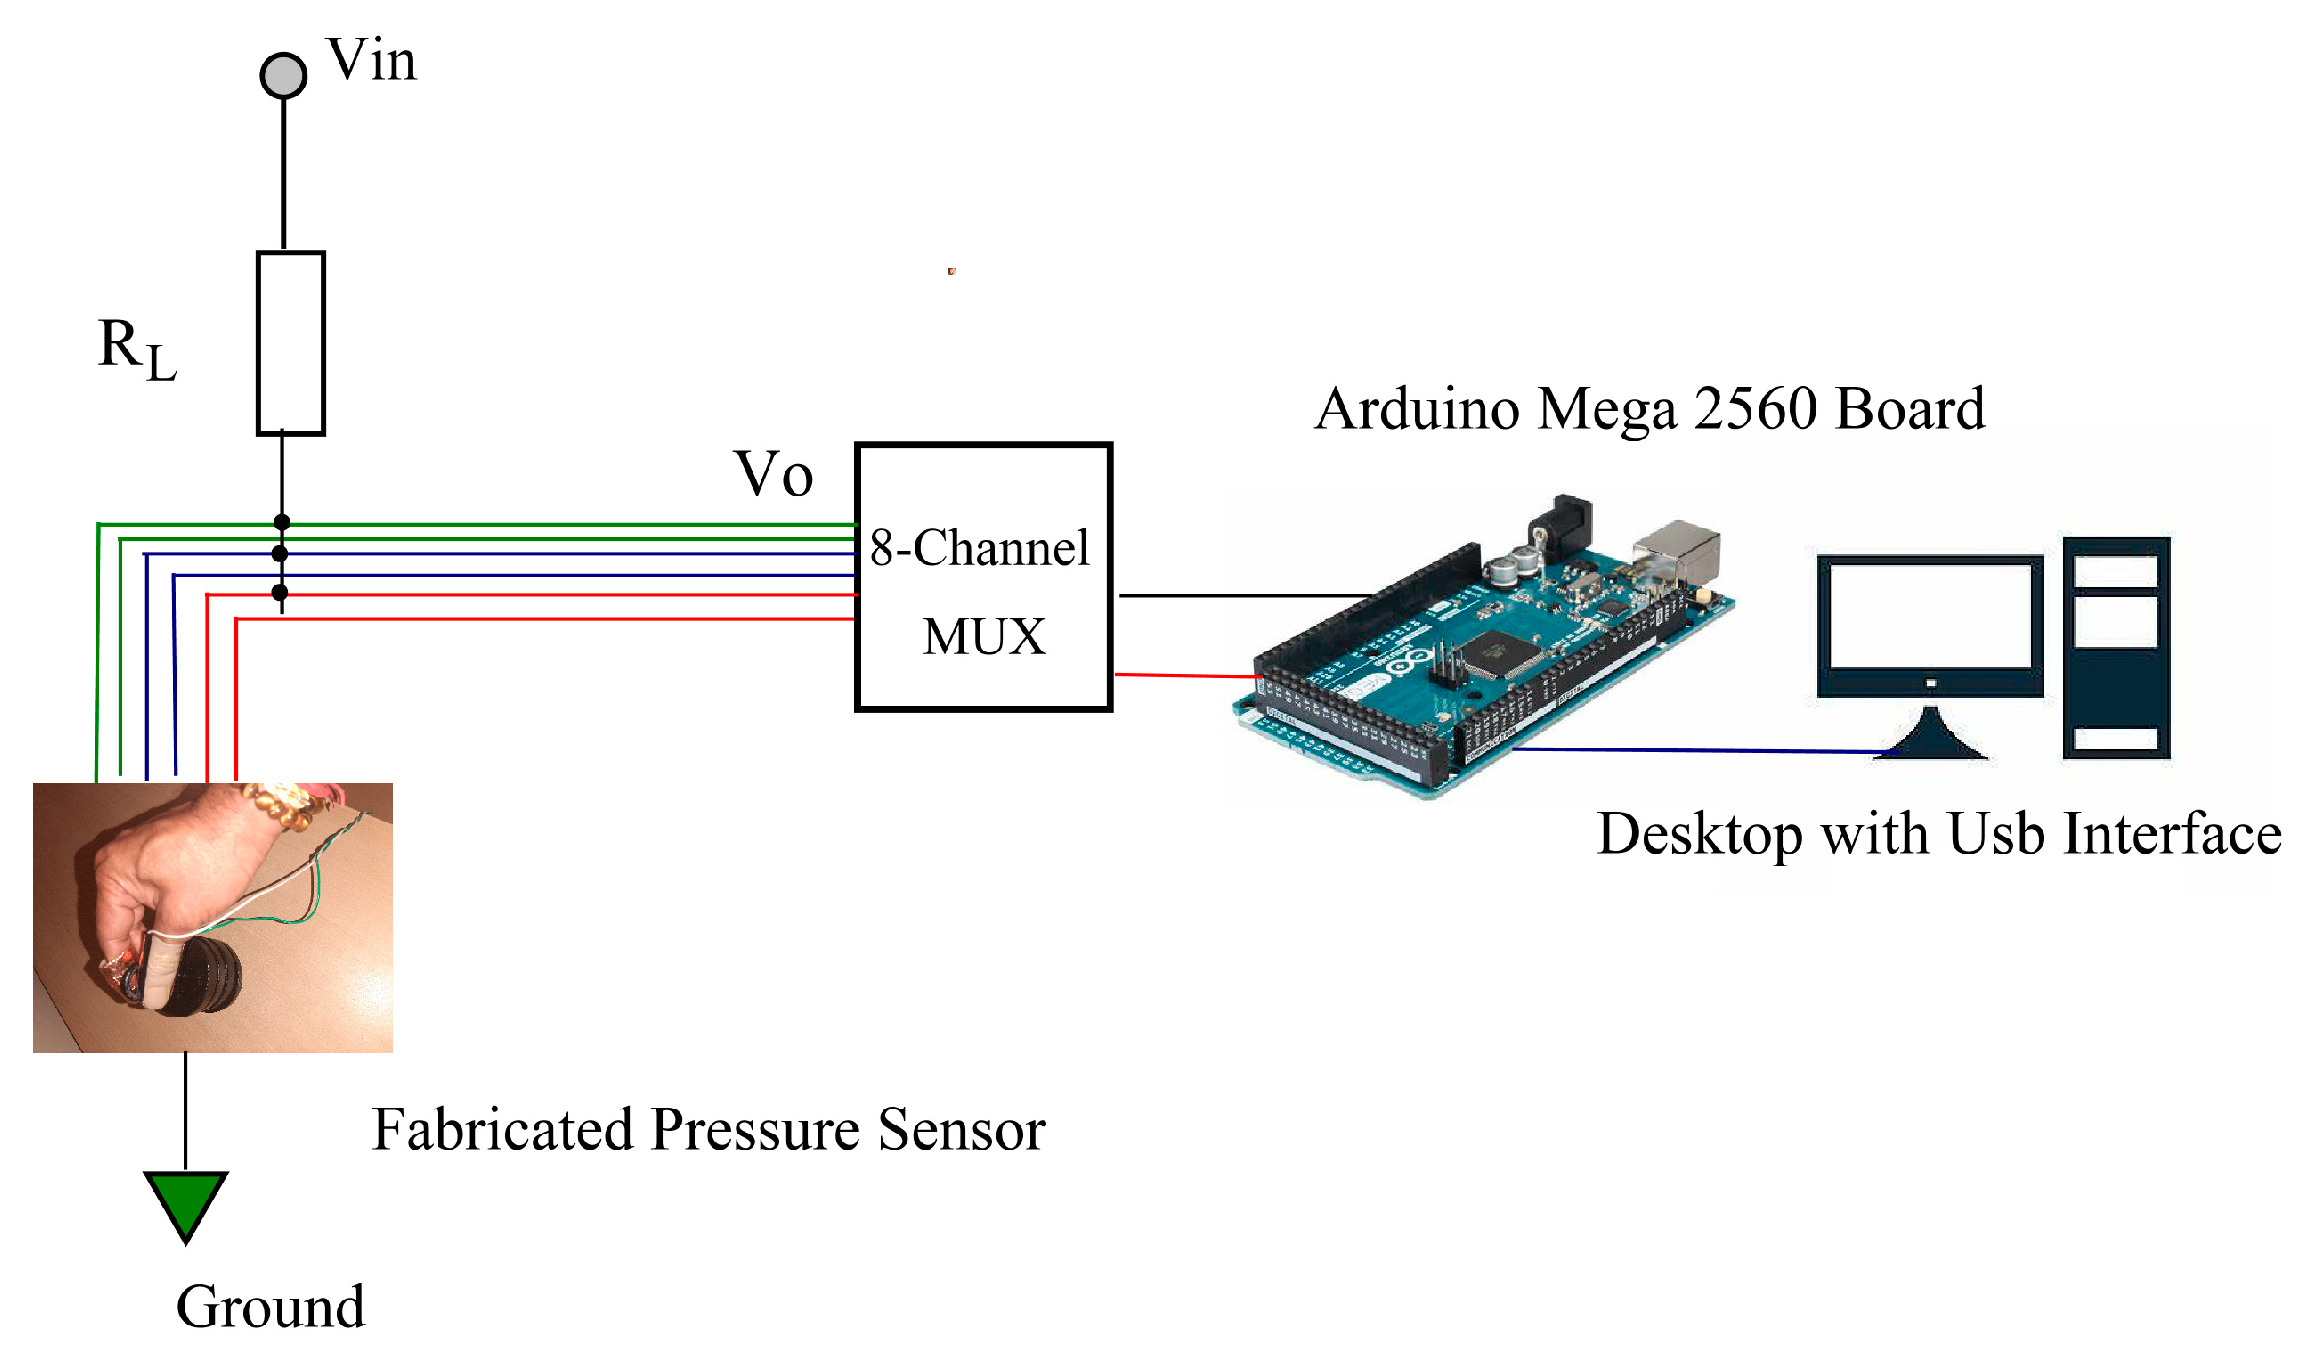
2.2. Design Parameters of Conditioning Circuit
2.3. Experimental Design Parameters [8,9,10]
2.3.1. Hysteresis
2.3.2. Drift
2.3.3. Repeatability
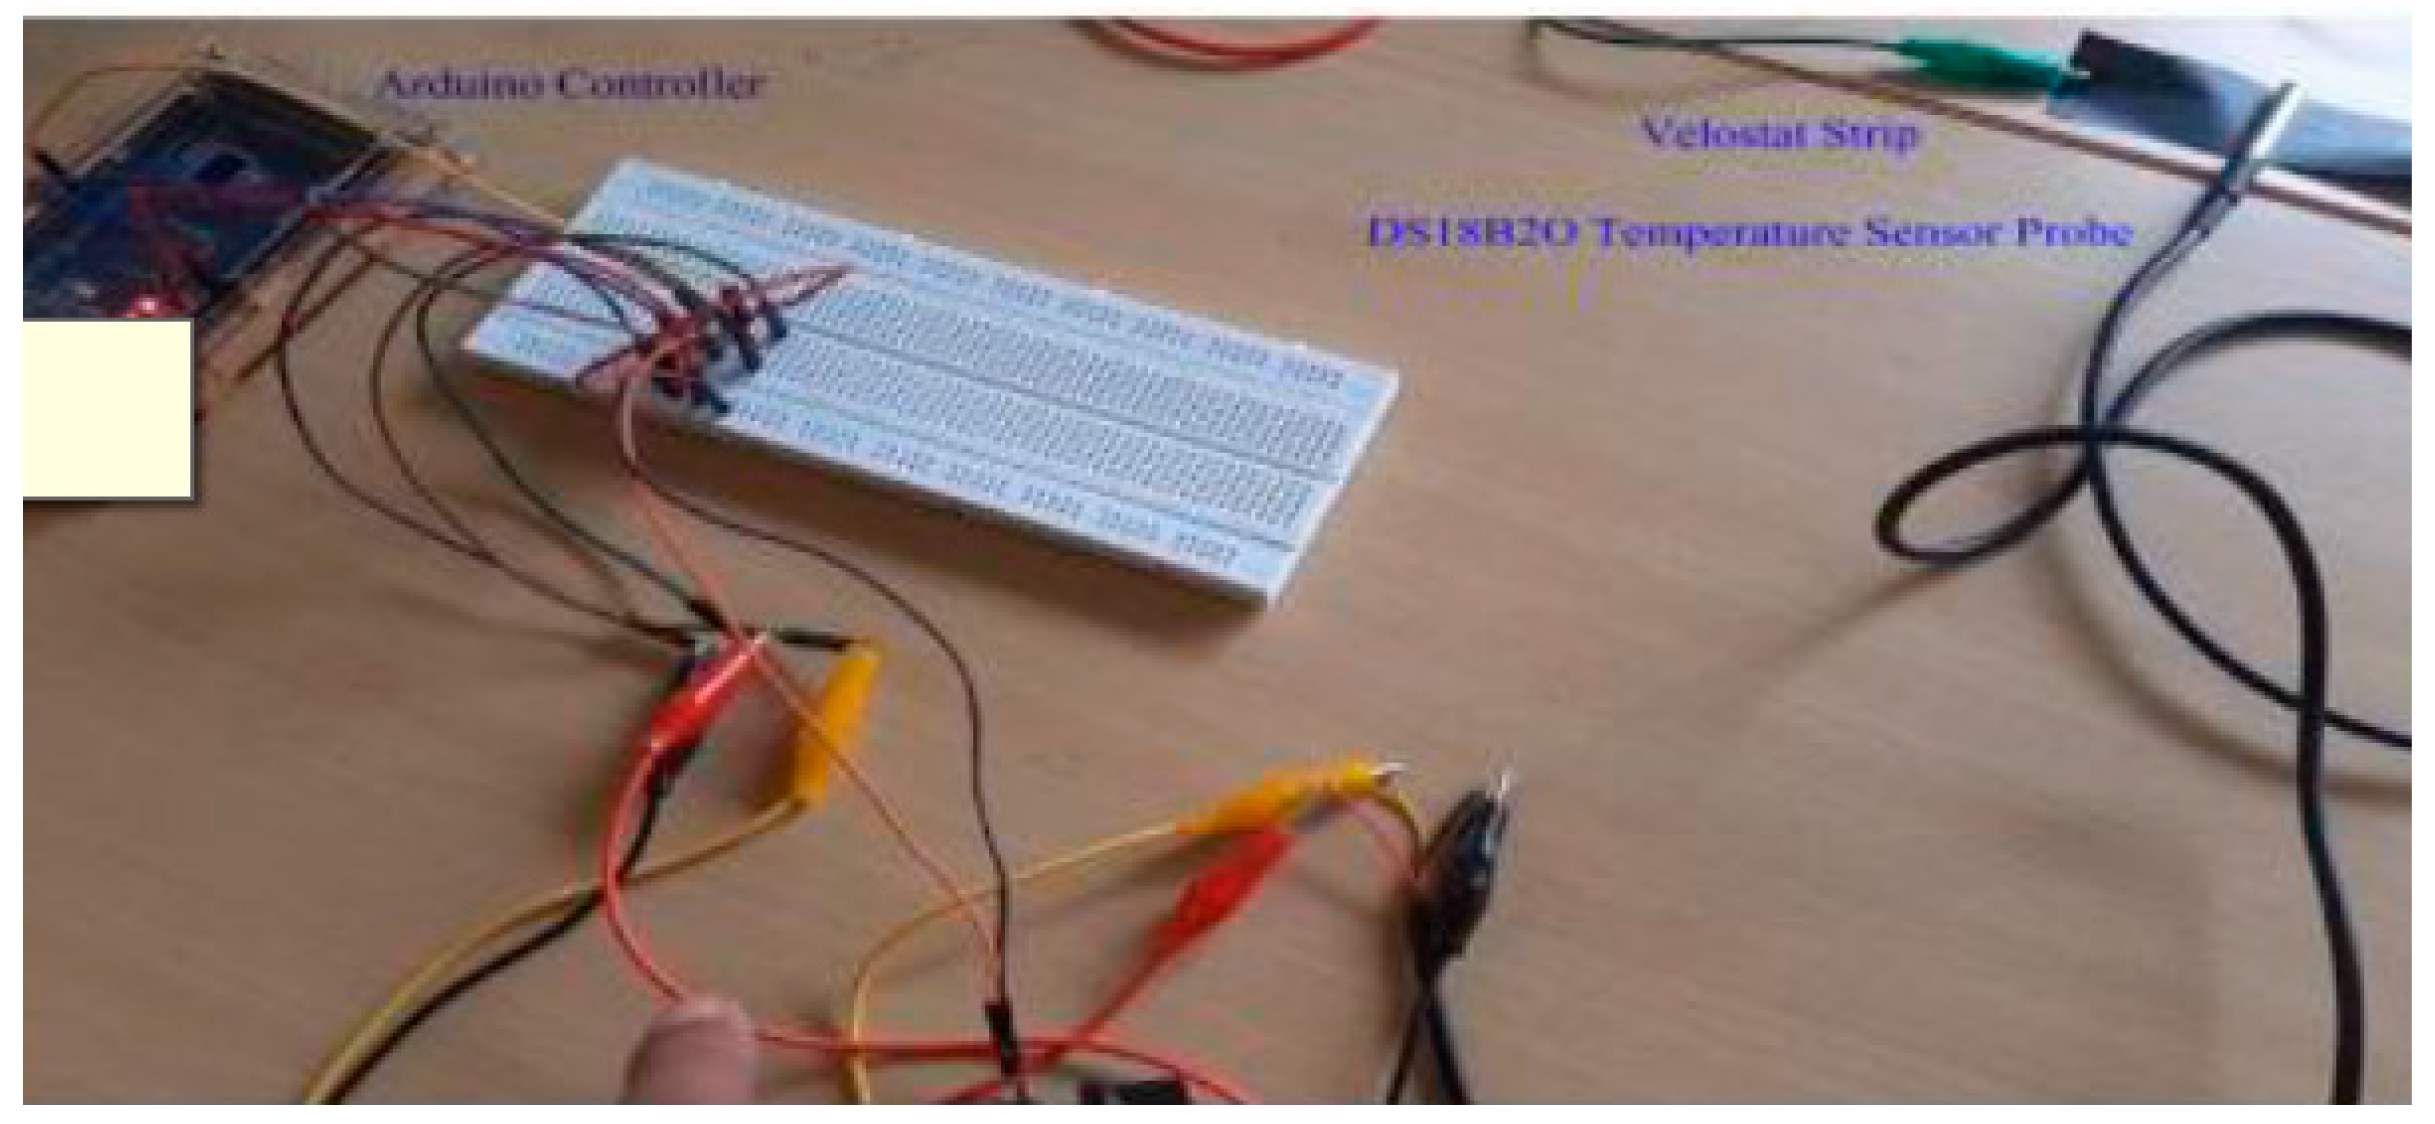
2.3.4. Effect of Temperature
2.4. Experimental Methods
2.4.1. Pre-Commissioning Test
2.4.2. Pre- and Post-Commissioning Tests
Calculations
3. Results and Discussion
4. Conclusions
Author Contributions
Funding
Institutional Review Board Statement
Informed Consent Statement
Data Availability Statement
Acknowledgments
Conflicts of Interest
References
- Tao, L.Q.; Zhang, K.N.; Tian, H.; Liu, Y.; Wang, D.Y.; Chen, Y.Q.; Yang, Y.; Ren, T.L. Graphene-paper pressure sensor for detecting human motions. ACS Nano 2017, 11, 8790–8795. [Google Scholar] [CrossRef] [PubMed]
- Ruth SR, A.; Feig, V.R.; Tran, H.; Bao, Z. Micro engineering pressure sensor active layers for improved performance. Adv. Funct. Mater. 2020, 30, 2003491. [Google Scholar] [CrossRef]
- Li, J.; Bao, R.; Tao, J.; Peng, Y.; Pan, C. Recent progress in flexible pressure sensor arrays: From design to applications. J. Mater. Chem. C 2018, 6, 11878–11892. [Google Scholar] [CrossRef]
- Li, R.; Zhou, Q.; Bi, Y.; Cao, S.; Xia, X.; Yang, A.; Xiao, X. Research progress of flexible capacitive pressure sensor for sensitivity enhancement approaches. Sens. Actuators A Phys. 2021, 321, 112425. [Google Scholar] [CrossRef]
- Luo, Z.P.; Berglund, L.J.; An, K.N. Validation of F-Scan pressure sensor system: A technical note. J. Rehabil. Res. Dev. 1998, 35, 186–191. [Google Scholar] [PubMed]
- Patra, J.C.; Kot, A.C.; Panda, G. An intelligent pressure sensor using neural networks. IEEE Trans. Instrum. Meas. 2000, 49, 829–834. [Google Scholar] [CrossRef]
- Shirinov, A.V.; Schomburg, W.K. Pressure sensor from a PVDF film. Sens. Actuators A Phys. 2008, 142, 48–55. [Google Scholar] [CrossRef]
- Hopkins, M.; Vaidyanathan, R.; Mcgregor, A.H. Examination of the performance characteristics of velostat as an in-socket pressure sensor. IEEE Sensors J. 2020, 20, 6992–7000. [Google Scholar] [CrossRef]
- Zang, Y.; Zhang, F.; Di, C.A.; Zhu, D. Advances of flexible pressure sensors toward artificial intelligence and health care applications. Mater. Horiz. 2015, 2, 140–156. [Google Scholar] [CrossRef]
- Ashruf, C.M.A. Thin flexible pressure sensors. Sensor Rev. 2002, 22, 322–327. [Google Scholar] [CrossRef]
- Vehec, I.; Livovsky, L. Flexible resistive sensor based on velostat. In Proceedings of the 2020 43rd International Spring Seminar on Electronics Technology (ISSE), Demanovska Valley, Slovakia, 14–15 May 2020; pp. 1–6. [Google Scholar]
- Giovanelli, D.; Farella, E. Force sensing resistor and evaluation of technology for wearable body pressure sensing. J. Sens. 2016, 2016, 9391850. [Google Scholar] [CrossRef]
- Fatema, A.; Poondla, S.; Mishra, R.B.; Hussain, A.M. A low-cost pressure sensor matrix for activity monitoring in stroke patients using artificial intelligence. IEEE Sensors J. 2021, 21, 9546–9552. [Google Scholar] [CrossRef]
- Yuan, L.; Qu, H.; Li, J. Velostat Sensor Array for Object Recognition. IEEE Sens. J. 2022, 22, 1692–1704. [Google Scholar] [CrossRef]
- Sergio, M.; Manaresi, N.; Tartagni, M.; Guerrieri, R.; Canegallo, R. A textile based capacitive pressure sensor. Sensors 2002, 2, 1625–1630. [Google Scholar]
- Gála, M.; Barabáš, J.; Kopásková, M. User presence monitoring based on Velostat pressure sensors and Arduino platform. In Proceedings of the 2020 IEEE 21st International Conference on Computational Problems of Electrical Engineering (CPEE), Online Conference, Poland, 16–19 September 2020; pp. 1–3. [Google Scholar]
- Salibindla, S.; Ripoche, B.; Lai, D.T.; Maas, S. Characterization of a new flexible pressure sensor for body sensor networks. In Proceedings of the 2013 IEEE Eighth International Conference on Intelligent Sensors, Sensor Networks and Information Processing, Melbourne, VIC, Australia, 2–5 April 2013; pp. 27–31. [Google Scholar]
- Chen, D.; Cai, Y.; Huang, M.C. Customizable pressure sensor array: Design and evaluation. IEEE Sensors J. 2018, 18, 6337–6344. [Google Scholar] [CrossRef]
- Li, Y.; Samad, Y.A.; Liao, K. From cotton to wearable pressure sensor. J. Mater. Chem. A 2015, 3, 2181–2187. [Google Scholar] [CrossRef]
- Meyer, J.; Lukowicz, P.; Troster, G. Textile pressure sensor for muscle activity and motion detection. In Proceedings of the 2006 10th IEEE International Symposium on Wearable Computers, Montreux, Switzerland, 11–14 October 2006; pp. 69–72. [Google Scholar]


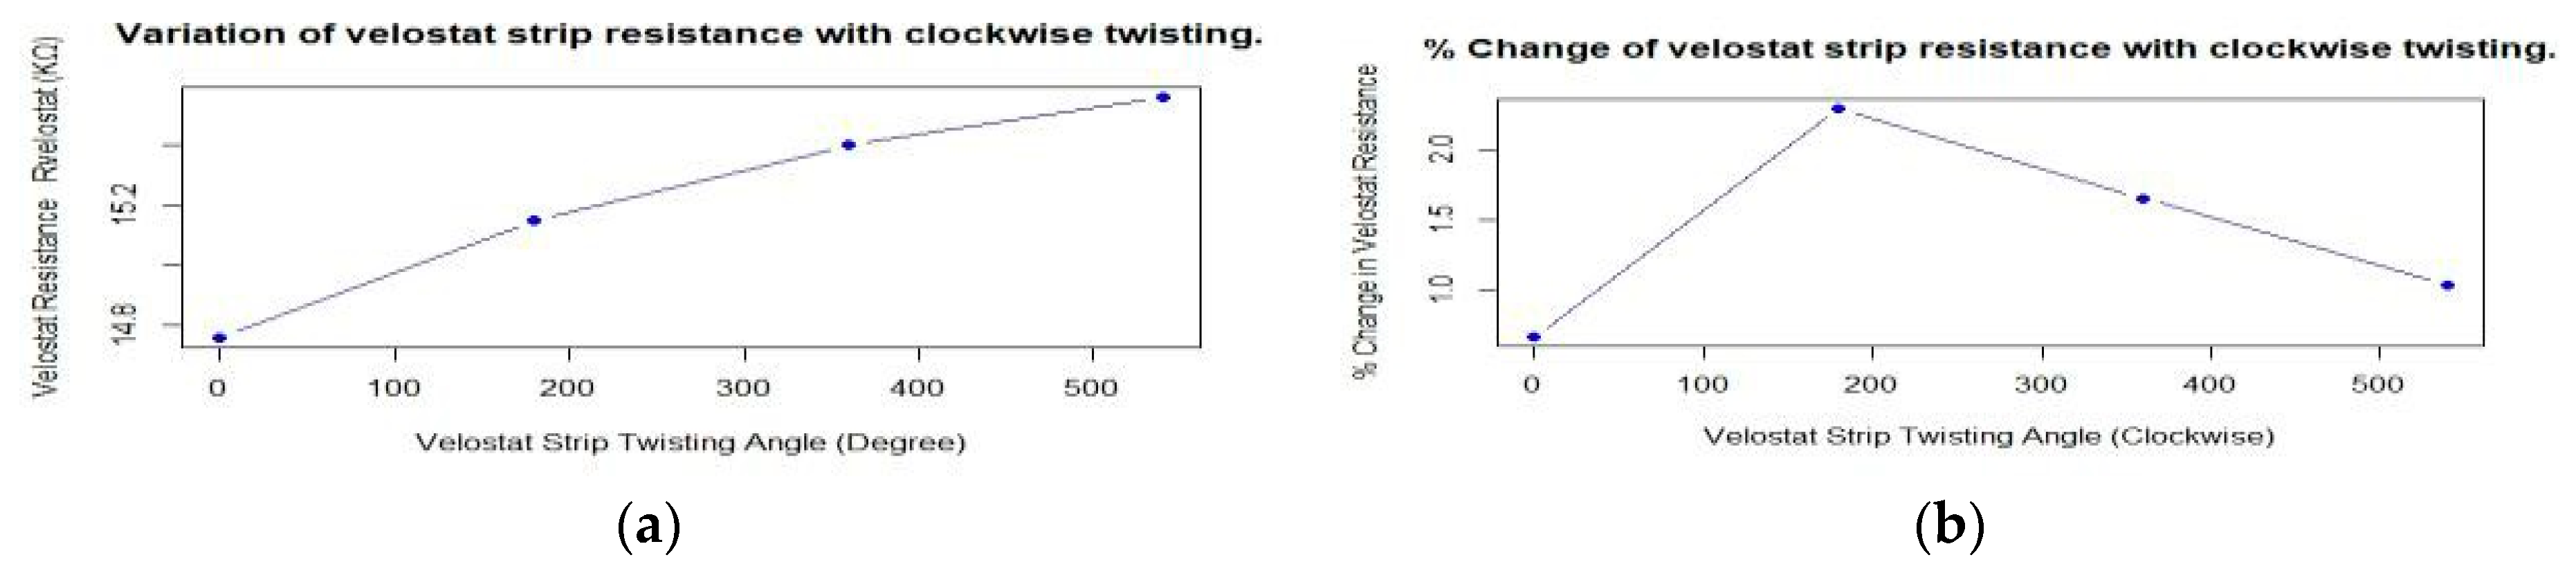
| S. No | Twisting Angle in Degree(Clockwise) | Rvelostat (KΩ) | % Change in Resistance (ΔRvelostat/Rvelostat) × 100% |
|---|---|---|---|
| 1 | 0° Twist (Flat Surface) | 14.70–14.81 | 0.673% |
| 2 | 180° Twist | 15.15 | 2.292% |
| 3 | 360° Twist | 15.40 | 1.655% |
| 4 | 540° Twist | 15.56 | 1.039% |
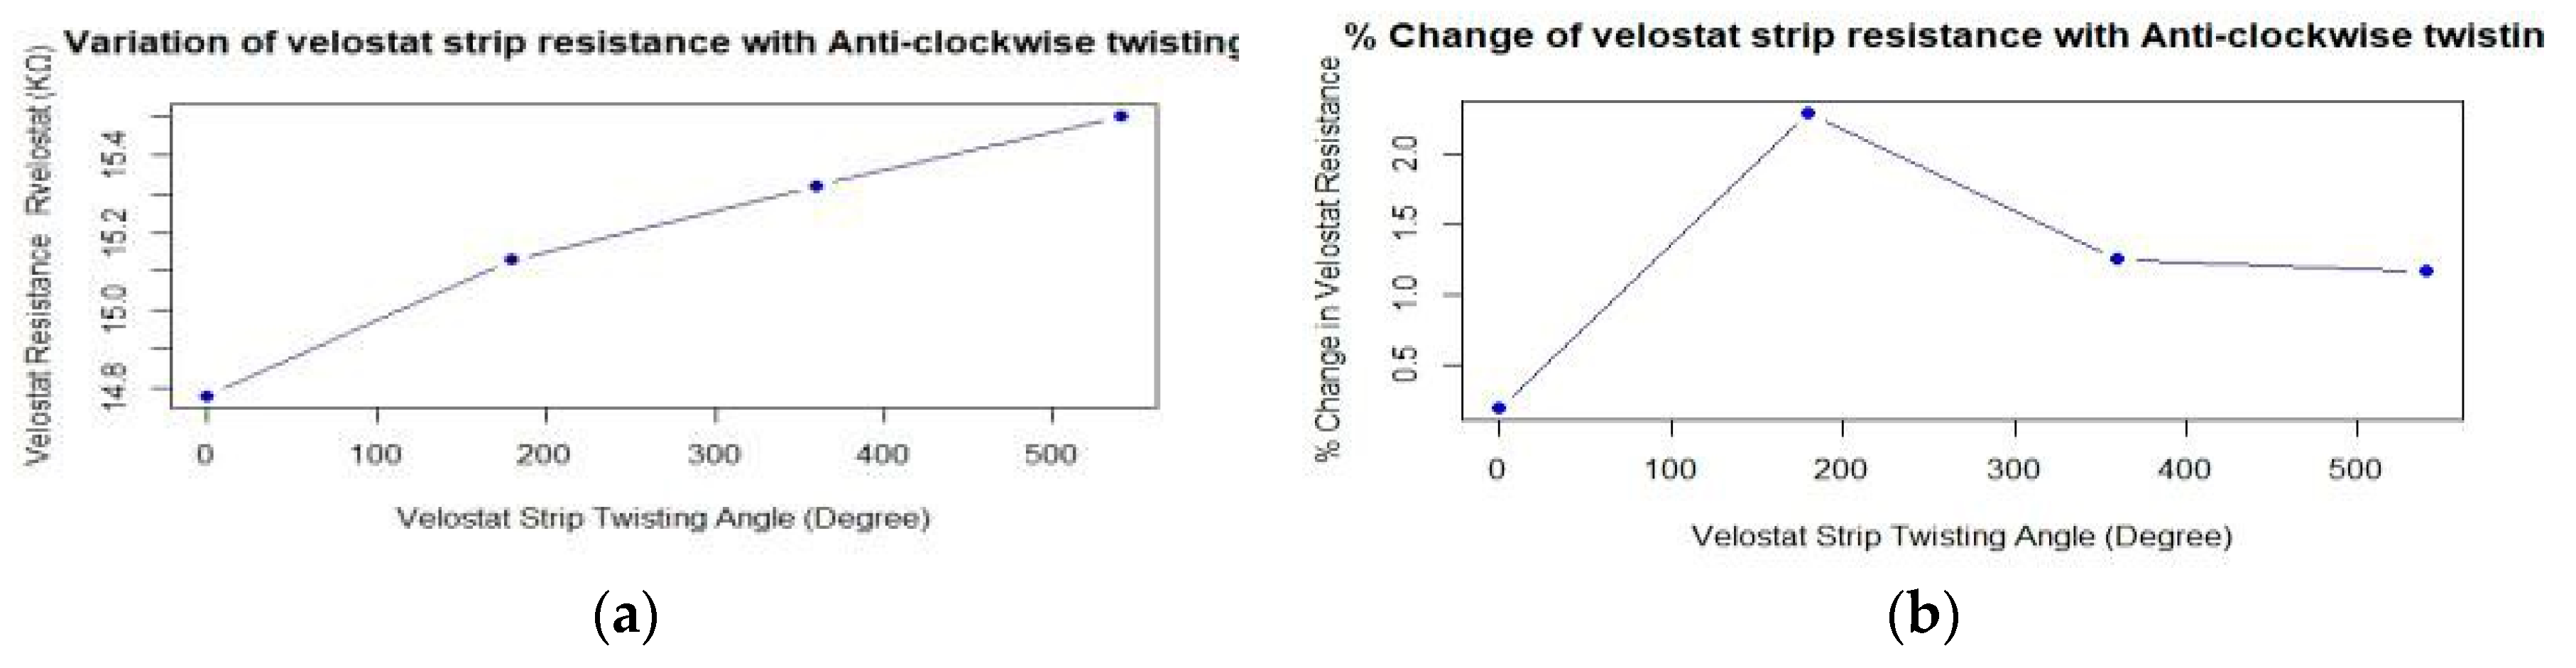
| S. No | Twisting Angle in Degree (Anti-Clockwise) | Rvelostat (KΩ) | % Change in Resistance (ΔRvelostat/Rvelostat) × 100% |
|---|---|---|---|
| 1 | 0° Twist (Flat Surface) | 14.77–14.80 | 0.673% |
| 2 | 180° Twist | 15.13 | 2.292% |
| 3 | 360° Twist | 15.32 | 1.655% |
| 4 | 540° Twist | 15.50 | 1.039% |
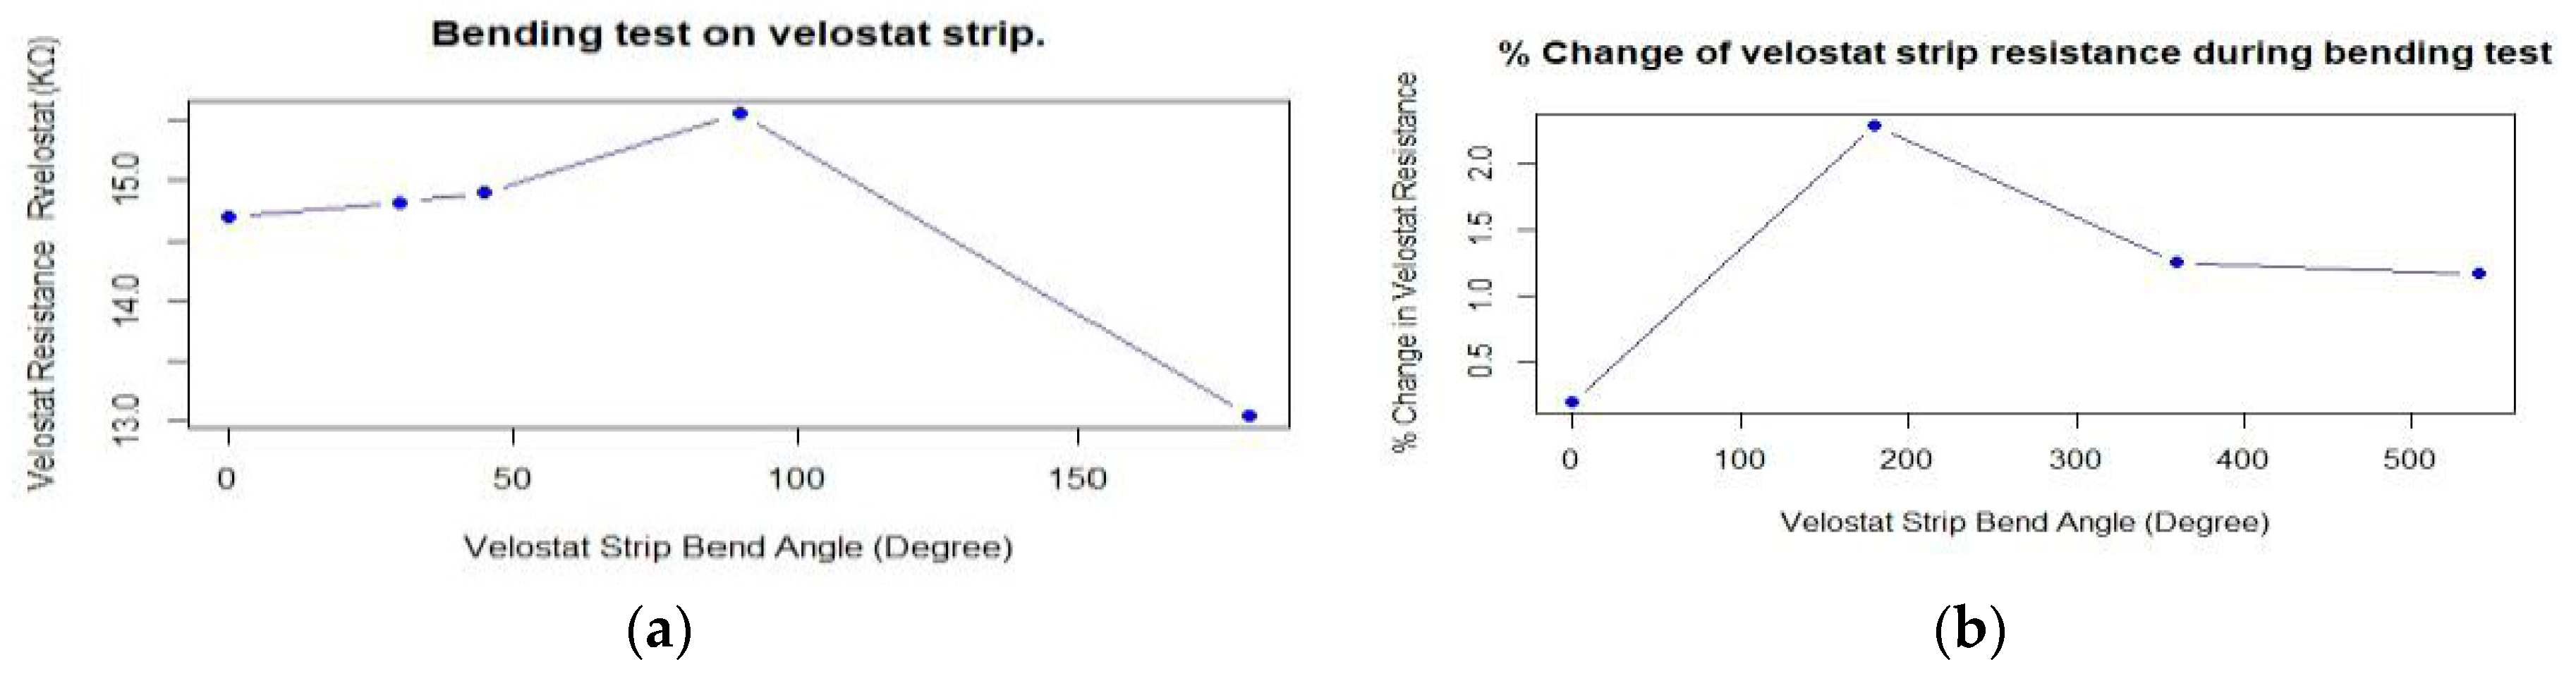
| S. No | Bend Angle (Degree) | Rvelostat (KΩ) | % Change in Velostat Resistance (ΔRvelostat/Rvelostat) × 100% |
|---|---|---|---|
| 1 | 0° (Flat Surface) | 14.70 | 0.673% |
| 2 | 30° (Light Bend) | 14.82 | 2.297% |
| 3 | 45° (Moderate bend) | 14.90 | 1.256% |
| 4 | 90° (Omega Bend) | 15.56 | 1.173% |
| 5 | Pinch Bend | 13.05 | −16.124% |
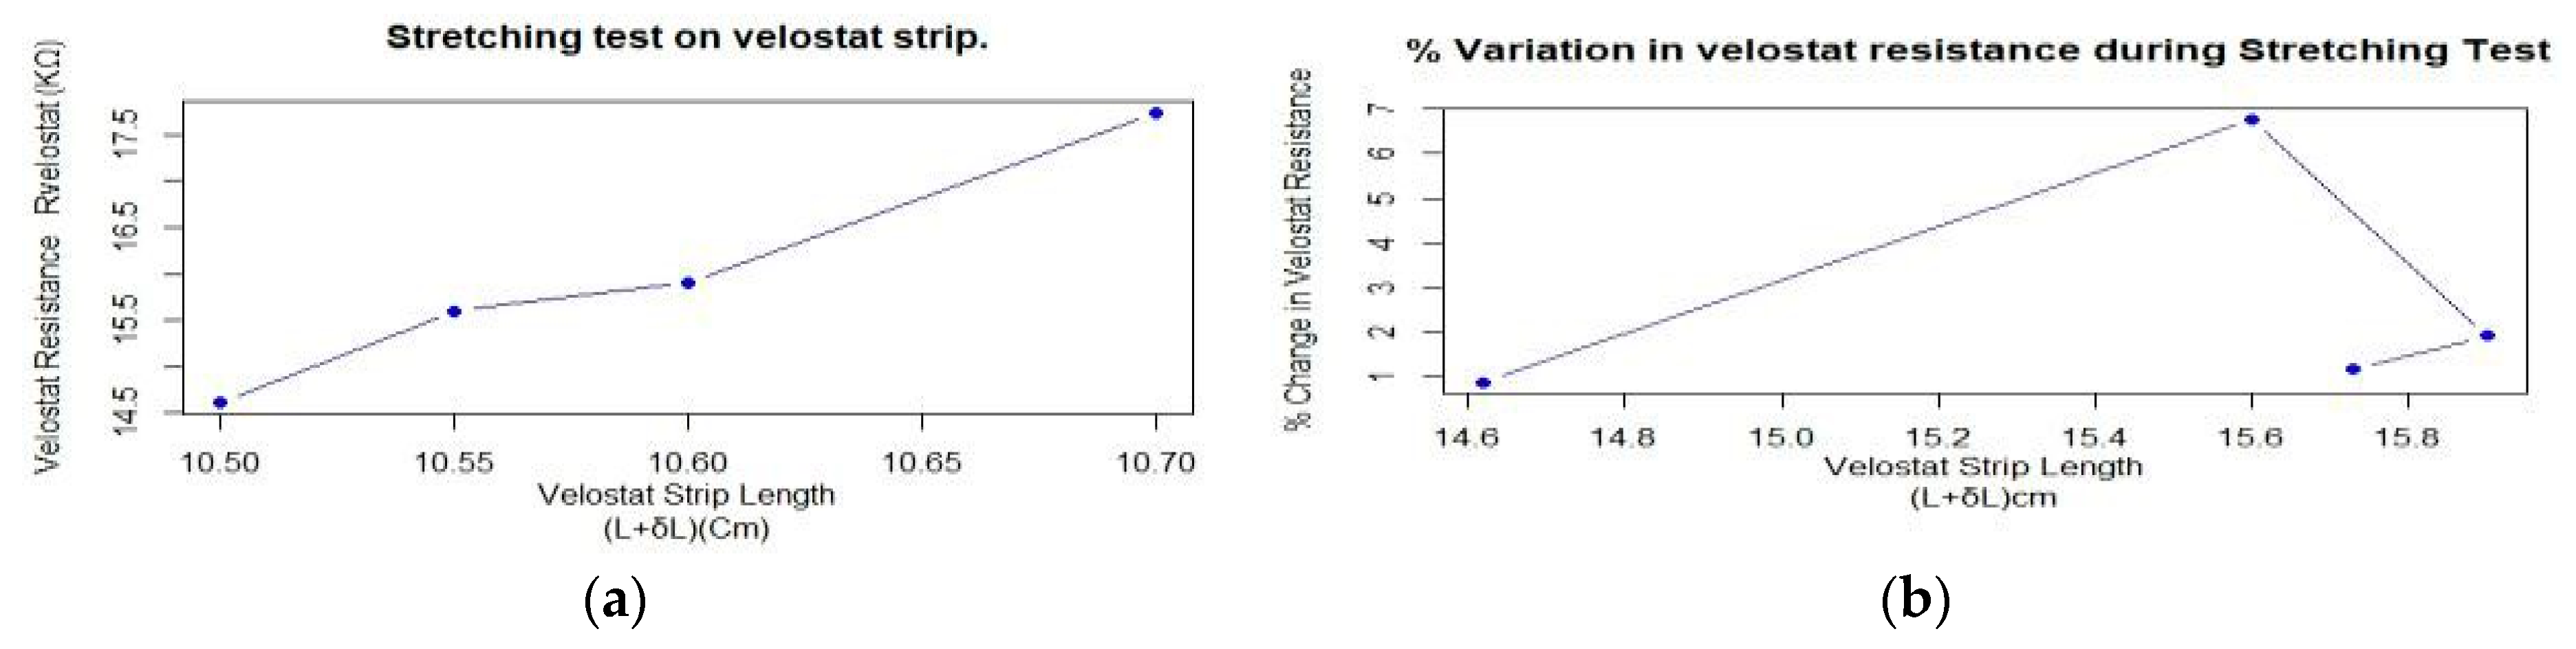
| S. No | Velostat Strip Length (L + δL) cm | Rvelostat (KΩ) | % Change in Velostat Resistance (ΔRvelostat/Rvelostat) × 100 |
|---|---|---|---|
| 1 | No Stretch (10.5) | 14.55–14.68 | 0.855% |
| 2 | Light Stretch (10.55) | 15.60 | 6.768% |
| 3 | Med. Stretch (10.6) | 15.90 | 1.923% |
| 4 | High Stretch (10.7) | 15.73 | 1.173% |
| 5 | Pinch Bend | 13.05 | −16.124% |
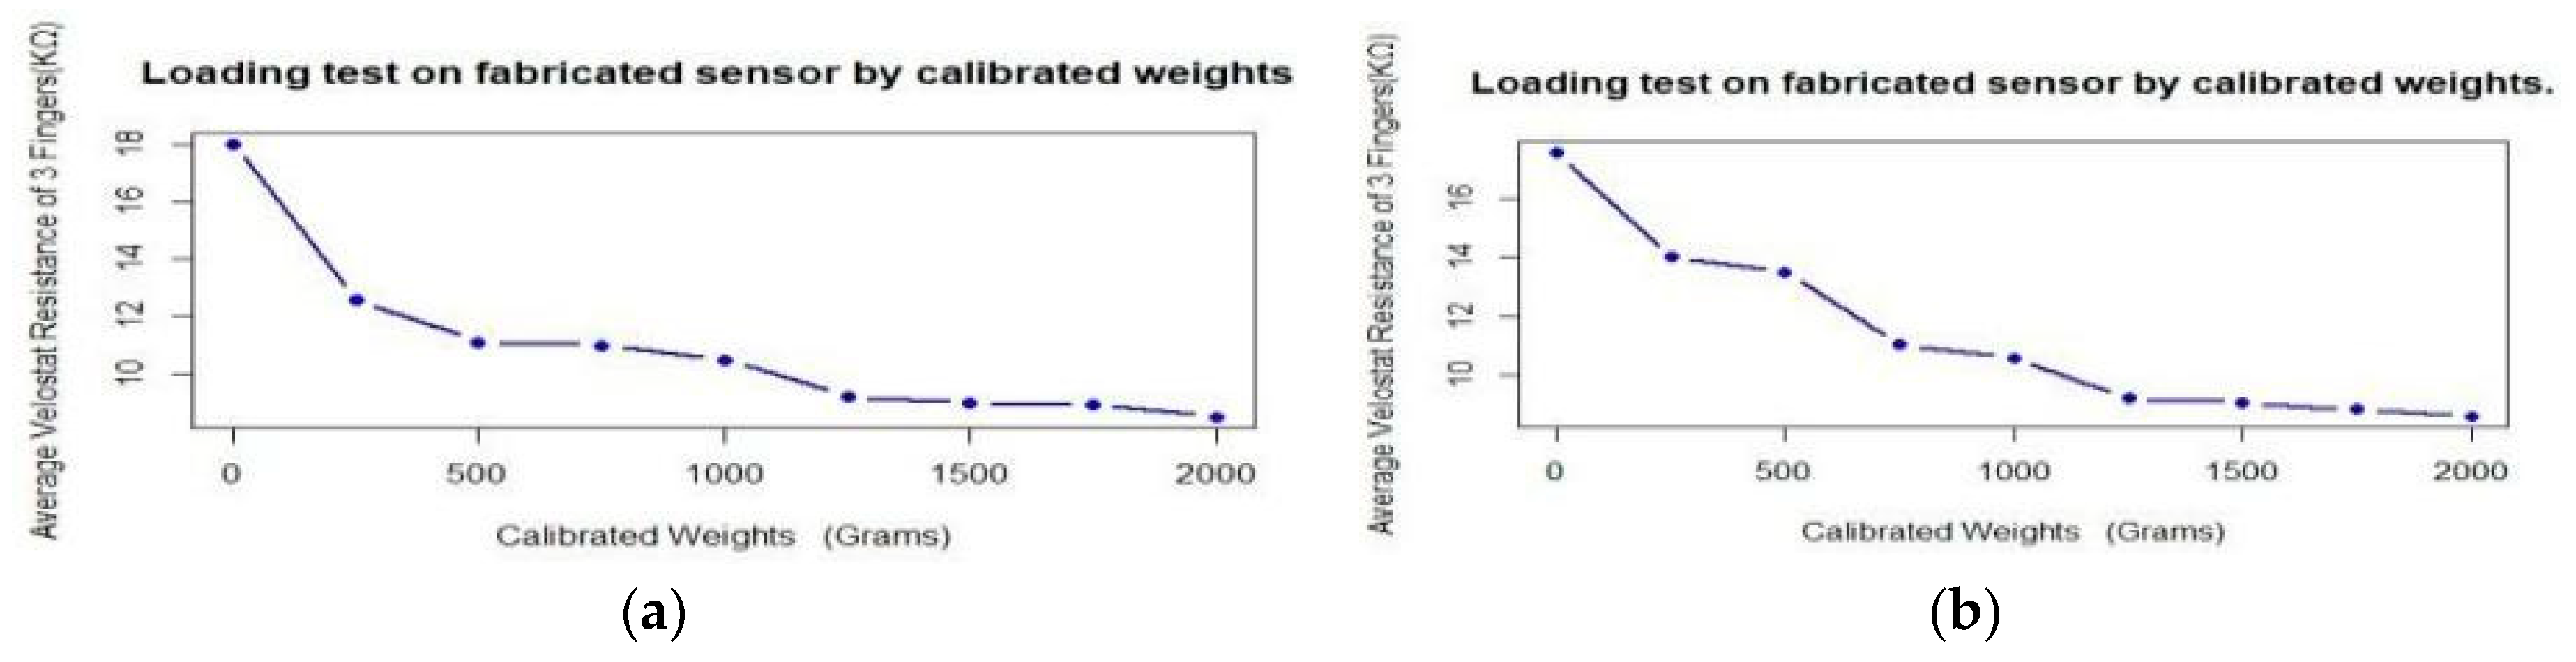
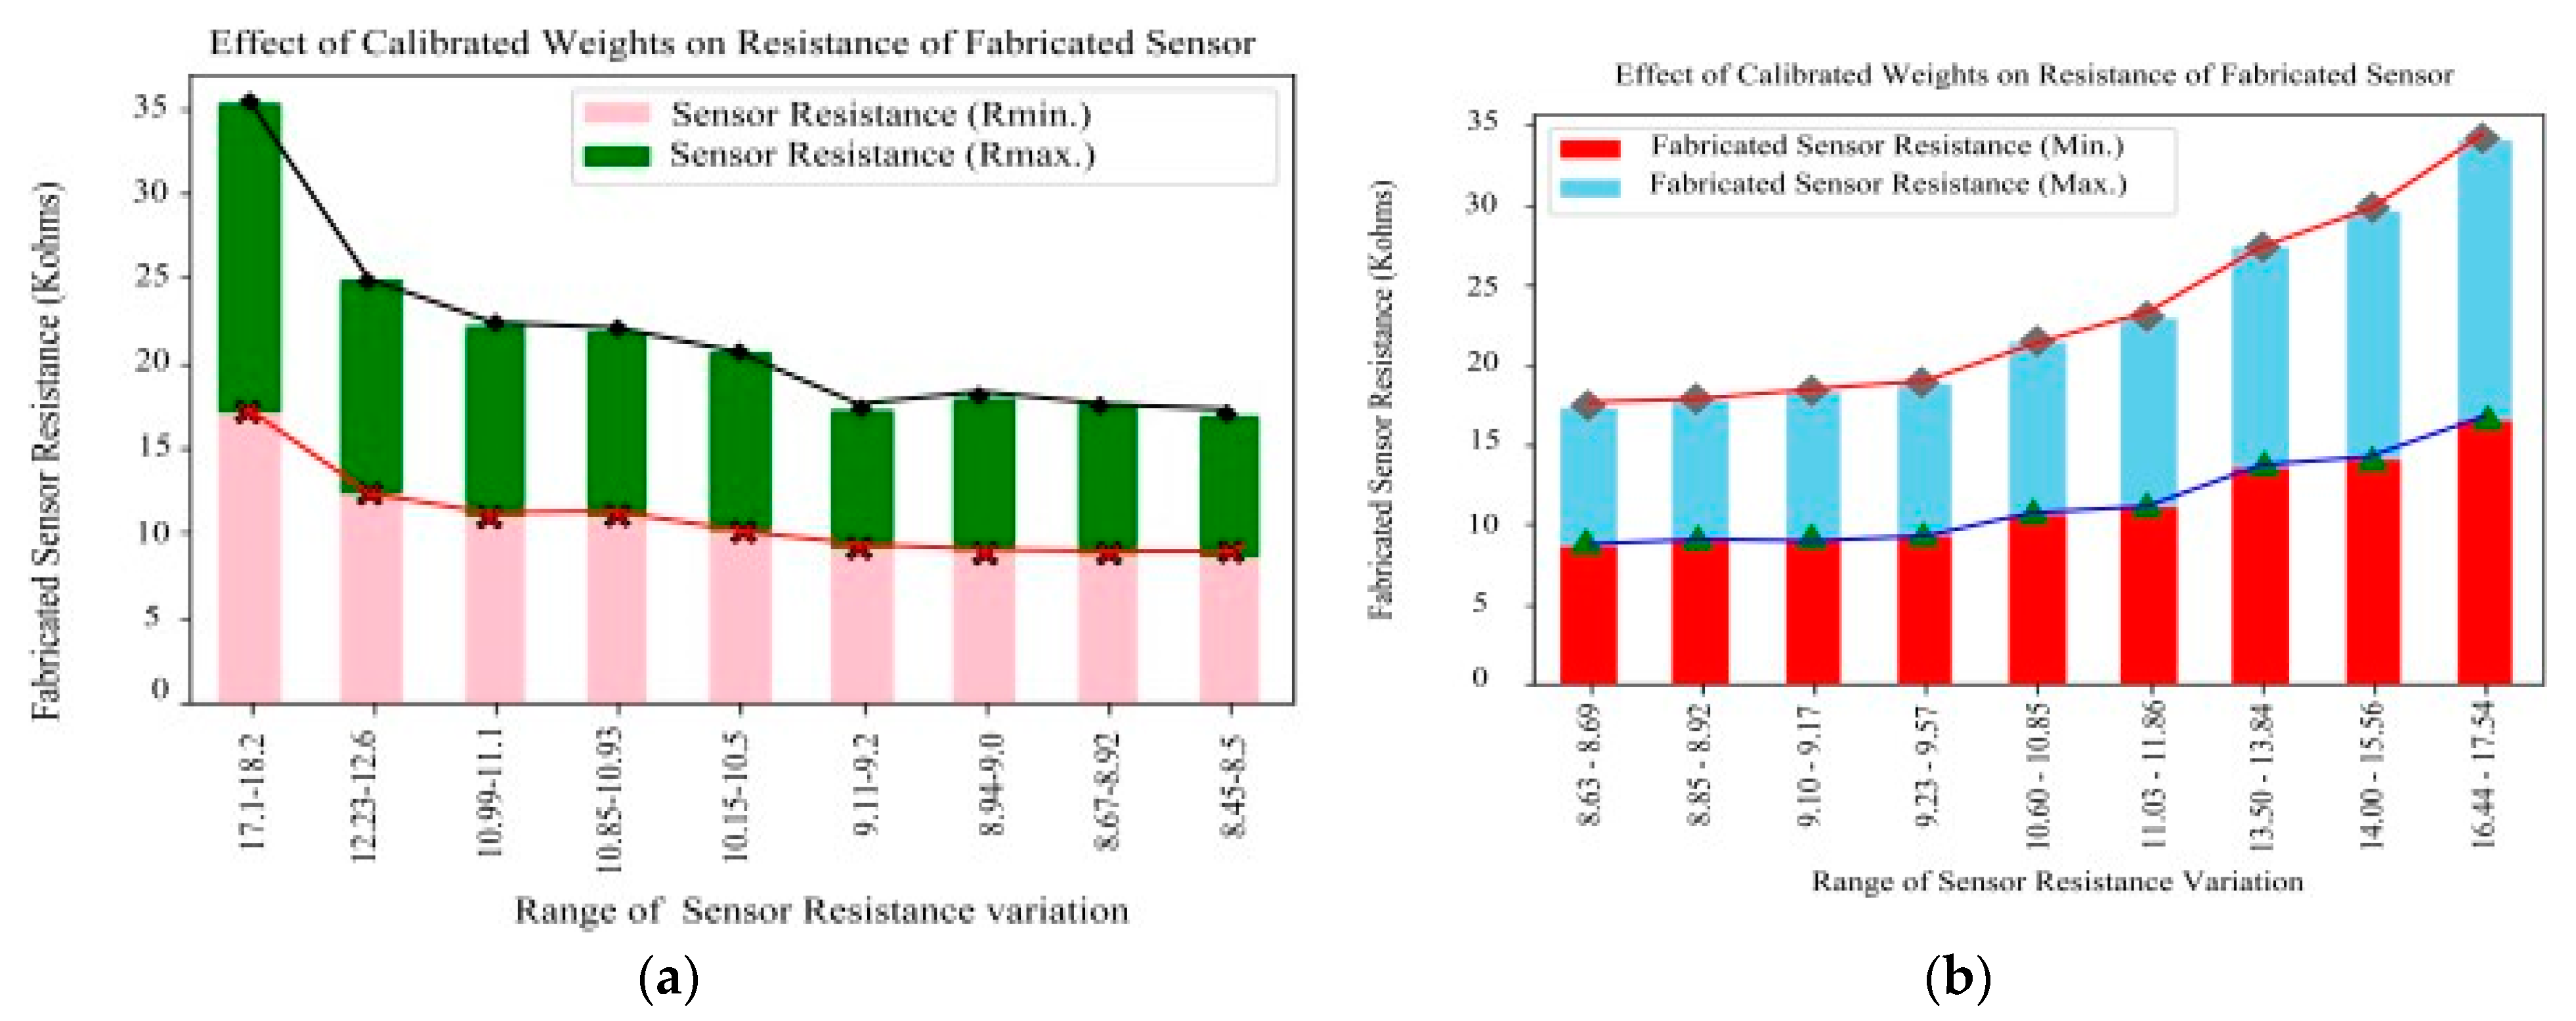
| S. No | Calibrated Weights (Grams) | Resistance Range Rvelostat (KΩ) | % Change in Resistance (ΔRvelostat/Rvelostat) × 100 |
|---|---|---|---|
| 1 | 0 | 17.1–18.2 | −30% |
| 2 | 250 | 12.23–12.60 | −11.90% |
| 3 | 500 | 10.99–11.10 | −0.09% |
| 4 | 750 | 10.85–10.93 | −4.55% |
| 5 | 1000 | 10.15–10.50 | −12.38% |
| 6 | 1250 | 9.11–9.20 | −2.17% |
| 7 | 1500 | 8.94–9.00 | −0.89% |
| 8 | 1750 | 8.67–8.92 | −4.71% |
| 9 | 2000 | 8.45–8.50 | 0% |
| S. No | Calibrated Weights (Grams) | Resistance Range Rvelostat (KΩ) | % Change in Resistance (ΔRvelostat/Rvelostat) × 100 |
|---|---|---|---|
| 1 | 2000 | 8.63–8.69 | 0% |
| 2 | 1750 | 8.85–8.92 | 2.55% |
| 3 | 1500 | 9.10–9.17 | 2.83% |
| 4 | 1250 | 9.23–9.57 | 1.43% |
| 5 | 1000 | 10.60–10.85 | 14.84% |
| 6 | 750 | 11.03–11.86 | 4.06% |
| 7 | 500 | 13.50–13.84 | 22.40% |
| 8 | 250 | 14.00–15.56 | 3.70% |
| 9 | 0 | 16.44–17.54 | 25.29% |
| S. No | Ambience Temperature in Degree Celsius | Rvelostat (KΩ) | % Change in Resistance (ΔRvelostat/Rvelostat) × 100 |
|---|---|---|---|
| 1 | 24.44 (Room Temp.) | 13.1 | 0% |
| 2 | 27 | 14.2 | 8.40% |
| 3 | 32 | 14.7 | 3.52% |
| 4 | 37 | 15.3 | 3.92% |
| 5 | 42 | 18.7 | 22.22% |
| 6 | 47 | 21.9 | 17.10% |
| 7 | 52 | 26.1 | 19.18% |
| 8 | 57 | 20.4 | −21.83% |
| 9 | 62 | 18.5 | −9.31% |
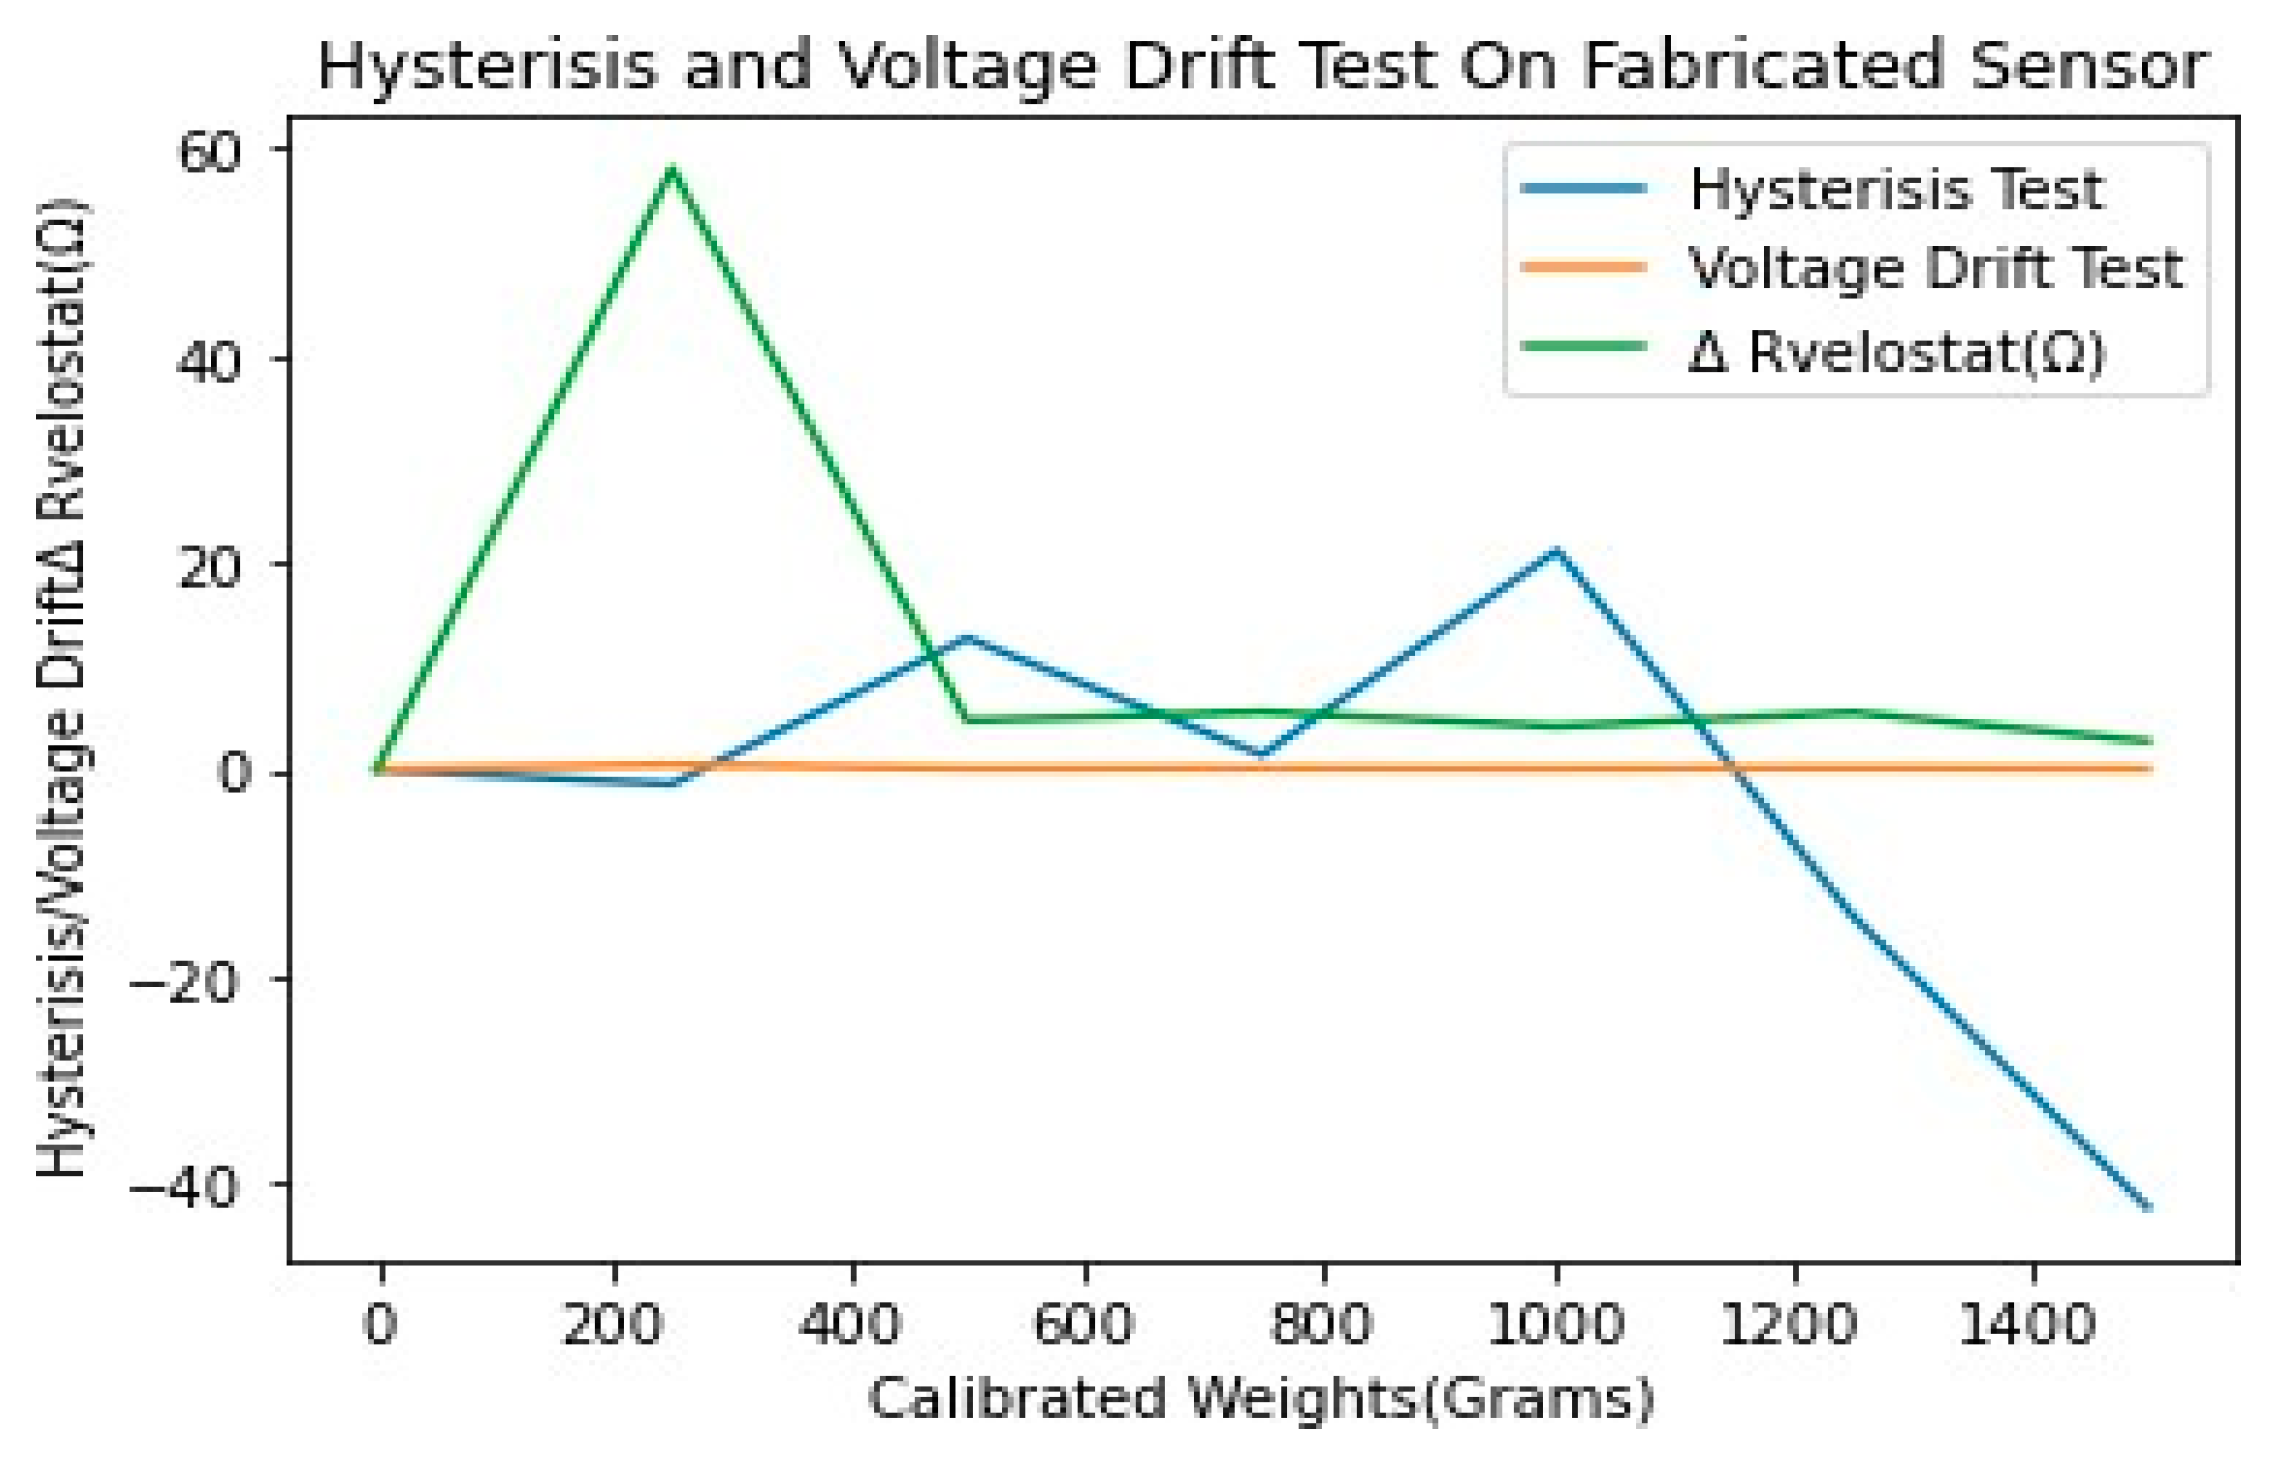
| S. No | Calibrated Weights (Grams) | Hysteresis | Voltage Drift | |
|---|---|---|---|---|
| ΔV0 | ΔRvelostat(Ω) | |||
| 1 | 0 | 0% | 0 | 0 |
| 2 | 250 | −1.408451% | 0.47 | 58002.11 |
| 3 | 500 | 12.67606% | 0.09 | 4705.14 |
| 4 | 750 | 1.408451% | 0.12 | 5565.36 |
| 5 | 1000 | 21.121761% | 0.08 | 4154.8 |
| 6 | 1250 | −14.08451% | 0.14 | 5512.6 |
| 7 | 1500 | −42.25352% | 0.06 | 2733.62 |
Disclaimer/Publisher’s Note: The statements, opinions and data contained in all publications are solely those of the individual author(s) and contributor(s) and not of MDPI and/or the editor(s). MDPI and/or the editor(s) disclaim responsibility for any injury to people or property resulting from any ideas, methods, instructions or products referred to in the content. |
© 2023 by the authors. Licensee MDPI, Basel, Switzerland. This article is an open access article distributed under the terms and conditions of the Creative Commons Attribution (CC BY) license (https://creativecommons.org/licenses/by/4.0/).
Share and Cite
Sharma, M.D.; Binong, J. Performance Evaluation of a Specialized Pressure Sensor for Pick and Place Operations. Eng. Proc. 2023, 58, 74. https://doi.org/10.3390/ecsa-10-16586
Sharma MD, Binong J. Performance Evaluation of a Specialized Pressure Sensor for Pick and Place Operations. Engineering Proceedings. 2023; 58(1):74. https://doi.org/10.3390/ecsa-10-16586
Chicago/Turabian StyleSharma, Marut Deo, and Juwesh Binong. 2023. "Performance Evaluation of a Specialized Pressure Sensor for Pick and Place Operations" Engineering Proceedings 58, no. 1: 74. https://doi.org/10.3390/ecsa-10-16586
APA StyleSharma, M. D., & Binong, J. (2023). Performance Evaluation of a Specialized Pressure Sensor for Pick and Place Operations. Engineering Proceedings, 58(1), 74. https://doi.org/10.3390/ecsa-10-16586