Proceeding Paper

A Comparative Study on Structural Displacement Prediction by Kernelized Regressors under Limited Training Data †

Department of Civil and Environmental Engineering, Politecnico di Milano, 20133 Milano, Italy
*
Author to whom correspondence should be addressed.
Presented at the 10th International Electronic Conference on Sensors and Applications (ECSA-10), 15–30 November 2023; Available online: https://ecsa-10.sciforum.net/.
Eng. Proc. 2023, 58(1), 57; https://doi.org/10.3390/ecsa-10-16031
Published: 15 November 2023

Abstract

:
An accurate prediction of the structural response in the presence of limited training data still represents a big challenge if machine learning-based approaches are adopted. This paper investigates and compares two state-of-the-art kernelized supervised regressors to predict the structural response of a long-span bridge retrieved from spaceborne remote sensing technology. The kernelized supervised procedure is either based on a support vector regression or on a Gaussian process regression. A small set of displacement time histories and corresponding air temperature data are fed into the regressors to predict the actual structural response. Results demonstrate that the proposed regression techniques are reliable, even when only 30% of the training data are used at the learning stage.

1. Introduction

Structural health monitoring (SHM) has brought a practical methodology for ensuring the safety and integrity of civil structures [1,2,3,4,5]. This methodology is based on sensor deployment over the structure to be monitored, data acquisition, modeling, feature extraction, and feature analysis [6,7,8]. The modeling stage can be either physics- or data-based [9,10,11,12]. Sensors are obviously important to any SHM process because the acquired data from the structures provide information on their behavior and current state. Recently, spaceborne remote sensing has become an emerging and practical technology for monitoring large-scale civil structures [13,14] by using synthetic aperture radar (SAR) images [15,16,17,18,19]. Despite some limitations such as speckle noise and low spectral and resolution information, SAR images have become important data for the SHM process to rely on [20,21]. The main product of the remote sensing for SHM is the extraction of structural displacements from said SAR images [22,23,24].
Even if recent progress in SAR-based SHM using the aforementioned displacement responses can be exploited, especially for huge civil structures, some limitations cause obstacles to fully take advantage of this methodology. First, as for any SHM program, the in situ/field measurements are not always trivial. In most cases, field testing and measurements entail high costs, low efficiency, impact on traffic, and damage to the structures. Although the use of non-contact-based sensors, particularly spaceborne remote sensing, significantly copes with the limitations of contact-based sensing and its difficulties regarding in situ measurement, SAR images produce Big Data of huge sizes (in the unit of GB), leading to issues related to memory storage. Second, the displacement is a feature extracted from SAR images. This means that such information is not provided directly from sensor recordings, and feature extraction techniques (like interferometric approaches) appear therefore necessary. In some cases, this results in poor and unreliable displacement data. Third, spaceborne remote sensing cannot provide as rich data/features as other contact-based sensing methods, which may be installed permanently. More precisely, in most practical and long-term SHM projects based on installed contact sensors, it is possible to supply large datasets measured hourly; however, it is difficult to provide so much data from remote sensing. Fourth, it is probable that any in situ/field measurement may contain missing data, which leads to incomplete information for SHM purposes. To address these limitations, the most appropriate solution is to predict the structural response based on measured excitation or input parameters.
In machine learning, data prediction is a well-known problem. To this purpose, it is possible to exploit various regression models based on predictor (independent or input) and response (dependent or output) data [25]. In relation to the SAR-based SHM strategy, the major challenge to face is that structural displacements extracted from the SAR images are limited. In other words, due to the size of such images, few observations are often considered to extract displacement responses. In this case, the use of any regression model for small data may be problematic. The best solution is thus to leverage data expansion techniques. From the viewpoint of regression modeling, support vector regression (SVR) and Gaussian process regression (GPR) are two supervised regressors developed from the concept of kernel trick that expand a low-dimensional feature space to a high-dimensional one with a different kernel function [26,27]. However, the performance of these techniques in the presence of small datasets and the consideration of a limited training ratio have not been explored properly for SAR-based SHM.
This paper mainly intends to compare the SVR and GPR methods for predicting structural responses obtained from a few SAR images, under a tiny and unusual ratio of training data. For this goal, data related to the structural response of a long-span bridge have been considered along with ambient temperature recordings with contact-based sensors. The structural responses have been considered for some areas of the bridge, exploiting 29 SAR images only of Sentinel-A1 in a long-term monitoring scheme. Accordingly, the temperature and displacement samples are divided into training and test sets with a ratio of 30:70. The recorded ambient temperature stems as the major predictor datum, while the structural displacements are considered as the main response for prediction. Results demonstrate that SVR outperforms GPR.

2. Supervised Regression Techniques

2.1. Support Vector Regression

The fundamental principle of SVR is to map the original training data to a higher-dimensional space, and then apply an optimization approach to find a hyperplane that can separate the training data in the transformed space. This hyperplane resembles a function that can predict a target value within a tolerance margin or a decision boundary based on the training data points [28]. Given the predictor data x = {x1,…,xn} and response data y = {y1,…,yn}, which, in the present case, gather the temperature and displacement points, respectively, the general form of the SVR model can be expressed as y = w T x + b , where w denotes the weight vector and b is the bias. Based on this general form, SVR intends to exploit the training data to predict the response data, moving through the following steps: (i) separating the training data into support vectors, (ii) mapping the support vectors into high-dimensional space via a kernel function, and (iii) developing a regression model containing estimated parameters through an optimization process. Based on Mercer’s theorem, the mapping procedure is performed by using different kernel functions. The procedure aims to minimize a convex function subject to constraints; for more details, readers are referred to [28].
To deal with the nonlinear regression problem, the low-dimensional parameter space needs to be mapped into the high-dimensional one by a kernel function ϕ(x), which computes inner product values of mapped points in the feature space stored in a matrix. Therefore, the final SVR model based on any kernel function can be expressed as y = w T ϕ ( x ) + b .

2.2. Gaussian Process Regression
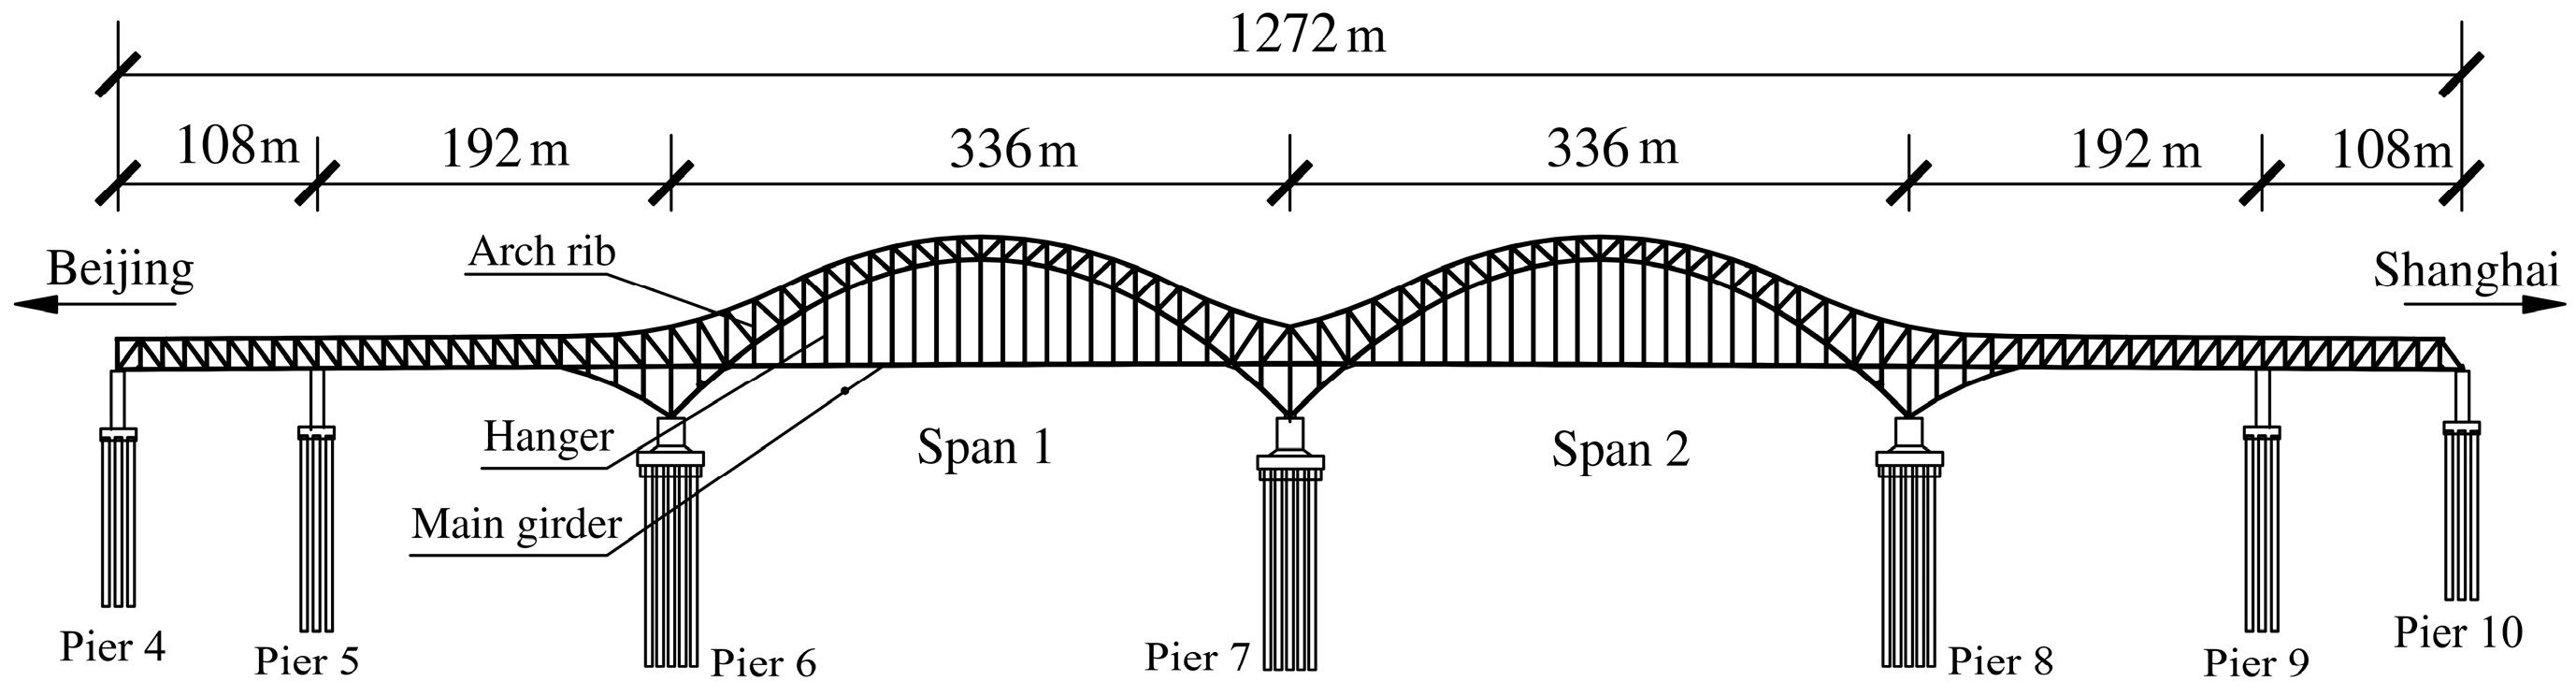
GPR is a supervised regression model that predicts data based on the development of a kernel-based probabilistic algorithm and the theory of Gaussian processes [29]. Given the predictor and response data x and y, GPR predicts a response point using new predictor data by introducing latent variables, L(x1),…,L(xn) from a GP, and an explicit basis function. For each i = 1,…,n, if L(xi) and xi conform to this process, the joint distribution of the random variables L(x1),…, L(xn) is Gaussian. If these variables are from a zero mean Gaussian process, one can derive the GPR model as h ( x ) T a + L ( x ) , where h(x) denotes a basis function that transforms the predictor data {x1,…,xn} into a new vector, and a is the set of the coefficients of this function. As the GPR model is based on the probability theory, h ( x ) T a + L ( x ) can be re-written as
Pr ( y | L ( x ) , x ) N ( x | h ( x ) T a + g ( x ) , σ 2 )
where g ( x ) G P ( 0 , ϕ ( x ) ) is equivalent to a zero-mean GP and ϕ(x) denotes the kernel function (matrix) of the predictor data. Once the GPR model has been developed via the training data, it can predict any new response by means of the conditional distribution in Equation (1).

3. Application

The Dashengguan Bridge is a long-span high-speed railway steel bridge that crosses the Yangtze River in Nanjing, China [20]. The bridge features a large-span continuous steel arch truss with a length of 1615 m. This work focuses on the six main parts of the bridge, with a total length of 1272 m, as shown in Figure 1. The arches consist of three truss planes above the deck. The main truss has a welded, monolithic joint. The members and gusset plates were welded together in the fabrication yard and then transported to the site and spliced outside the joint with high-strength bolts.

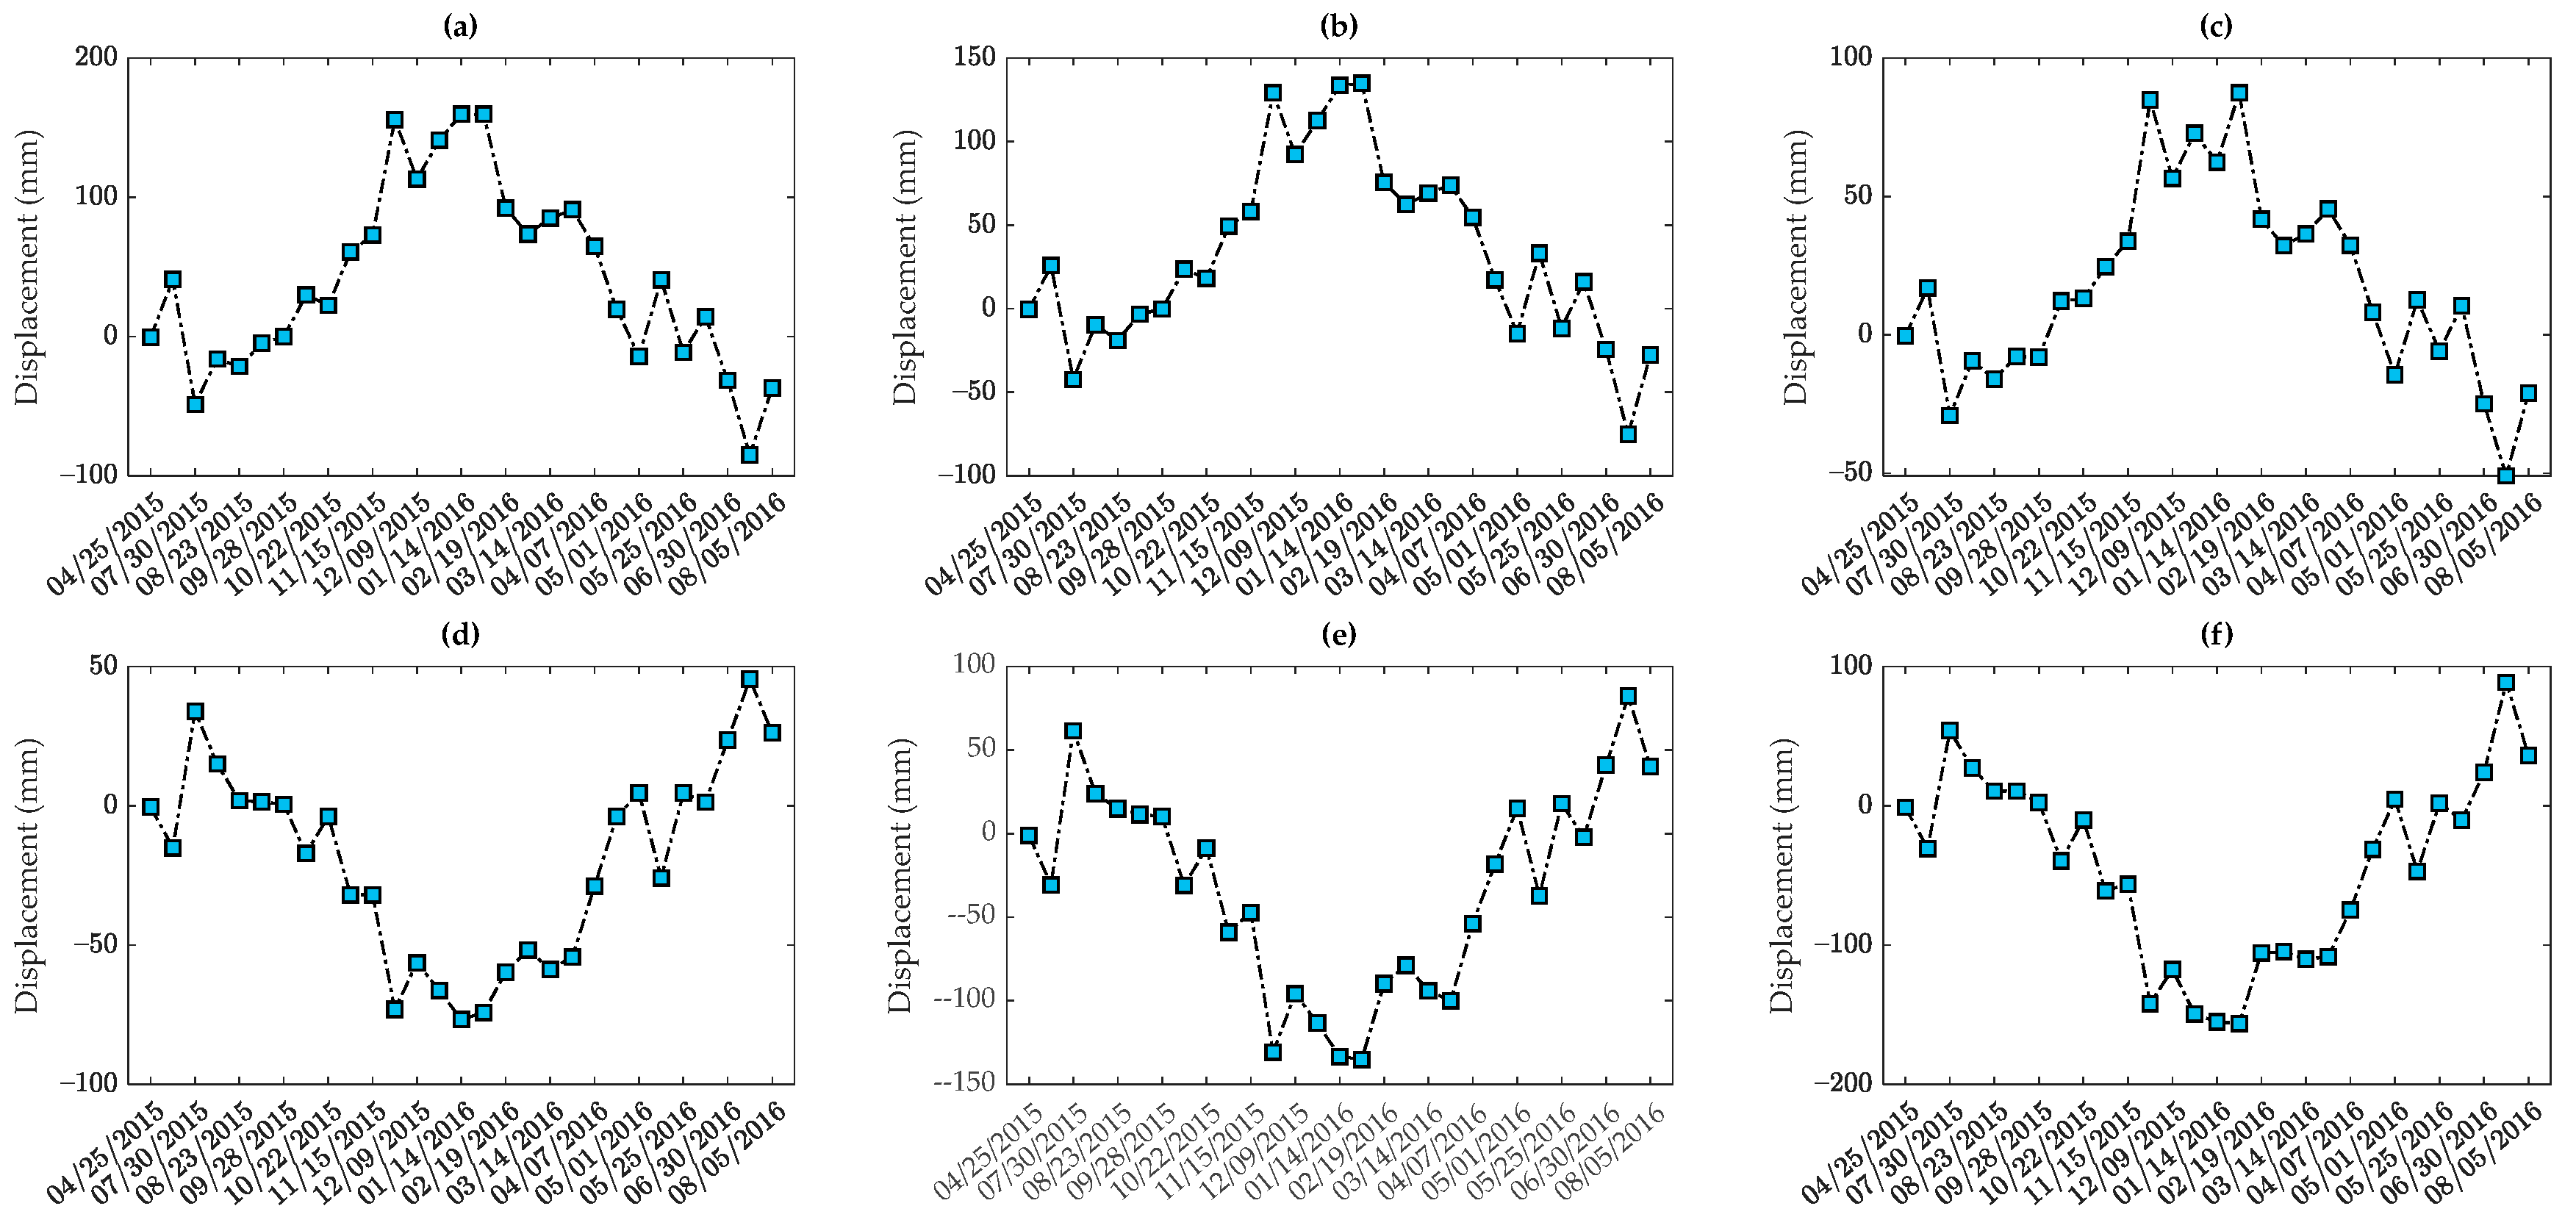
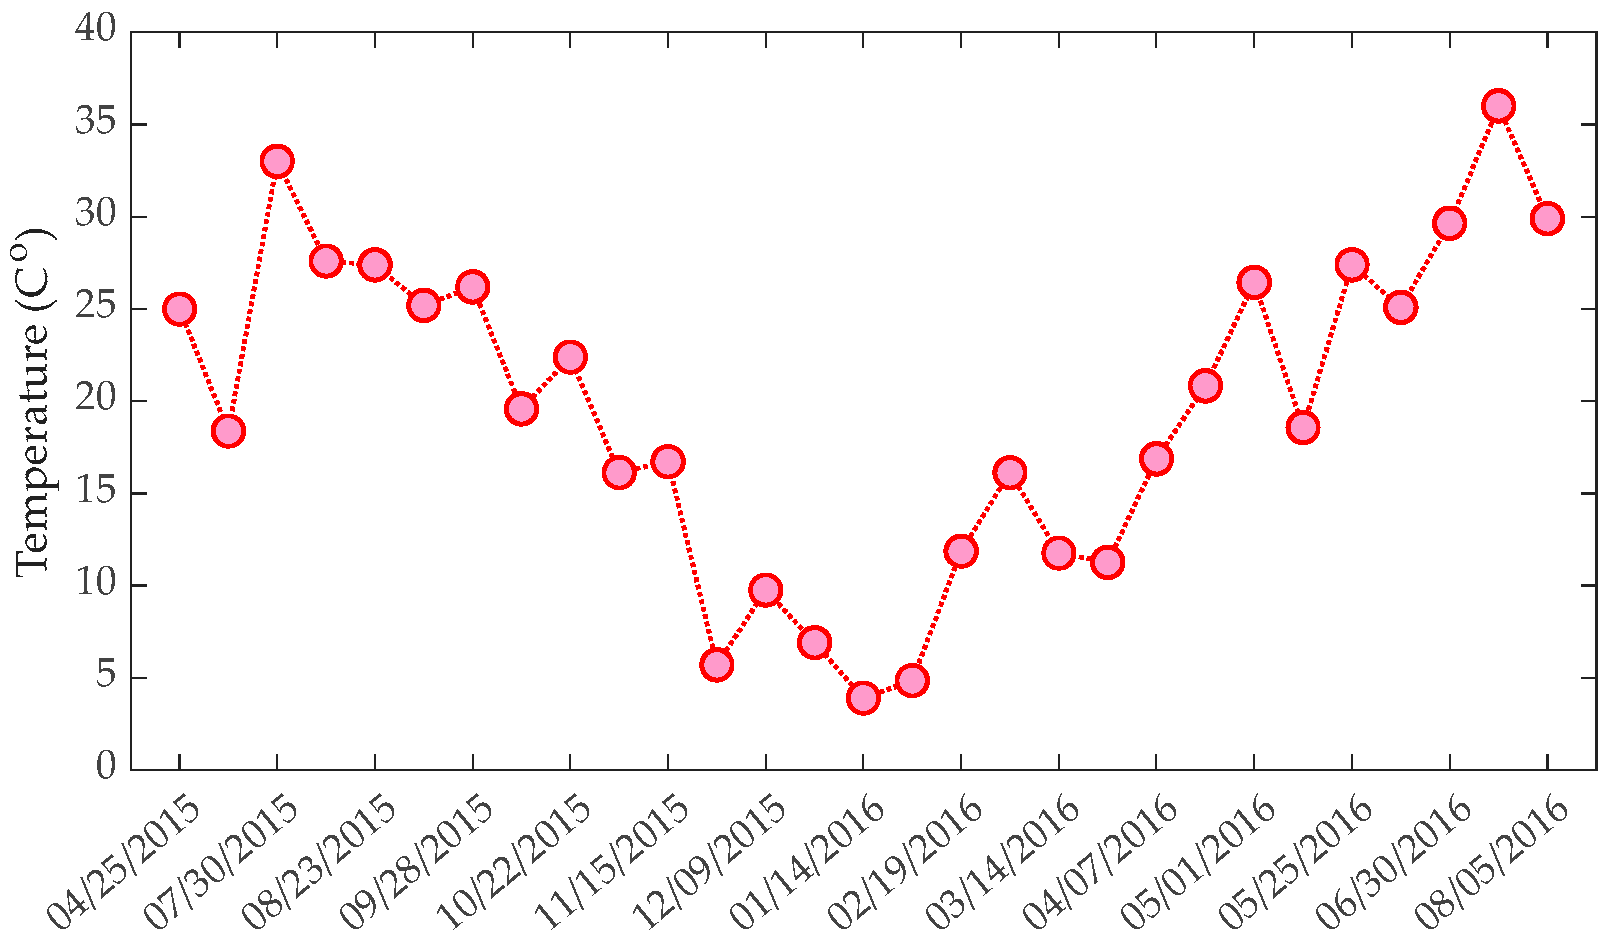
3.1. Predictor and Response Data

In a long-term monitoring program between 25 April 2015 and 5 August 2016, 29 SAR images from Sentinel-A1 were used to extract displacement responses in the unit of mm at some critical areas of the bridge, including piers 4–6 and 8–10; see Figure 1. Figure 2 shows the mentioned structural responses at the six piers of the bridge, which were extracted with the persistent scatterer interferometry technique [20]. The ambient temperature was also recorded by contact-based sensors and is shown in Figure 3.

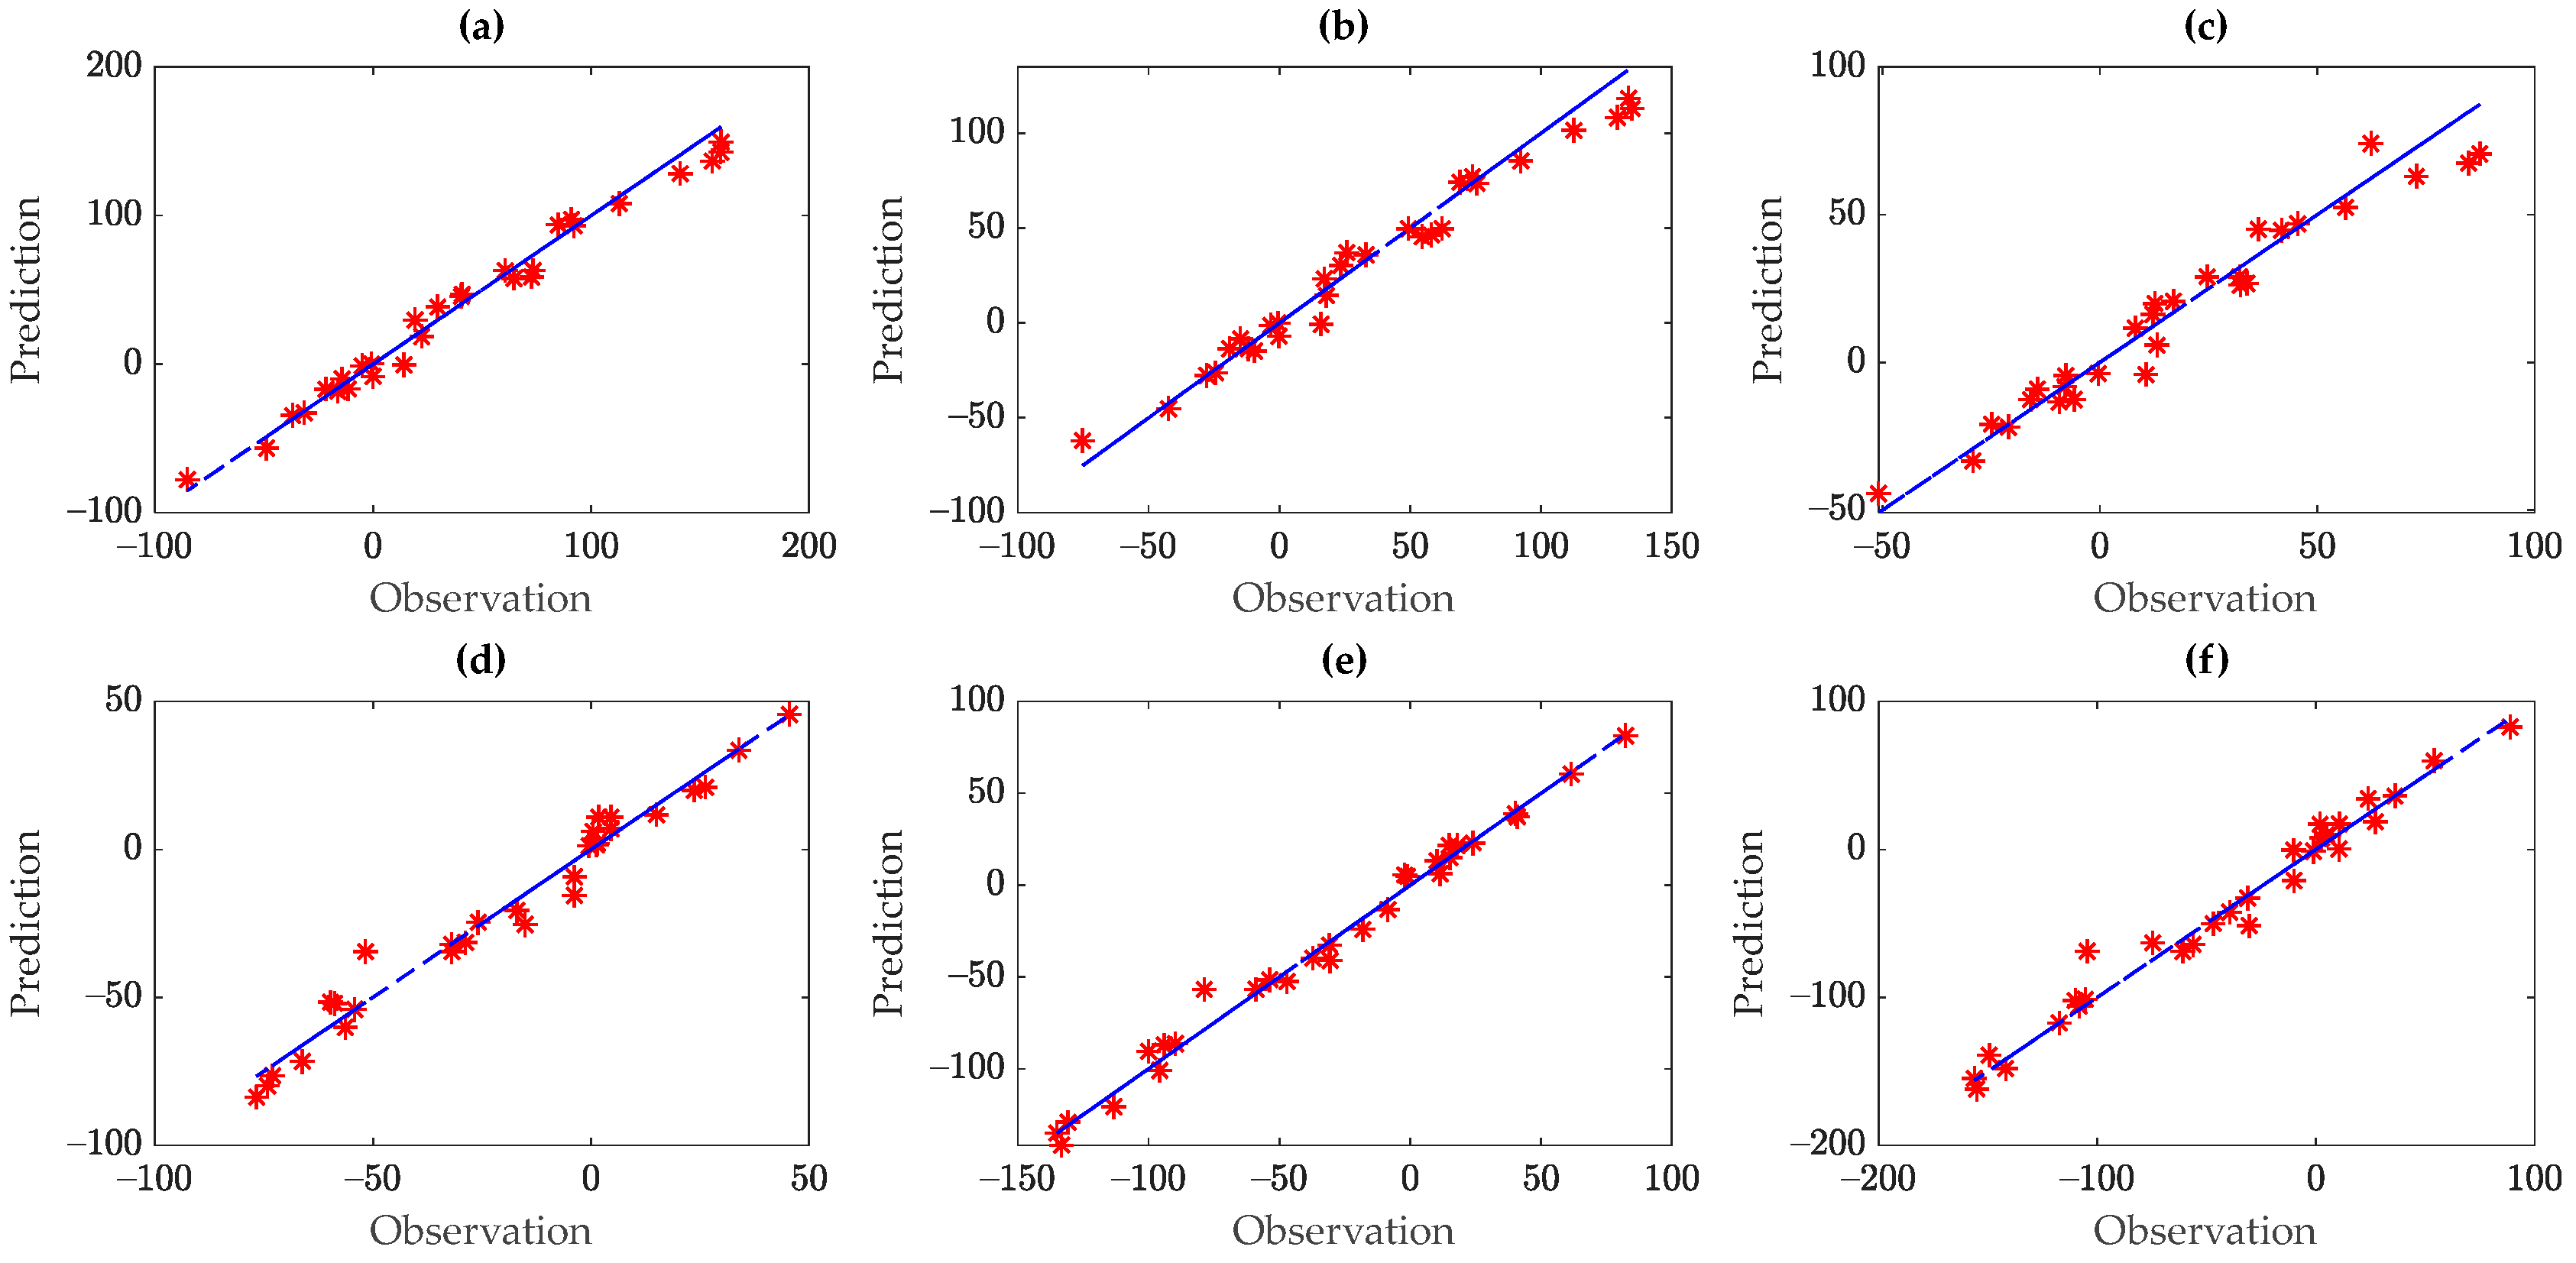
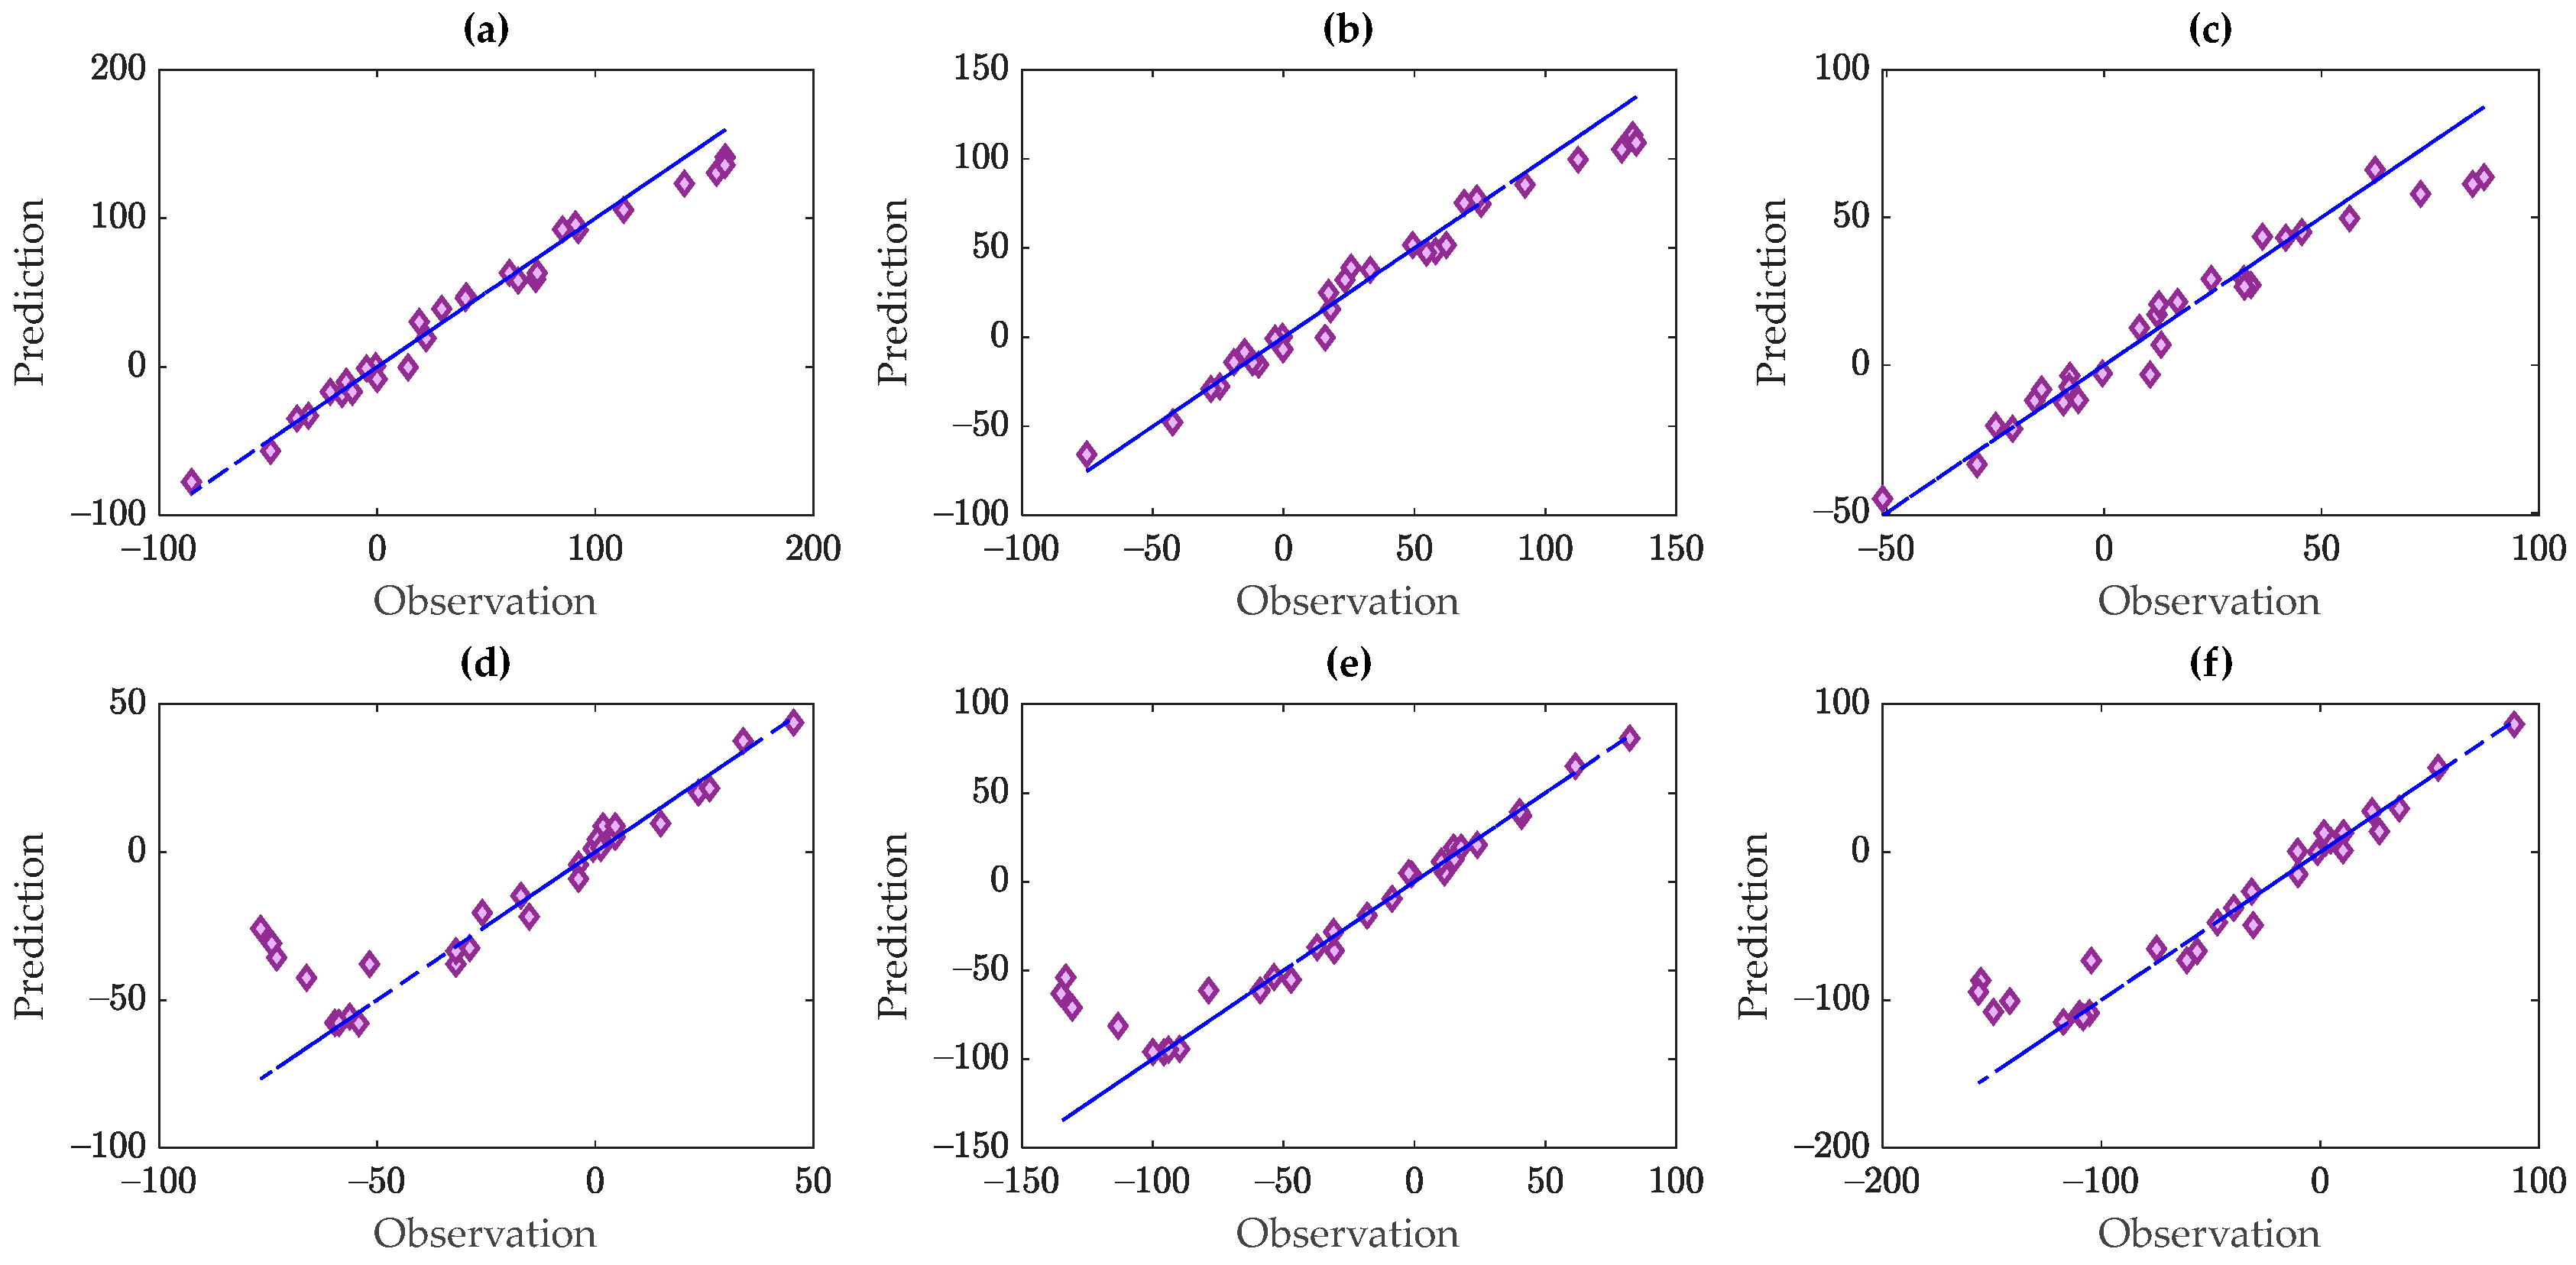
3.2. Prediction Results

To predict the displacement responses, the predictor and response data are divided into the training and test sets. For the training process, a small ratio of 30% is considered so that the training data consist of nine samples, including both the recorded temperature and the extracted displacement points. The remaining 20 samples are incorporated into the test dataset. The Bayesian hyperparameter optimization is adopted to tune the unknown elements of the SVR and GPR, especially the kernel function. On this basis, the linear and squared exponential kernel functions are selected for SVR and GPR, respectively, to map the limited training points into the high-dimensional feature space.
The results of displacement response prediction via SVR and GPR are shown in Figure 4 and Figure 5, respectively. These charts display the scatter plots of the predicted displacements versus their real values, as extracted from the SAR images. When the scatter points are close to the reported straight line, representing a perfect match between the two datasets, one can infer that the prediction process operates well. The comparison between Figure 4 and Figure 5 testifies that SVR outperforms GPR in predicting the displacement data in the case of a small training ratio. For further investigation, Table 1 compares the numerical outputs of the regression modeling based upon the R-squared (R2) and root-mean-square-error (RMSE) measures; an R-squared value close to 1 is indicative of a good prediction. In Table 1, one can observe that R2 and RMSE values relevant to the SVR model are closer to 1 and smaller than the corresponding values concerning the GPR model. Therefore, both the graphical and numerical assessments confirm a better performance of SVR compared to GPR.

4. Conclusions

This paper has compared two kernelized supervised regressors, namely SVR and GPR, to predict the structural displacements extracted from a few SAR images obtained with remote sensing technology in the case of a small ratio of training data. Bayesian hyperparameter optimization has also been applied to tune the unknown elements of the SVR and GPR models, especially their kernel functions.
A limited number of displacement responses of a long-span steel bridge coupled with the relevant ambient temperature values have been considered, to evaluate the capability of the regressors. The results have demonstrated that SVR provides better prediction results than GPR, in the case of only a small training dataset used in the data analysis stage of the SHM strategy.

Author Contributions

Conceptualization, A.E. and B.B.; methodology, A.E., B.B., C.D.M. and S.M.; software, A.E. and B.B.; validation, A.E. and B.B.; formal analysis, A.E., B.B., C.D.M. and S.M.; investigation, A.E., B.B., C.D.M. and S.M.; resources, A.E. and B.B.; data curation, A.E. and B.B.; writing—original draft preparation, A.E. and B.B.; writing—review and editing, A.E., B.B., C.D.M. and S.M.; visualization, A.E., B.B., C.D.M. and S.M.; supervision, C.D.M. and S.M.; project administration, A.E., B.B., C.D.M. and S.M. All authors have read and agreed to the published version of the manuscript.

Funding

This research was partially funded by the European Space Agency (ESA) under contract no. 4000132658/20/NL/MH/ac.

Institutional Review Board Statement

Not applicable.

Informed Consent Statement

Not applicable.

Data Availability Statement

Data are unavailable due to privacy or ethical restrictions.

Conflicts of Interest

The authors declare no conflicts of interest. The funders had no role in the design of the study; in the collection, analyses, or interpretation of data; in the writing of the manuscript; or in the decision to publish the results.

References

  1. Entezami, A.; Sarmadi, H.; Behkamal, B.; Mariani, S. Health Monitoring of Large-Scale Civil Structures: An Approach Based on Data Partitioning and Classical Multidimensional Scaling. Sensors 2021, 21, 1646. [Google Scholar] [CrossRef] [PubMed]
  2. Daneshvar, M.H.; Sarmadi, H. Unsupervised learning-based damage assessment of full-scale civil structures under long-term and short-term monitoring. Eng. Struct. 2022, 256, 114059. [Google Scholar] [CrossRef]
  3. Entezami, A.; Sarmadi, H.; Behkamal, B. A novel double-hybrid learning method for modal frequency-based damage assessment of bridge structures under different environmental variation patterns. Mech. Syst. Sig. Process. 2023, 201, 110676. [Google Scholar] [CrossRef]
  4. Entezami, A.; Sarmadi, H.; Behkamal, B. Long-term health monitoring of concrete and steel bridges under large and missing data by unsupervised meta learning. Eng. Struct. 2023, 279, 115616. [Google Scholar] [CrossRef]
  5. Soleymani, A.; Jahangir, H.; Nehdi, M.L. Damage detection and monitoring in heritage masonry structures: Systematic review. Constr. Build. Mater. 2023, 397, 132402. [Google Scholar] [CrossRef]
  6. Ardani, S.; Eftekhar Azam, S.; Linzell, D.G. Bridge Health Monitoring Using Proper Orthogonal Decomposition and Transfer Learning. Appl. Sci. 2023, 13, 1935. [Google Scholar] [CrossRef]
  7. Akintunde, E.; Azam, S.E.; Linzell, D.G. Singular value decomposition and unsupervised machine learning for virtual strain sensing: Application to an operational railway bridge. Structures 2023, 58, 105417. [Google Scholar] [CrossRef]
  8. Leyder, C.; Dertimanis, V.; Frangi, A.; Chatzi, E.; Lombaert, G. Optimal sensor placement methods and metrics–comparison and implementation on a timber frame structure. Struct. Infrastruct. Eng. 2018, 14, 997–1010. [Google Scholar] [CrossRef]
  9. Sarmadi, H.; Entezami, A.; Ghalehnovi, M. On model-based damage detection by an enhanced sensitivity function of modal flexibility and LSMR-Tikhonov method under incomplete noisy modal data. Eng. Comput. 2022, 38, 111–127. [Google Scholar] [CrossRef]
  10. Entezami, A.; Sarmadi, H.; Behkamal, B.; De Michele, C. On continuous health monitoring of bridges under serious environmental variability by an innovative multi-task unsupervised learning method. Struct. Infrastruct. Eng. 2023; 1–19, in press. [Google Scholar] [CrossRef]
  11. Torzoni, M.; Rosafalco, L.; Manzoni, A. A combined model-order reduction and deep learning approach for structural health monitoring under varying operational and environmental conditions. Eng. Proc. 2020, 2, 94. [Google Scholar] [CrossRef]
  12. Figueiredo, E.; Brownjohn, J. Three decades of statistical pattern recognition paradigm for SHM of bridges. Struct. Health Monit. 2022, 21, 3018–3054. [Google Scholar] [CrossRef]
  13. Farneti, E.; Cavalagli, N.; Costantini, M.; Trillo, F.; Minati, F.; Venanzi, I.; Ubertini, F. A method for structural monitoring of multispan bridges using satellite InSAR data with uncertainty quantification and its pre-collapse application to the Albiano-Magra Bridge in Italy. Struct. Health Monit. 2023, 22, 353–371. [Google Scholar] [CrossRef]
  14. Laflamme, S.; Ubertini, F.; Di Matteo, A.; Pirrotta, A.; Perry, M.; Fu, Y.; Li, J.; Wang, H.; Hoang, T.; Glisic, B. Roadmap on measurement technologies for next generation structural health monitoring systems. Meas. Sci. Technol. 2023, 34, 093001. [Google Scholar] [CrossRef]
  15. Plank, S. Rapid Damage Assessment by Means of Multi-Temporal SAR—A Comprehensive Review and Outlook to Sentinel-1. Remote Sens. 2014, 6, 4870–4906. [Google Scholar] [CrossRef]
  16. Giordano, P.F.; Turksezer, Z.; Previtali, M.; Limongelli, M.P. Damage detection on a historic iron bridge using satellite DInSAR data. Struct. Health Monit. 2022, 21, 2291–2311. [Google Scholar] [CrossRef]
  17. Giordano, P.F.; Previtali, M.; Limongelli, M.P. Monitoring of a Metal Bridge Using DInSAR Data. In European Workshop on Structural Health Monitoring; Springer: Cham, Switzerland, 2021. [Google Scholar] [CrossRef]
  18. Farneti, E.; Cavalagli, N.; Venanzi, I.; Salvatore, W.; Ubertini, F. Residual service life prediction for bridges undergoing slow landslide-induced movements combining satellite radar interferometry and numerical collapse simulation. Eng. Struct. 2023, 293, 116628. [Google Scholar] [CrossRef]
  19. Cavalagli, N.; Kita, A.; Farneti, E.; Falco, S.; Trillo, F.; Costantini, M.; Fornaro, G.; Reale, D.; Verde, S.; Ubertini, F. Remote sensing and in-situ measurements for the structural monitoring of historical monuments: The Consoli Palace of Gubbio, Italy. In European Workshop on Structural Health Monitoring; Springer: Cham, Switzerland, 2021. [Google Scholar] [CrossRef]
  20. Huang, Q.; Crosetto, M.; Monserrat, O.; Crippa, B. Displacement monitoring and modelling of a high-speed railway bridge using C-band Sentinel-1 data. ISPRS J. Photogramm. Remote Sens. 2017, 128, 204–211. [Google Scholar] [CrossRef]
  21. Entezami, A.; Arslan, A.N.; De Michele, C.; Behkamal, B. Online hybrid learning methods for real-time structural health monitoring using remote sensing and small displacement data. Remote Sens. 2022, 14, 3357. [Google Scholar] [CrossRef]
  22. Farneti, E.; Cavalagli, N.; Costantini, M.; Trillo, F.; Minati, F.; Venanzi, I.; Salvatore, W.; Ubertini, F. Remote Sensing Satellite Data and Progressive Collapse Analysis for Structural Monitoring of Multi-span Bridges. In European Workshop on Structural Health Monitoring; Springer: Cham, Switzerland, 2022. [Google Scholar] [CrossRef]
  23. Macchiarulo, V.; Milillo, P.; Blenkinsopp, C.; Giardina, G. Monitoring deformations of infrastructure networks: A fully automated GIS integration and analysis of InSAR time-series. Struct. Health Monit. 2022, 21, 1849–1878. [Google Scholar] [CrossRef]
  24. Milillo, P.; Giardina, G.; Perissin, D.; Milillo, G.; Coletta, A.; Terranova, C. Reply to Lanari, R., et al. comment on “pre-collapse space geodetic observations of critical infrastructure: The morandi bridge, Genoa, Italy” by Milillo et al. (2019). Remote Sens. 2020, 12, 4016. [Google Scholar] [CrossRef]
  25. Figueiredo, E.; Park, G.; Farrar, C.R.; Worden, K.; Figueiras, J. Machine learning algorithms for damage detection under operational and environmental variability. Struct. Health Monit. 2011, 10, 559–572. [Google Scholar] [CrossRef]
  26. Behkamal, B.; Entezami, A.; De Michele, C.; Arslan, A.N. Investigation of temperature effects into long-span bridges via hybrid sensing and supervised regression models. Remote Sens. 2023, 15, 3503. [Google Scholar] [CrossRef]
  27. da Silva, S.; Figueiredo, E.; Moldovan, I. Damage Detection Approach for Bridges under Temperature Effects using Gaussian Process Regression Trained with Hybrid Data. J. Bridge Eng. 2022, 27, 04022107. [Google Scholar] [CrossRef]
  28. Smola, A.J.; Schölkopf, B. A tutorial on support vector regression. Stat. Comput. 2004, 14, 199–222. [Google Scholar] [CrossRef]
  29. Schulz, E.; Speekenbrink, M.; Krause, A. A tutorial on Gaussian process regression: Modelling, exploring, and exploiting functions. J. Math. Psychol. 2018, 85, 1–16. [Google Scholar] [CrossRef]
Figure 1. Side view and main dimensions of the Dashengguan Bridge.
Engproc 58 00057 g001
Figure 2. Structural displacements of the Dashengguan Bridge from 29 SAR images of Sentinel-A1: (ac) Piers 4–6, (df) Piers 8–10.
Engproc 58 00057 g002
Figure 3. Air temperature records.
Engproc 58 00057 g003
Figure 4. Predicted versus real displacements based on SVR: (a) Pier 4, (b) Pier 5, (c) Pier 6, (d) Pier 8, (e) Pier 9, (f) Pier 10.
Engproc 58 00057 g004
Figure 5. Predicted versus real displacements based on GPR: (a) Pier 4, (b) Pier 5, (c) Pier 6, (d) Pier 8, (e) Pier 9, (f) Pier 10.
Engproc 58 00057 g005
Table 1. Performance evaluation of the kernelized supervised regressor.
Pier No.Metrics
R2RMSER2RMSE
SVRGPRSVRGPR
40.97320.841310.604425.8231
50.94750.823112.334622.6547
60.92100.76039.598416.7244
80.96800.96326.16346.6125
90.98750.81556.740325.9005
100.95480.970114.160711.5007
Disclaimer/Publisher’s Note: The statements, opinions and data contained in all publications are solely those of the individual author(s) and contributor(s) and not of MDPI and/or the editor(s). MDPI and/or the editor(s) disclaim responsibility for any injury to people or property resulting from any ideas, methods, instructions or products referred to in the content.

