Proceeding Paper

Texture Classification Based on Sound and Vibro-Tactile Data †

Department of Computer Science and Engineering, University of Quebec in Outaouais, Gatineau, QC J8Y 3G5, Canada
*
Authors to whom correspondence should be addressed.
Presented at the 10th International Electronic Conference on Sensors and Applications (ECSA-10), 15–30 November 2023; Available online: https://ecsa-10.sciforum.net/.
Eng. Proc. 2023, 58(1), 5; https://doi.org/10.3390/ecsa-10-16082
Published: 15 November 2023

Abstract

:
This paper focuses on the development and validation of an automatic learning system for the classification of tactile data in form of vibro-tactile (accelerometer) and audio (microphone) data for texture recognition. A novel combination of features including the standard deviation, the mean, the absolute median of the deviation, the energy that characterizes the power of the signal, a measure that reflects the perceptual properties of the human system associated with each sensory modality, and the Fourier characteristics extracted from signals, along with principal component analysis, is shown to obtain the best results. Several machine learning models are compared in an attempt to identify the best compromise between the number of features, the classification performance and the computation time. Longer sampling periods (2 s. vs. 1 s) provide more information for classification, leading to higher performance (average of 3.59%) but also augment the evaluation time by an average of 29.48% over all features and models. For the selected dataset, the XGBRF model was identified to represent overall the best compromise between performance and computation time for the proposed novel combination of features over all material types with an F-score of 0.91 and a computation time of 4.69 ms, while kNN represents the next best option (1% improvement in performance at the cost of 2.13 ms increase in time with respect to XGBRF).

1. Introduction

The tactile perception of material properties is a difficult task, but also of great importance for the skillful manipulation of objects in fields such as robotics, virtual reality and augmented reality. Given the diversity of material properties, integrated tactile perception systems require efficient extraction and classification of features from data collected by tactile sensors. There are several publications on the topic of texture recognition in the literature. Characteristics of material textures can be retrieved using vision-based, tactile-based or sound-based data. Most publications rely uniquely on images to identify textures in various domains [1], while others are using sensor data collected by various tactile technologies (i.e., Microelectromechanical Magnetic, Angular Rate and Gravity–MARG systems, pressure sensors, accelerometers, microphone, etc.) while the surface of the sensor enters in contact with a probed textured surface. Other publications capitalize on combinations of various tactile sensory sources [2,3,4]. Most publications employ feature extraction techniques [5] to identify the most relevant data to focus on prior to applying machine learning solutions to classify or recognize textures or textured materials. In tactile sensing, known feature extraction techniques include principal component analysis, PCA [4,6], frequency signatures [7] and the Fast Fourier Transform (FFT) [3,8], both for sound and vibro-tactile data. Some researchers focus mostly on real-time processing [3,4], and tend to choose less complex machine learning solutions (such as the k-nearest neighbors, KNN [3,7,8], two-layer multilayer perceptron MLP [3,4], or SVM [3,6]). Others make use of convolutional neural network architectures [8] that do not require the extraction of features, as this process is embedded in their architecture. However, they come at additional computational cost due to their increased complexity.
This paper focuses on the development and validation of an automatic learning system for the classification of tactile data in form of vibro-tactile (accelerometer) and audio (microphone) data for texture recognition. We aim to identify the right balance between classification accuracy and compact, fast solutions, with potential for real-time performance. We propose a novel combination of features for this purpose. In order to reduce the dimensionality of the tactile dataset and identify the most compact models, we apply PCA as well as a process of selection of features based on their importance. Several machine learning models are compared in an attempt to identify the best compromise between the number of features, the classification performance and the computation time. We also demonstrate that the choice of the sampling length from the tactile signals is an important aspect that has a significant impact on classification performance.

2. Materials and Methods

2.1. Dataset for Texture Classification

The VibTac-12 dataset used in this paper is created by Kursun and Patooghy [9]. It is based on a vibro-tactile stimulator system to generate controlled vibrations on textured materials (i.e., sandpapers of various grits, Velcro strips with various thicknesses, aluminum foil and rubber bands of various stickiness) and an embedded system to record tactile data. Two sensors, a microphone and an accelerometer attached to a probe, capture the audio and vibro-tactile signals as the probe rubs against the surface of textured materials. The interested reader is invited to consult reference [3] for details on the experimental setup and the data collection process. In this paper, we employ the two available tactile data sources in the dataset, namely sound recordings and data collected by the accelerometer that measures the changes in acceleration and orientation of the probe in contact with the texture surface along three axes. It is important to state that we are not making use of the data processing sequence that the authors of [3] used, we only use their raw data. Our focus is to identify a set of powerful features that allow us to accurately clasify these data in the shortest time possible.

2.2. Proposed Solution for Texture Classification from Sound and Vibro-Tactile Data

Figure 1 illustrates the proposed solution for texture classification from sound and vibro-tactile data. Input data consists of sound data contained in the Sdf.csv file from the VibTac-12 dataset [9] and of accelerometer data, and contained in the Xdf, Ydf and Zdf files, respectively. This data goes through a pre-processing stage in order to normalize it, eliminate outliers and extract and select features in order to transform it into a usable format for classification. Texture class names are encoded with numerical identifiers.
To study the impact of each source (type) of data, of the chosen features and of the length of the sampling period on the performance of texture recognition, we created several datasets. We name them in Figure 1 to clearly identify their data source, features and lengths. It is important to mention that creating these different datasets is only for making their interpretation easier. They correspond in fact to the feature extraction process in machine learning that does not require the creation of separate datasets. Our solution is implemented in Python. We make use of several open-access libraries, including Librosa [10], a library for audio signal processing, Scikit-learn for the implementation of the machine learning algorithms and the Eli5 library [11] to identify feature importance.

2.3. Data Processing

2.3.1. Data Transformation

For each texture, 20 s of multimodal recordings are available. Therefore, each line of the Xdf, Ydf and Zdf files respectively contains 4000 samples (20 s × 200 Hz sampling rate) and each line of the Sdf file contains 160,000 samples (20 s × 8 kHz sampling rate). To reduce the computational load and in order to create our datasets, we sampled, without replacement, 100 random samples from the raw data sequences, and thus each data set contains a total of 1200 records. A unique multimodal tactile dataset (SXYZ) containing sound data (S) and accelerometer (XYZ) data is thus created for testing.

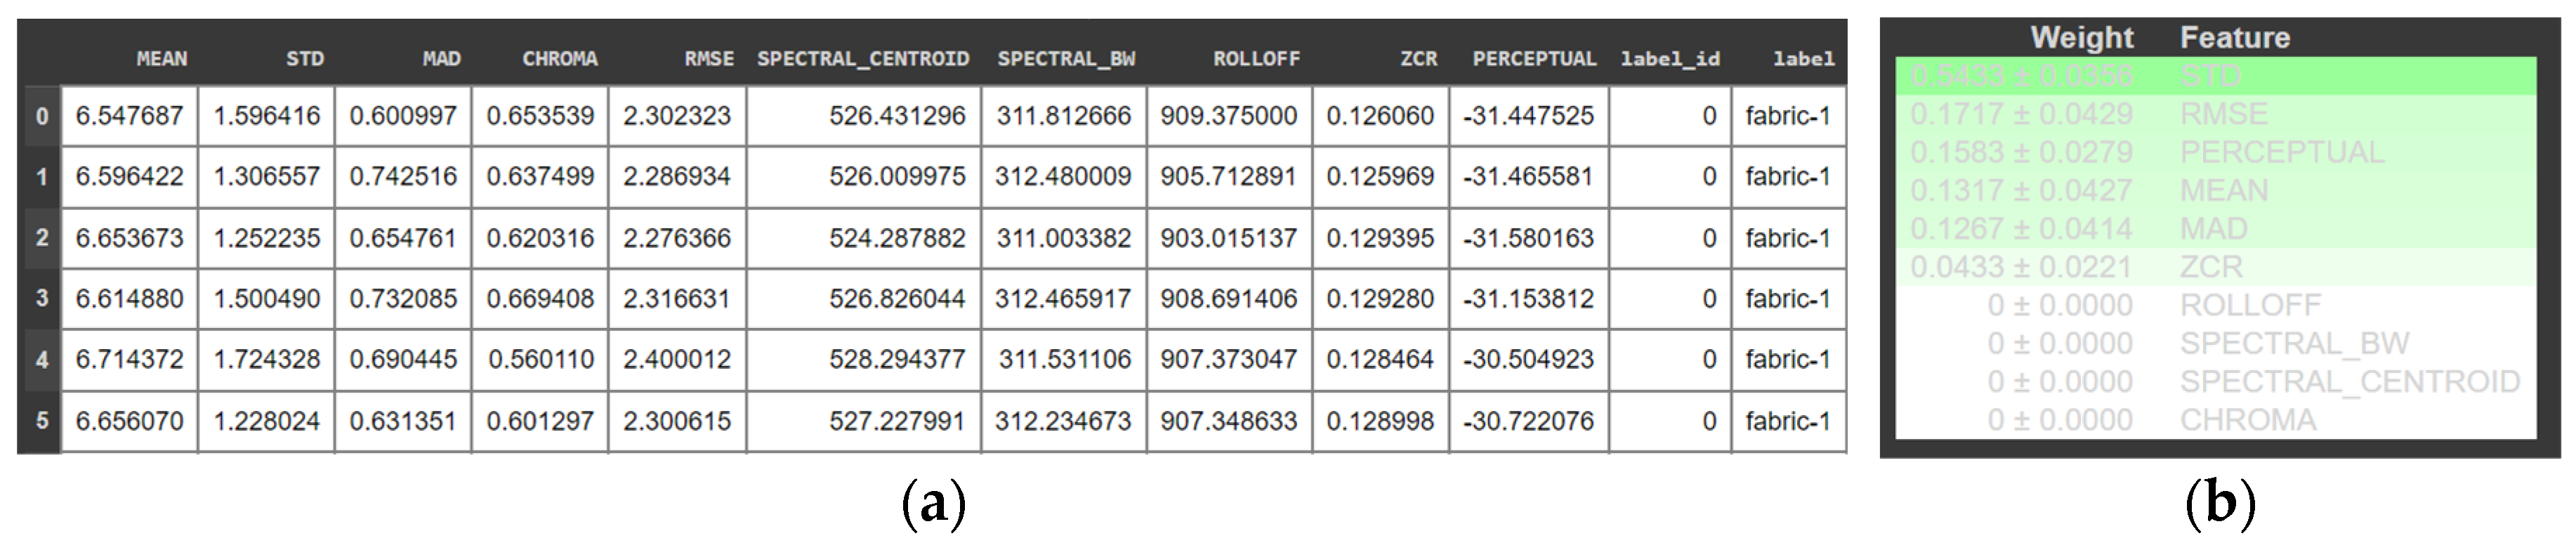
2.3.2. Feature Extraction

We extracted from the created tactile dataset commonly used features in time series analysis, including the following 10 features: (1) MEAN, representing the mean; (2) standard deviation (STD), representing the dispersion of values around the mean; (3) median absolute deviation (MAD); (4) RMSE, the energy characterizing the power of the signal; (5) CHROMA: a representation of the musical characteristics related to the tonality and harmony of an audio signal; (6) SPECTRAL_CENTROID: a measure of the position of the center of gravity of the spectral energy distribution of a signal, calculated as the weighted average of the frequencies in the signal power spectrum, where the weights are given by the spectral magnitude at each frequency; (7) SPECTRAL_BANDWIDTH: a measure of the spread of spectral energy distribution in a signal, i.e., the frequency range of a signal; (8) SPECTRAL_ROLLOFF: a feature representing the frequency below which a given percentage of the signal’s total spectral energy is concentrated; (9) PERCEPTUAL: a feature reflecting the perceptual properties of the human system associated with each sensory modality useful to characterize the quality or perceptual properties of a signal; and (10) the zero crossing rate (ZCR) that measures the frequency at which a signal changes polarity. We also extracted four features obtained by applying the Fast Fourier Transform (FFT) to the S, X, Y, and Z signals. The two resulting datasets are named SMMRP (10 features) and FFT (4 features) in Figure 1. These features are extracted from the sound and vibrotactile signals for 1 s and for 2 s sampling periods.

2.3.3. Feature Selection

Feature selection is a key data preparation step aiming to reduce the number of features to be included in modeling, by selecting the most relevant features for classification. It can help determine if there are features that are less useful, and thus could be potentially removed to reduce the model complexity. Using a random forest algorithm, we identified in the 10 feature-SMMRP dataset (Figure 2a) that the features STD, MEAN, MAD, RMSE and PERCEPTUAL (Figure 2b) are those that contribute the most to predictions. As such, we chose to continue our work with these 5 features (denoted SMMRP in the rest of the paper and SMMRP (5 features) in Figure 1) along with the four FFT features. However, we noticed that some of these features are correlated. To address this issue, as well as to further reduce the complexity of the dataset, we used PCA on these features (_PCA datasets in Figure 1). As shown in Figure 1, in all the cases we have chosen the first 3 principal components that capture roughly 95% of the total variance when we only use the SMMRP features, roughly 97% for the FFT features and 100% when all features are used together (SMMRPFFT) for a sampling period of 2 s.
Figure 3 shows the data dispersion for the various texture classes using PCA. One can notice that, for all datasets—SMMRP (Figure 3a), FFT (Figure 3b) and their combination SMMRPFFT (Figure 3c)—certain classes are easily separable (distinguished), for example “aluminum_film”, in light red, or “fabric-3”, in purple, while others, like “fabric-1” in dark blue and “toy_tire_rubber” in dark red overlap, as do “fabric-2” in dark green and “moquette-1” in dark orange. These latter classes will therefore be more difficult to classify correctly, regardless of the classifier used and of the features selected. One can also notice that the separability is improved when the combination of features (SMRRPFFT) is used, in Figure 3c.

2.4. Data Classification
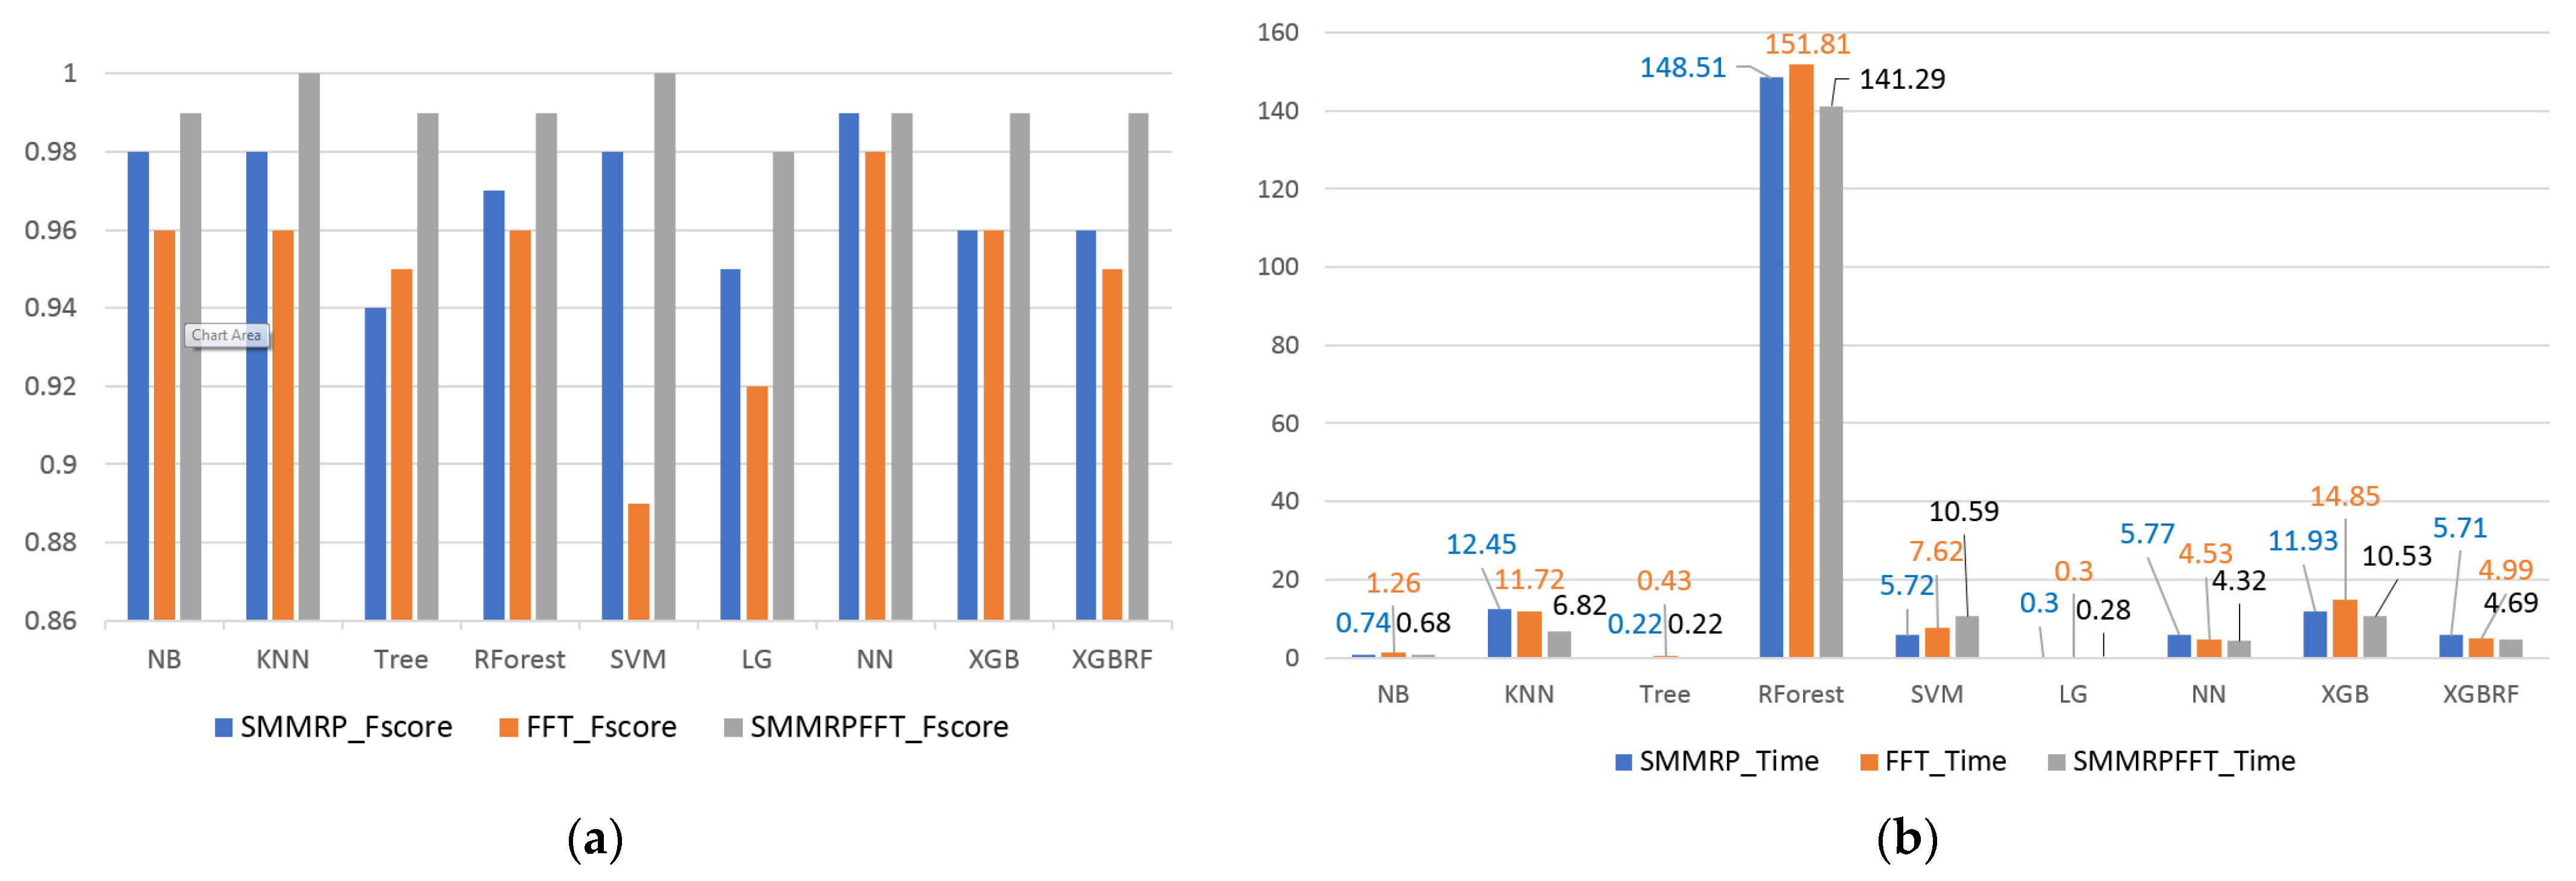
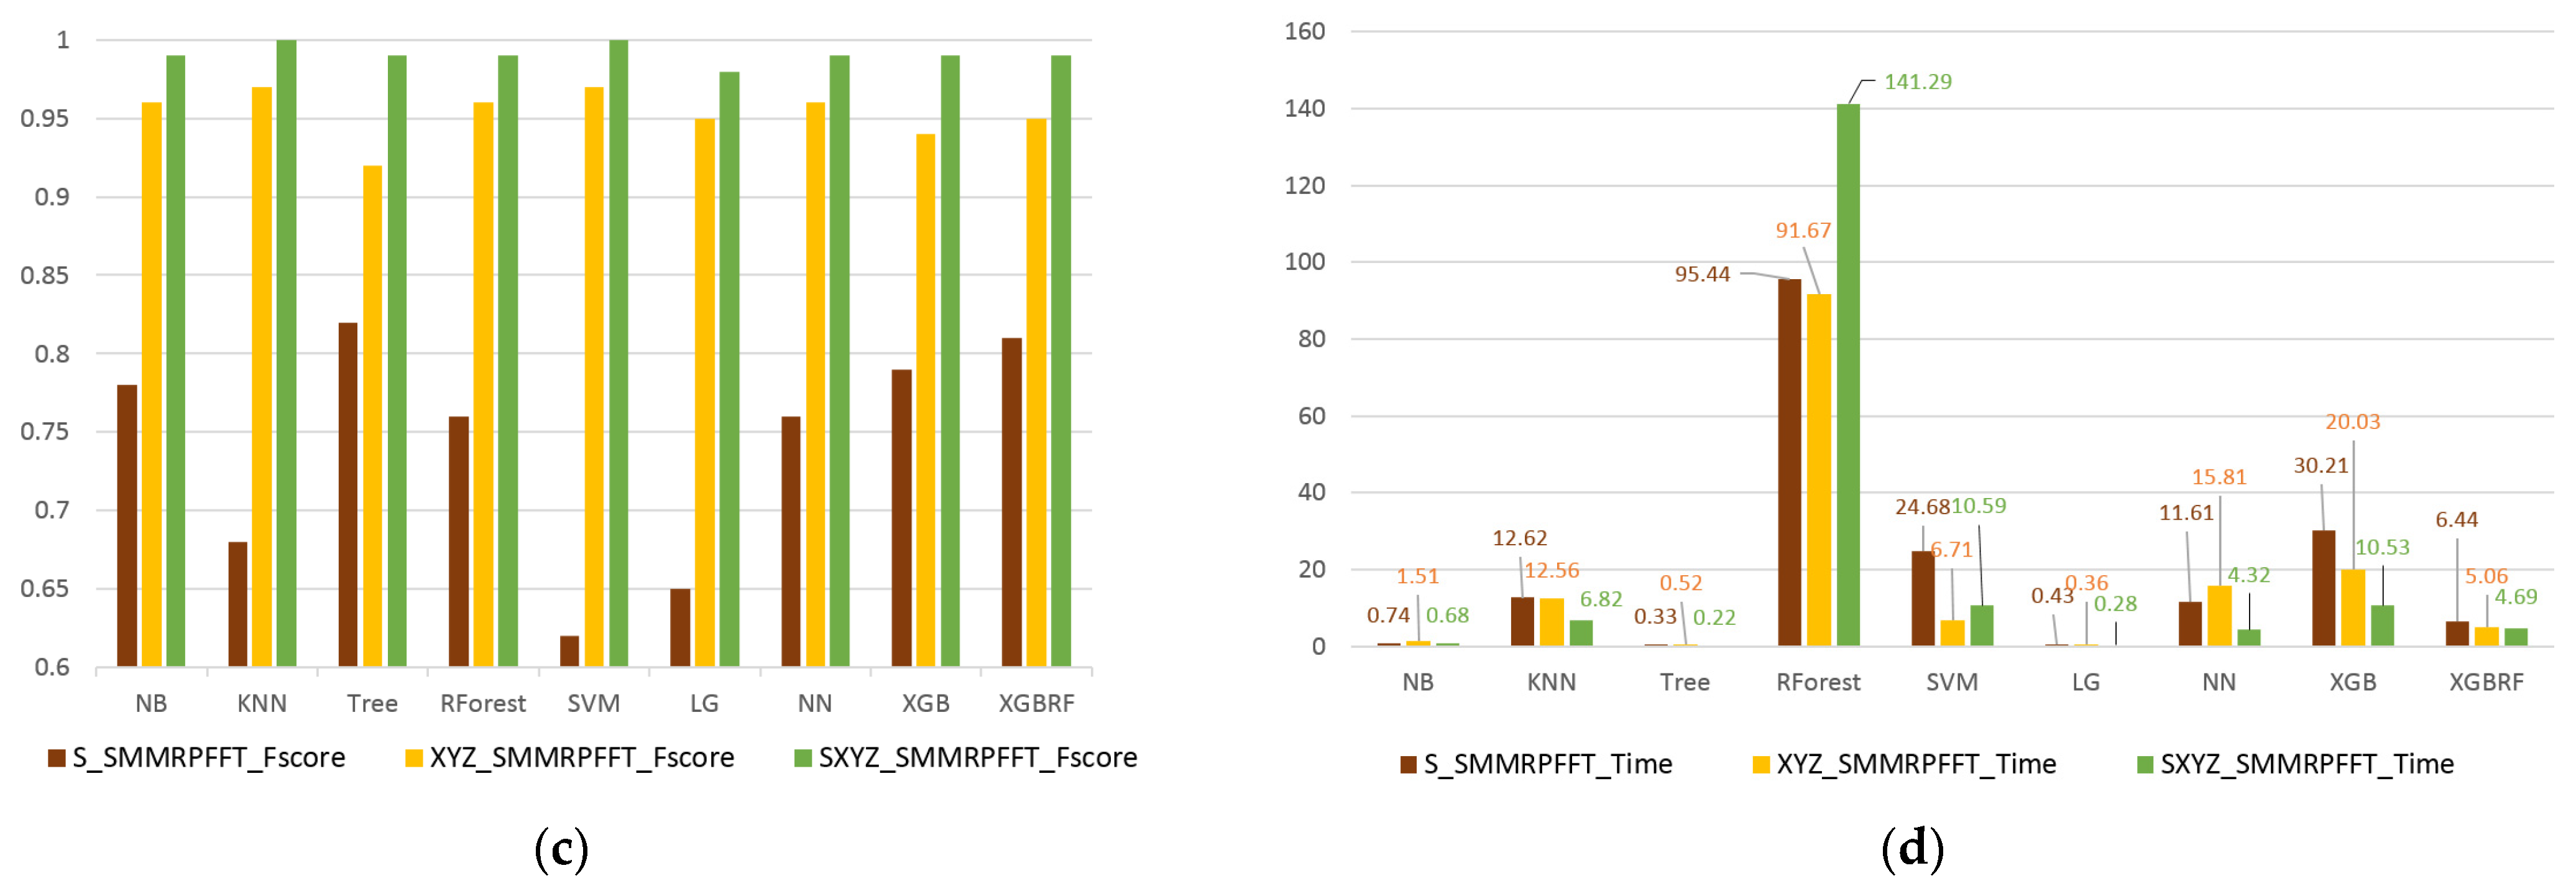
Available data are split in training (80%) and testing (20%) sets and the F-Score is used as a performance measure along with the computation time (in ms). For classification, we chose a series of classifiers based on the nature of the data, their use in the literature and their proven performance across various domains. These include Gaussian Naive Bayes (NB) classification, decision trees (Tree), random forest (RForest)—consisting of 1000 decision trees—support vector machines (SVM), the K-nearest-neighbors (KNN) algorithm, logistic regression (LG), neural networks (NN), a 2-layer MLP [12], XGBOOST (XGB) [13] and the Extreme Gradient Boosting with Random Forest (XGBRF).

3. Results

To evaluate the performance of our solution, we performed various tests with the chosen algorithms, mostly with default parameters and for the various combinations of features. In the first place, we studied the impact of the sampling period on the results. Table 1 shows that for all algorithms and combinations of features the performance in terms of F-Score is higher for a 2 s sampling (by 3.7%), but this comes at the price of an increased evaluation time by an average of 29.48% (6.2 ms) for all features and algorithms tested. We continued the remainder of tests with a sampling period of 2 s. In an attempt to identify the best combination of features, we compared the F-score and the evaluation time for all the chosen algorithms when using three features for all datasets (after PCA). While the fact that we use a only three features leads to slight decrease in performance (average of 1.66% over all algorithms) with respect to using the five most important features, i.e., SMMRP (five features), it also saves on average 41.5% of the time (or 15 ms), and thus represents a good compromise between the complexity of the task reflected by the number of features, the classification performance and the computation time.
Figure 4a shows that the use of FFT features (in orange) lead to a lower performance and the highest average performance is obtained by the combination all features (SMMRPFFT, in gray). Although normally it is not advisable to use graphs that are not to the actual scale, i.e., normally the Y axis should start at 0, we have chosen scaling in the figure to better highlight the slight differences in performance between the results obtained. According to the results in Figure 4c, the use of data from the accelerometer only (XYZ_, yellow) performed better with all models when compared to sound data only (S_, brown). Sound data only resulted in poorer performance, in particular with KNN, SVM and LG classifiers.
The best performance is achieved using the combination of the two sources of tactile data (SXYZ_, green; the gray and green bars represent the same information, but Figure 4a,c have different scales). The higher performance comes to the price of a slightly higher average evaluation time (Figure 4d) of the order of 2.8 ms with respect to the FFT features (the fastest on average). On average, LG and Tree offer the best compromise in terms of performance and evaluation time. The best overall performance, computed as an average over all feature combinations, is associated with XGBRF (F-score = 0.91) and the lowest time with LG and Tree (0.35 ms), while the highest time is associated with RForest. These findings suggest that the fusion of SMMRP and FFT features yields more powerful composite features capable of achieving good predictions while maintaining a low evaluation time and thus representing good candidates for real-time implementations for this specific dataset. However, it is important to verify that this performance generalizes to other similar tactile datasets to confirm the robustness of this novel feature combination.
Another series of tests was aimed at studying the performance by type of texture. We analyzed the confusion matrices obtained for all algorithms and all feature combinations. Table 2 shows the aggregate correct and wrong predictions, as a percentage over the total number of samples from each texture class and as an average over all the algorithms tested, for the SMMRPFFT features and for the 12 classes. One can notice that among the 12 classes, “toy-rubber-tire” (worst performance), “moquette-1”, “fabric-2”, and the two samples of “sparkle-paper” are more difficult to classify. These results are coherent with Figure 3, in which these classes are overlapping. Among the tested algorithms, Tree and NN make the most wrong classifications and XGBRF the least.

4. Discussions and Conclusions

We have successfully implemented and validated a learning method that achieves high performance (F-score) in classifying textures measured by tactile sensors. We have demonstrated the importance of selecting and extracting features to enhance classification performance. Furthermore, we demonstrated that the choice of sample period is a significant aspect of time series classification, with an important impact on classification accuracy. Longer sampling periods (2 s. vs. 1 s) provide more information for classification, leading to higher performance (average of 3.59%) but also augment the evaluation time by an average of 29.48% over all features and models. Finally, we demonstrated that the balance between performance and evaluation time is crucial for informed decisions when selecting a classification model. For the selected dataset, we identified the XGBRF to offer the best compromise between performance over all material types and computation time, while kNN represents the next best option (1% improvement in performance at the cost of 2.13 ms increase in time with respect to XGBRF for SMMRFFT).

Author Contributions

Conceptualization, M.N. and A.-M.C.; methodology, M.N. and A.-M.C.; software, M.N.; validation, M.N. and A.-M.C.; formal analysis, M.N.; investigation, M.N.; resources, A.-M.C.; data curation, M.N.; writing—original draft preparation, M.N.; writing—review and editing, M.N. and A.-M.C.; visualization, M.N.; supervision, A.-M.C.; project administration, A.-M.C.; funding acquisition, A.-M.C. All authors have read and agreed to the published version of the manuscript.

Funding

This research was funded by the NSERC Discovery grant number DDG-2020-00045.

Institutional Review Board Statement

Not applicable.

Informed Consent Statement

Not applicable.

Data Availability Statement

Data are available in this manuscript.

Acknowledgments

Thanks to the providers of the VibTac-12 dataset, O. Kursun and A. Pathoogy.

Conflicts of Interest

The authors declare no conflict of interest. The funders had no role in the design of the study; in the collection, analyses, or interpretation of data; in the writing of the manuscript; or in the decision to publish the results.

References

  1. Liu, L.; Chen, J.; Fieguth, P.; Zhao, G.; Chellappa, R.; Pietikainen, M. From BoW to CNN: Two Decades of Texture Representation for Texture Classification. Int. J. Comput. Vis. 2019, 127, 74–109. [Google Scholar] [CrossRef]
  2. Luo, S.; Yuan, W.; Adelson, E.; Cohn, A.G.; Fuentes, R. Vitac: Feature sharing between vision and tactile sensing for cloth texture recognition. In Proceedings of the IEEE International Conference on Robotics and Automation (ICRA), Brisbane, QLD, Australia, 21–25 May 2018. [Google Scholar]
  3. Kursun, O.; Patooghy, A. An Embedded System for Collection and Real-Time Classification of a Tactile Dataset. IEEE Access 2020, 8, 97462–97473. [Google Scholar] [CrossRef]
  4. Oliveira, T.E.A.; Cretu, A.-M.; Petriu, E.M. A Multi-Modal Bio-Inspired Tactile Sensing Module for Surface Characterization. Sensors 2017, 17, 1187. [Google Scholar] [CrossRef] [PubMed]
  5. Humeau-Heurtier, A. Texture feature extraction methods: A survey. IEEE Access 2019, 7, 8975–9000. [Google Scholar] [CrossRef]
  6. Kerr, E.; McGinnity, T.; Coleman, S. Material recognition using tactile sensing. Exp. Syst. Appl. 2018, 94, 94–111. [Google Scholar] [CrossRef]
  7. Wang, S.; Albini, A.; Maiolino, P.; Mastrogiovanni, F.; Cannata, G. Fabric Classification Using a Finger-Shaped Tactile Sensor via Robotic Sliding. Front. Neurorobot. 2022, 16, 808222. [Google Scholar] [CrossRef]
  8. Huang, S.; Wu, H. Texture Recognition Based on Perception Data from a Bionic Tactile Sensor. Sensors 2021, 21, 5224. [Google Scholar] [CrossRef]
  9. Kursun, O.; Patooghy, A. VibTac-12: Texture Dataset Collected by Tactile Sensors; IEEE Dataport: Piscataway, NJ, USA, 2020. [Google Scholar] [CrossRef]
  10. McFee, B.; Raffel, C.; Liang, D.; Ellis, D.P.; McVicar, M.; Battenberg, E.; Nieto, O. Librosa: Audio and music signal analysis in python. In Proceedings of the 14th Python in Science Conference, Austin, TX, USA, 6–12 July 2015; Volume 8, pp. 18–24. [Google Scholar]
  11. Korobov, M.; Lopuhin, K. ELI5 Documentation Release 0.11.0, 23 January 2021. Available online: https://readthedocs.org/projects/eli5/downloads/pdf/latest/ (accessed on 19 September 2023).
  12. Géron, A. Hands-On Machine Learning with Scikit-Learn, Keras, and TensorFlow, 2nd ed.; O’Reilly Media: Sebastopol, CA, USA, 2019. [Google Scholar]
  13. Chen, T.; Guestrin, C. XGBoost: A Scalable Tree Boosting System. In Proceedings of the 22nd ACM SIGKDD International Conference on Knowledge Discovery and Data Mining, San Francisco, CA, USA, 13–17 August 2016. [Google Scholar] [CrossRef]
Figure 1. Proposed approach for texture classification.
Engproc 58 00005 g001
Figure 2. (a) Sample of data; and (b) feature importance in the dataset using SMMRP features.
Engproc 58 00005 g002
Figure 3. Principal component analysis for (a) SMMRP; (b) FFT; and (c) SMMRPFFT features (Note: the three axes of each figure represent the first 3 PCA components).
Engproc 58 00005 g003
Figure 4. Comparison of: (a) F-score for SMMRP, FFT and SMMRPFFT features; (b) computation time (in ms) for SMMRP, FFT and SMMRPFFT features; (c) F-score for sound S_, accelerometer XYZ_ and sound and accelerometer data (SXYZ_) for SMMRPFFT features for 2 s sampling period; and (d) computation time for sound S_, accelerometer XYZ_ and sound and accelerometer data (SXYZ_) for SMMRPFFT features; for 2 s sampling period.
Engproc 58 00005 g004aEngproc 58 00005 g004b
Table 1. Comparison for sampling rate of 1 s (1s-) and 2 s (2s-) in terms of F-Score.
NBKNNTreeRForestSVMLGNNXGBXGBRFAverage
1s—SMMRP-PCA (5 feat.)0.950.940.940.950.940.910.960.970.950.95
1s—FFT-PCA (4 feat.)0.950.950.940.950.930.940.950.950.940.94
2s—SMMRP-PCA (5 feat.)0.980.990.9710.980.9710.980.990.984
2s—FFT-PCA (4 feat.)0.990.960.980.990.960.9610.990.990.980
Table 2. Correct and wrong predictions per texture type (material) using SMMRPFFT features.
MaterialCorrect Predictions (%)Wrong Predictions—Material Type, Algorithm (%)
fabric-1100
aluminium_film100
fabric-290moquette-1, XGB (5%), toy-tire-rubber, NN (5%)
fabric-3100
moquette-177fabric-2, NN, LG, SVM (16%), fabric-4, NN (7%)
moquette-2100
fabric-4100
sticky fabric-5100
sticky-fabric100
sparkle-paper-195sparkle_paper-2, LG (5%)
sparkle-paper-292sparkle_paper-1, Tree (8%)
toy-tire-rubber55fabric-1, LG, SVM, RForest, Tree, kNN, NB (44%)
Disclaimer/Publisher’s Note: The statements, opinions and data contained in all publications are solely those of the individual author(s) and contributor(s) and not of MDPI and/or the editor(s). MDPI and/or the editor(s) disclaim responsibility for any injury to people or property resulting from any ideas, methods, instructions or products referred to in the content.

