Proceeding Paper

Computational Feasibility Study for Time-Frequency Analysis of Non-Stationary Vibration Signals Based on Wigner-Ville Distribution †

by
Luis Otávio de Angeles Dias
*,
Pedro Oliveira Conceição Junior
and
Paulo Monteiro de Carvalho Monson
Department of Electrical and Computer Engineering, São Carlos School of Engineering (EESC), University of São Paulo (USP), São Carlos 13566-590, SP, Brazil
*
Author to whom correspondence should be addressed.
Presented at the 10th International Electronic Conference on Sensors and Applications (ECSA-10), 15–30 November 2023; Available online: https://ecsa-10.sciforum.net/.
Eng. Proc. 2023, 58(1), 126; https://doi.org/10.3390/ecsa-10-16193
Published: 15 November 2023

Abstract

:
The time-frequency analysis has garnered attention for research due to its applications in studying non-stationary signals, revealing information often obscured by conventional time or frequency domain analysis. This study aims to reduce the computational cost associated with large dataset analysis using the smoothed pseudo Wigner-Ville distribution (WVD), a valuable time-frequency tool for analyzing various signal data. We used a 9000-sample acoustic signals from a milling machine, sampled at 100 kHz. Three approaches were pursued: the first consisting in calculating the average WVD from equidistant time windows; the second consisting in reducing the sampling rate by a factor of ‘k’ by creating an array where each ‘nth’ element corresponds to the ‘k*nth’ element of the original signal; and the third consisting in a joint analysis, incorporating a preprocessing routine into the second method. The mean WVD method distorted the time-frequency diagram with middle-range frequencies, while the second approach preserved the WVD, even with significant ‘k’ factors, reducing analysis time significantly. The Incorporation of the preprocessing routine in the sampling rate reduction process markedly reduces analysis time.

1. Introduction

Machine learning-based artificial intelligence systems are becoming increasingly important in monitoring conditions in manufacturing processes due to the possibilities of automating manual processes and making real-time decisions based on data generated by sensors. Following new industrial practices and the concept of Industry 4.0, such intervention will ensure a smarter and automated manufacturing process, resulting in improved quality and cost reduction [1,2,3].
Convolutional neural networks (CNNs) stand out as powerful tools for the tasks mentioned above, particularly for image recognition and processing through deep learning algorithms. These algorithms can be trained to recognize patterns indicating tool wear onset, predict when a tool needs replacement, classify different levels of wear, and estimate remaining useful life. However, technical challenge when using CNNs is related to long sequences, such as those derived from monitoring a manufacturing process, which can become a complex task requiring high computational demand. In the study conducted by Wang and Oates [4], an approach for transforming time series data into images was developed, enabling the extraction of features by CNN in time series analysis. While the strategy of converting time series into images has proven effective, due to the aforementioned challenges, there is a need for tools that can overcome the limitations of training with long sequences and provide greater clarity in interpreting their decisions.
Therefore, the aim of the present study is to assess the feasibility of using time-frequency representations as a feature extraction tool from non-stationary signals, while also providing the ability to correlate the tool condition with changes in the frequency spectrum corresponding to the acoustic signal. The data analyzed in this work corresponds to the study of the milling process. It is employed for the manufacturing of a wide variety of parts, characterized by its ability to remove material from the surface of the work-piece, giving it complex shapes and precise finishing. The machining process of parts inevitably involves the wear of the milling cutter, resulting in a gradual loss of its cutting precision. This degradation can lead to the production of parts with inadequate finishing or damage. Hence, in order to enhance this operation’s quality, it is of great ambition to monitor the preceding phenomenon. In this study, time series data based on acoustic emission signals related to the milling tool wear were transformed into images using the Wigner-Ville distribution (WVD), as employed by Scholl [5]. The time-frequency representation will be particularly useful in examining the variable frequency content at different time intervals in the signal, potentially providing additional insights into the level, intensity, and onset of tool wear. Related approaches in the literature have used short-time Fourier transform [6] and wavelet transform [7]. The WVD method serves as an alternative not yet reported within the scope of this study. A scientific gap lies at the computational cost associated with applying WVD to large datasets, limiting its practical utility. This study addresses this challenge by employing methods such as the average spectrum, sampling frequency reduction, and joint signal analysis to overcome the computational cost of WVD, enabling more reliable analysis of non-stationary signals. The results are also expected to contribute to the automation of the manufacturing process and the optimization of tool life in machining operations, specifically focusing on the milling process.

2. Material and Methods

Three ways to carry out the diminish of computational cost aforementioned were proposed, which will be detailed in the following subtopics.

2.1. Dataset

The dataset taken as reference was obtained from the work of [8], which consists of a MATLAB structure composed of acoustic emission signals with 9000 samples, obtained from a sampling frequency of 100 kHz using the WD 925 sensor for monitoring purposes. The experiments of the dataset were conducted on a milling machine for different speeds, feeds, and depth of cut. The tool wear, VB, was also measured for each test series. For the first two subsequent analysis, the signal was filtered by a band-pass filter at the band 5 to 7 kHz with the objective of easing the analysis.

2.2. Methodology of the Resulting Average Spectrum

In this methodology, three sample windows were extracted from the original signal, all of the same size, representing three different instants of the sampling: the beginning, middle, and end of the milling process. From these three sub-signals, a fourth one was generated following the relationship presented in the equation below:
a m i = a 1 i + a 2 i + a 3 i 3
where a m i , a 1 i , a 2 i , a 3 i are the i-th terms, respectively, of the final sub-series and the three time windows taken from the original signal.

2.3. Methodology of Reducing the Sampling Frequency

In this approach to mitigate the computational cost of the WVD, a sub-series of the original signal was generated in such a way that:
b i = k · a i
where b i , a i represent, respectively, the i-th term of the resulting signal and the original signal. In the meantime, the resulting signal is a version of the original signal sampled at a sampling frequency:
f b = f a k
where f b and f a are the respective sampling frequencies of the resulting signal and the original, and k is the sampling frequency division factor.

2.4. Joint Analysis

It was also tracked a joint analysis based on associating the aforesaid method of diminishing the sample frequency with a preprocessing of the signals analysed. The latter was executed in two main steps. First, signal noise was eliminated by applying a low-pass filter with cut frequency of 40 kHz. The selection of this frequency band also better simulates the research conditions, since it represents the overall band of the acoustic emission signal. Then, undesired transient information was eliminated by selecting an interval of the original signal correspondent to the stabilization of the milling process.
As a result of the 40 kHz bandwidth and following the Nyquist Criterion, the new sampling frequency taken was 80 kHz, which means a division factor of:
k = 1.25
This factor was obtained by discarding every sample whose position was a multiple of five from the original signal.

3. Results and Dicussion

3.1. Methodology of the Resulting Average Spectrum

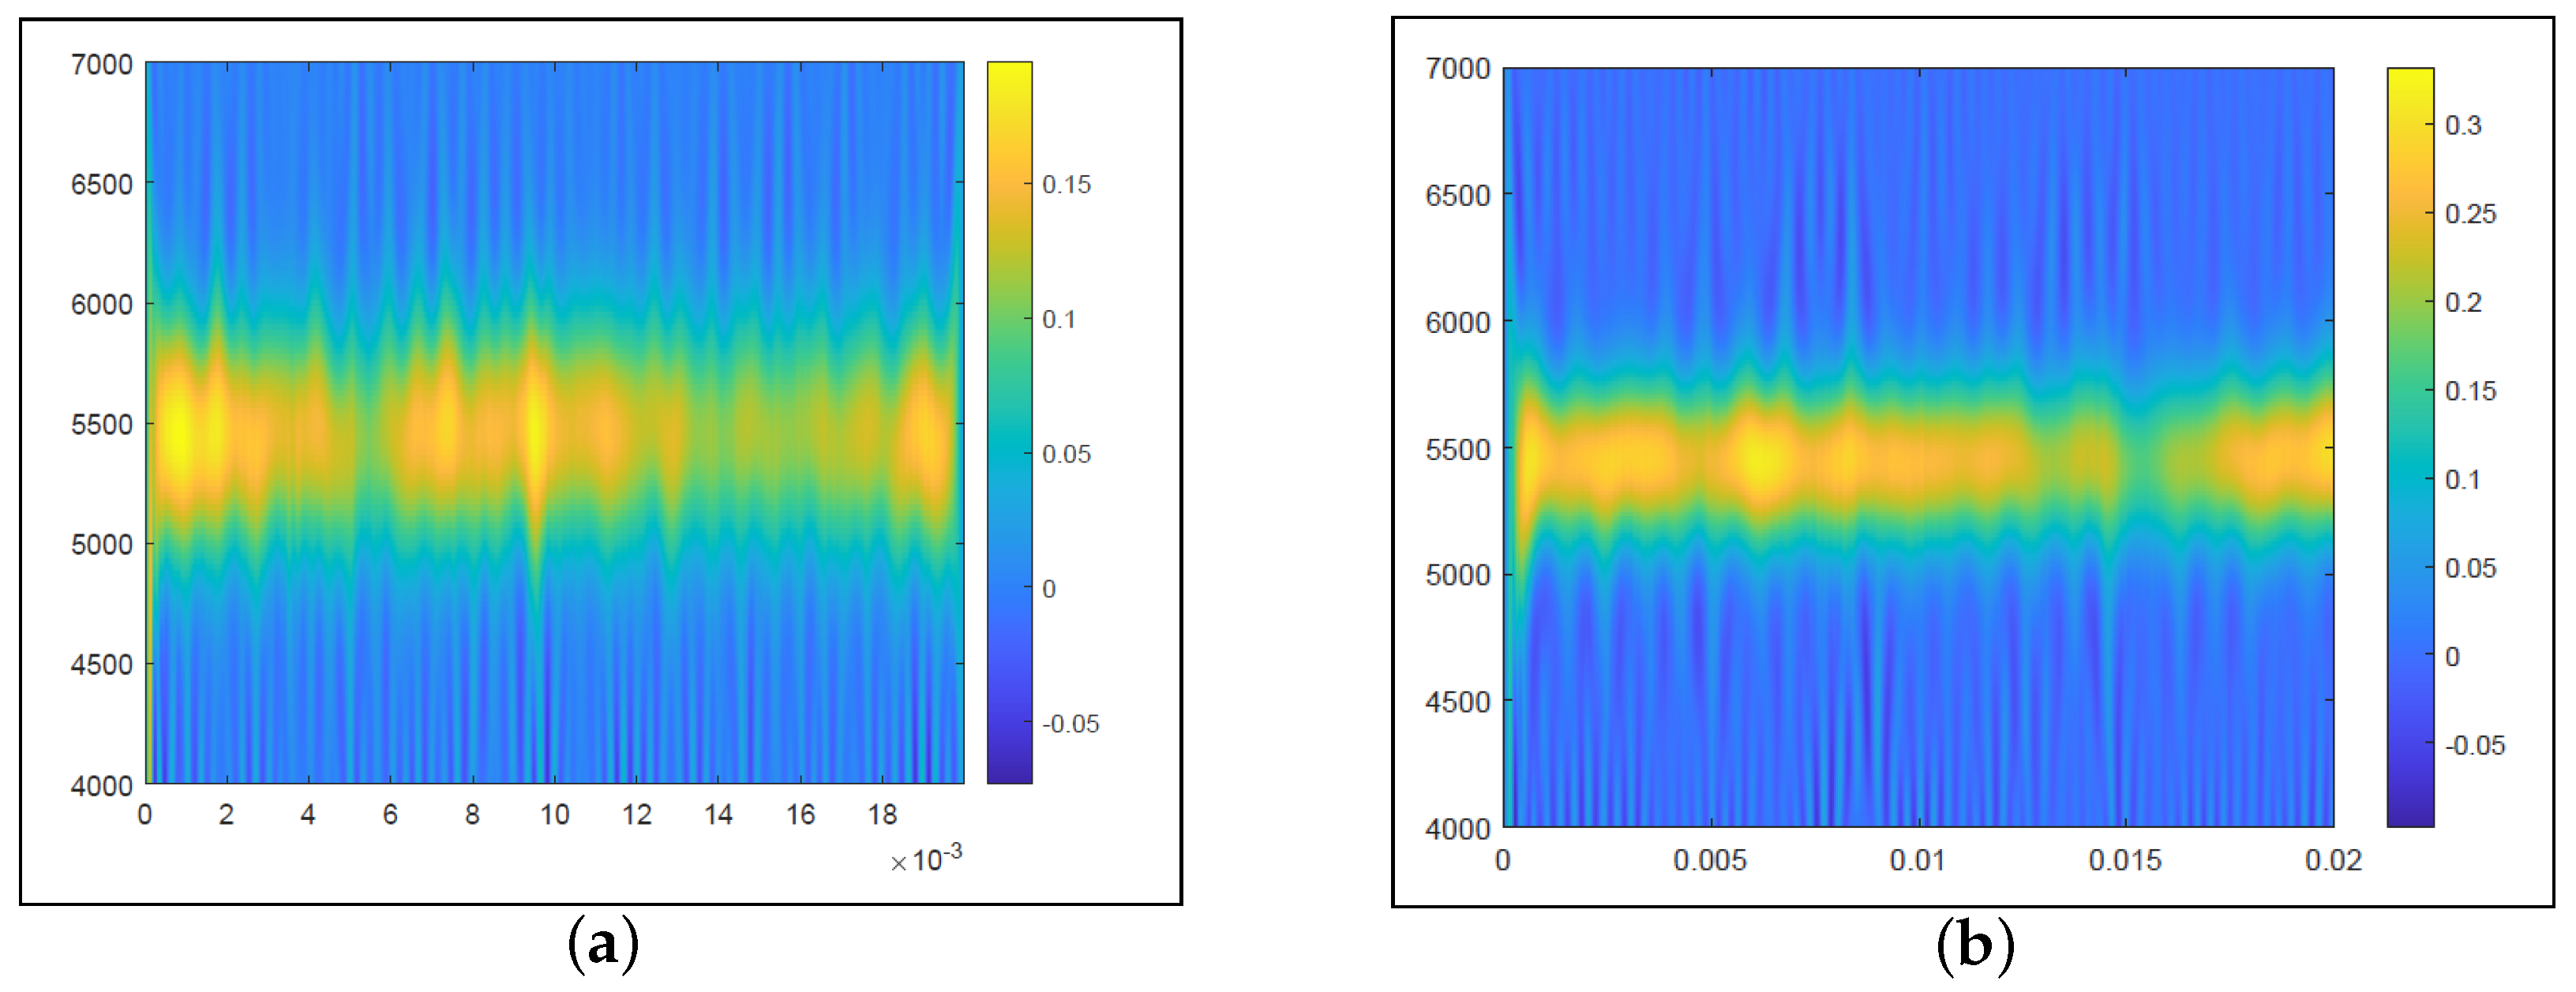
For the sake of simplicity, the following methods’ results will be shown for only one signal from the dataset mentioned previously. The WVD of the signal, without any prior treatment, is shown in the Figure 1.

3.2. Methodology of the Resulting Average Spectrum

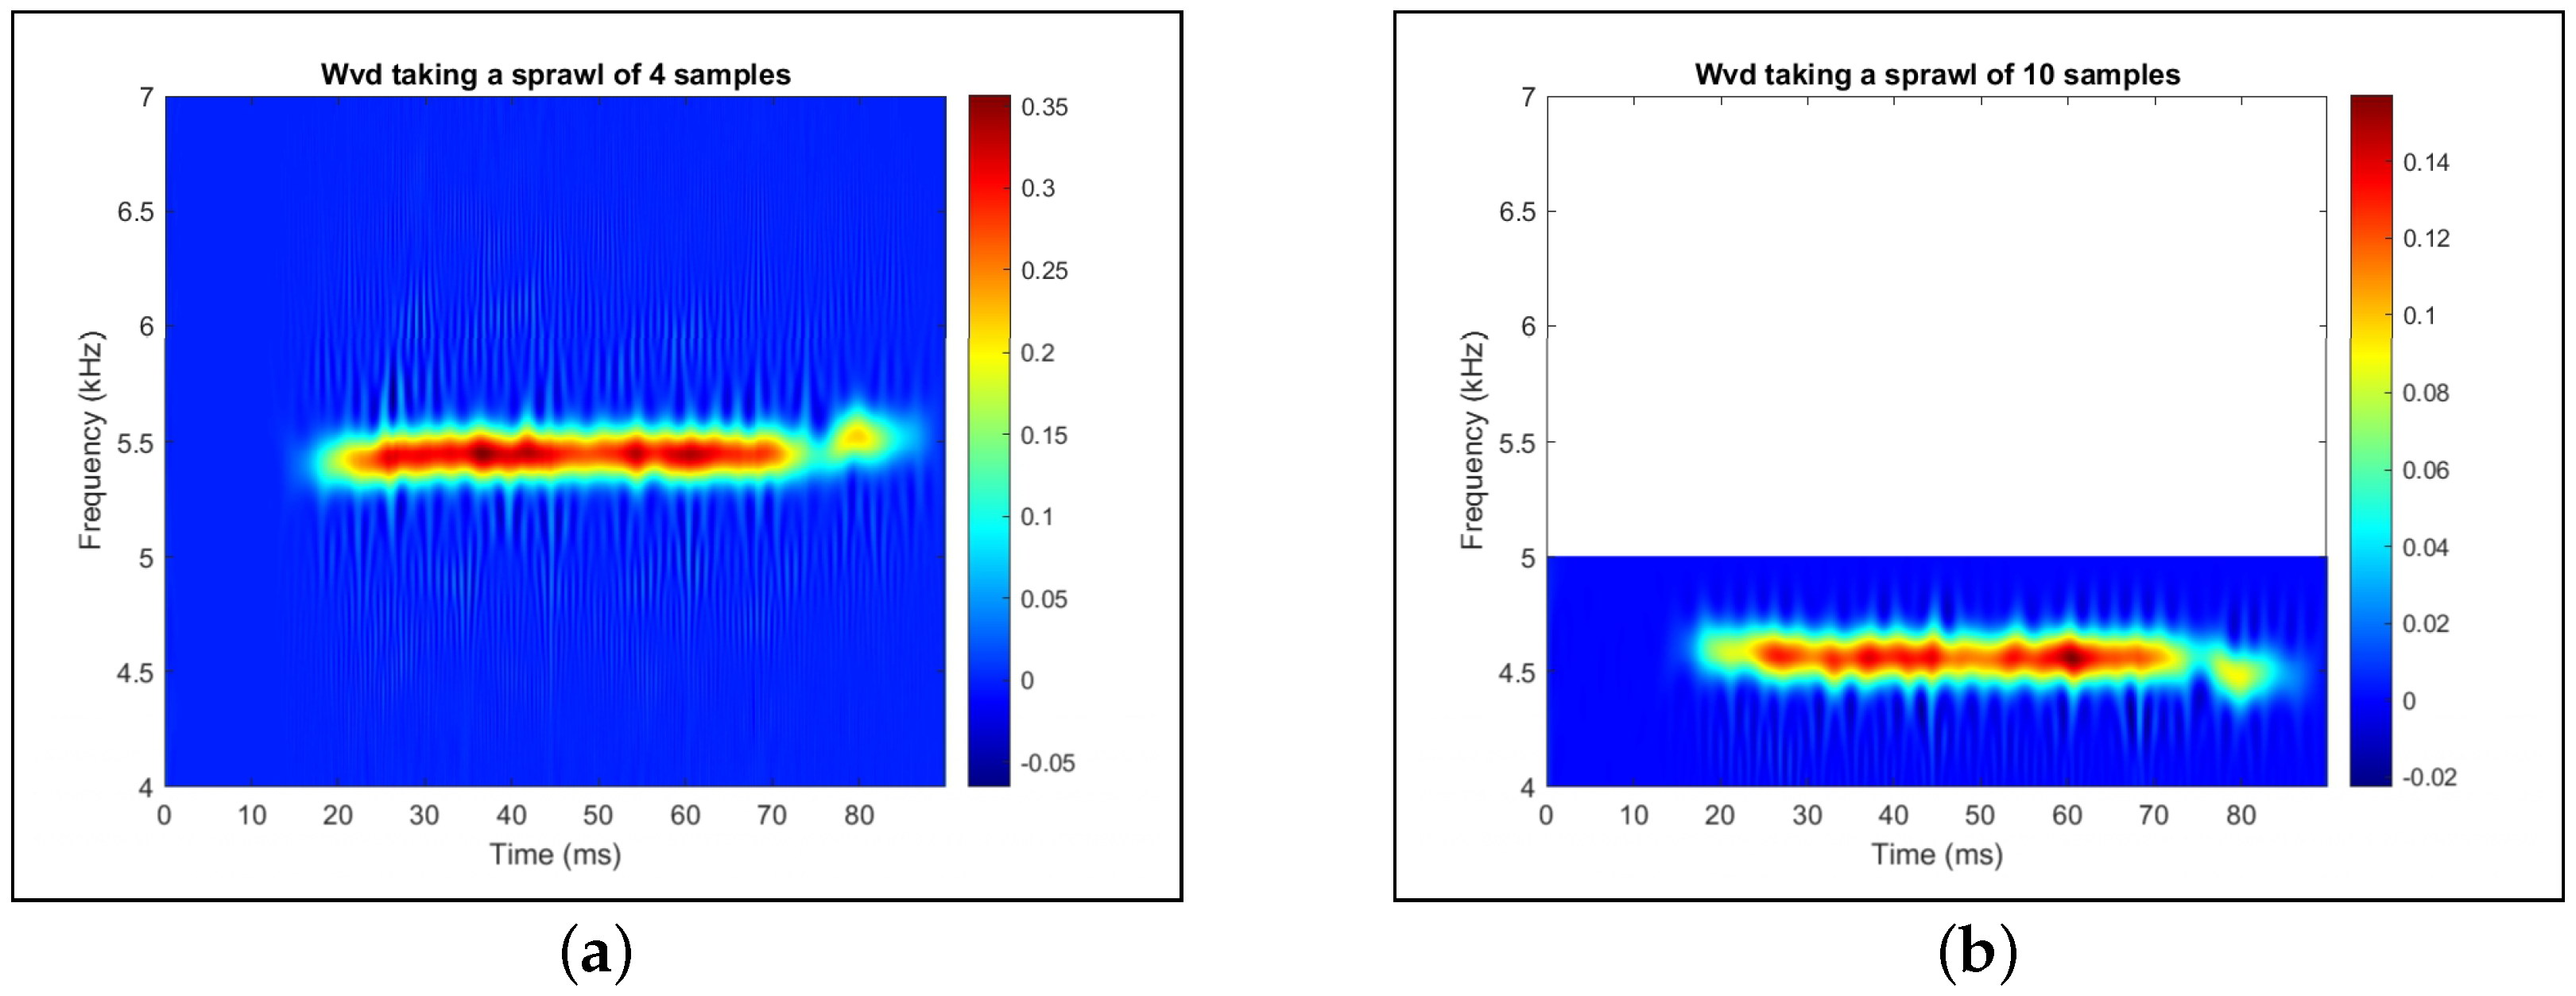
The analysis of the average spectrum from 2000 and 3000 sample windows based on the WVD is shown in Figure 2 below. In this figure, the horizontal axis represents time in seconds, while the vertical axis represents the signal’s component frequency in Hz.
Using the methodology of the average spectrum, the compilation time for the observed plot was significantly shorter than that taken to produce Figure 1a. Furthermore, the signal’s spectral density remains close to 5.5 kHz, as in the original plot. However, it is noteworthy that no windowing time adopted was able to faithfully reproduce the original signal’s spectrum. The reason for this mismatch between the spectra presented in Figure 2 and the original spectrum is due to the multidimensional nature of the tool used. The calculation of the average between the spectra of the adopted time windows resulted in the mixing of the energy densities of the spectrum in these analyzed time intervals, resulting in distortions in the final average spectrum that propagate throughout the temporal extension of the WVD.

3.3. Methodology of Reducing the Sampling Frequency

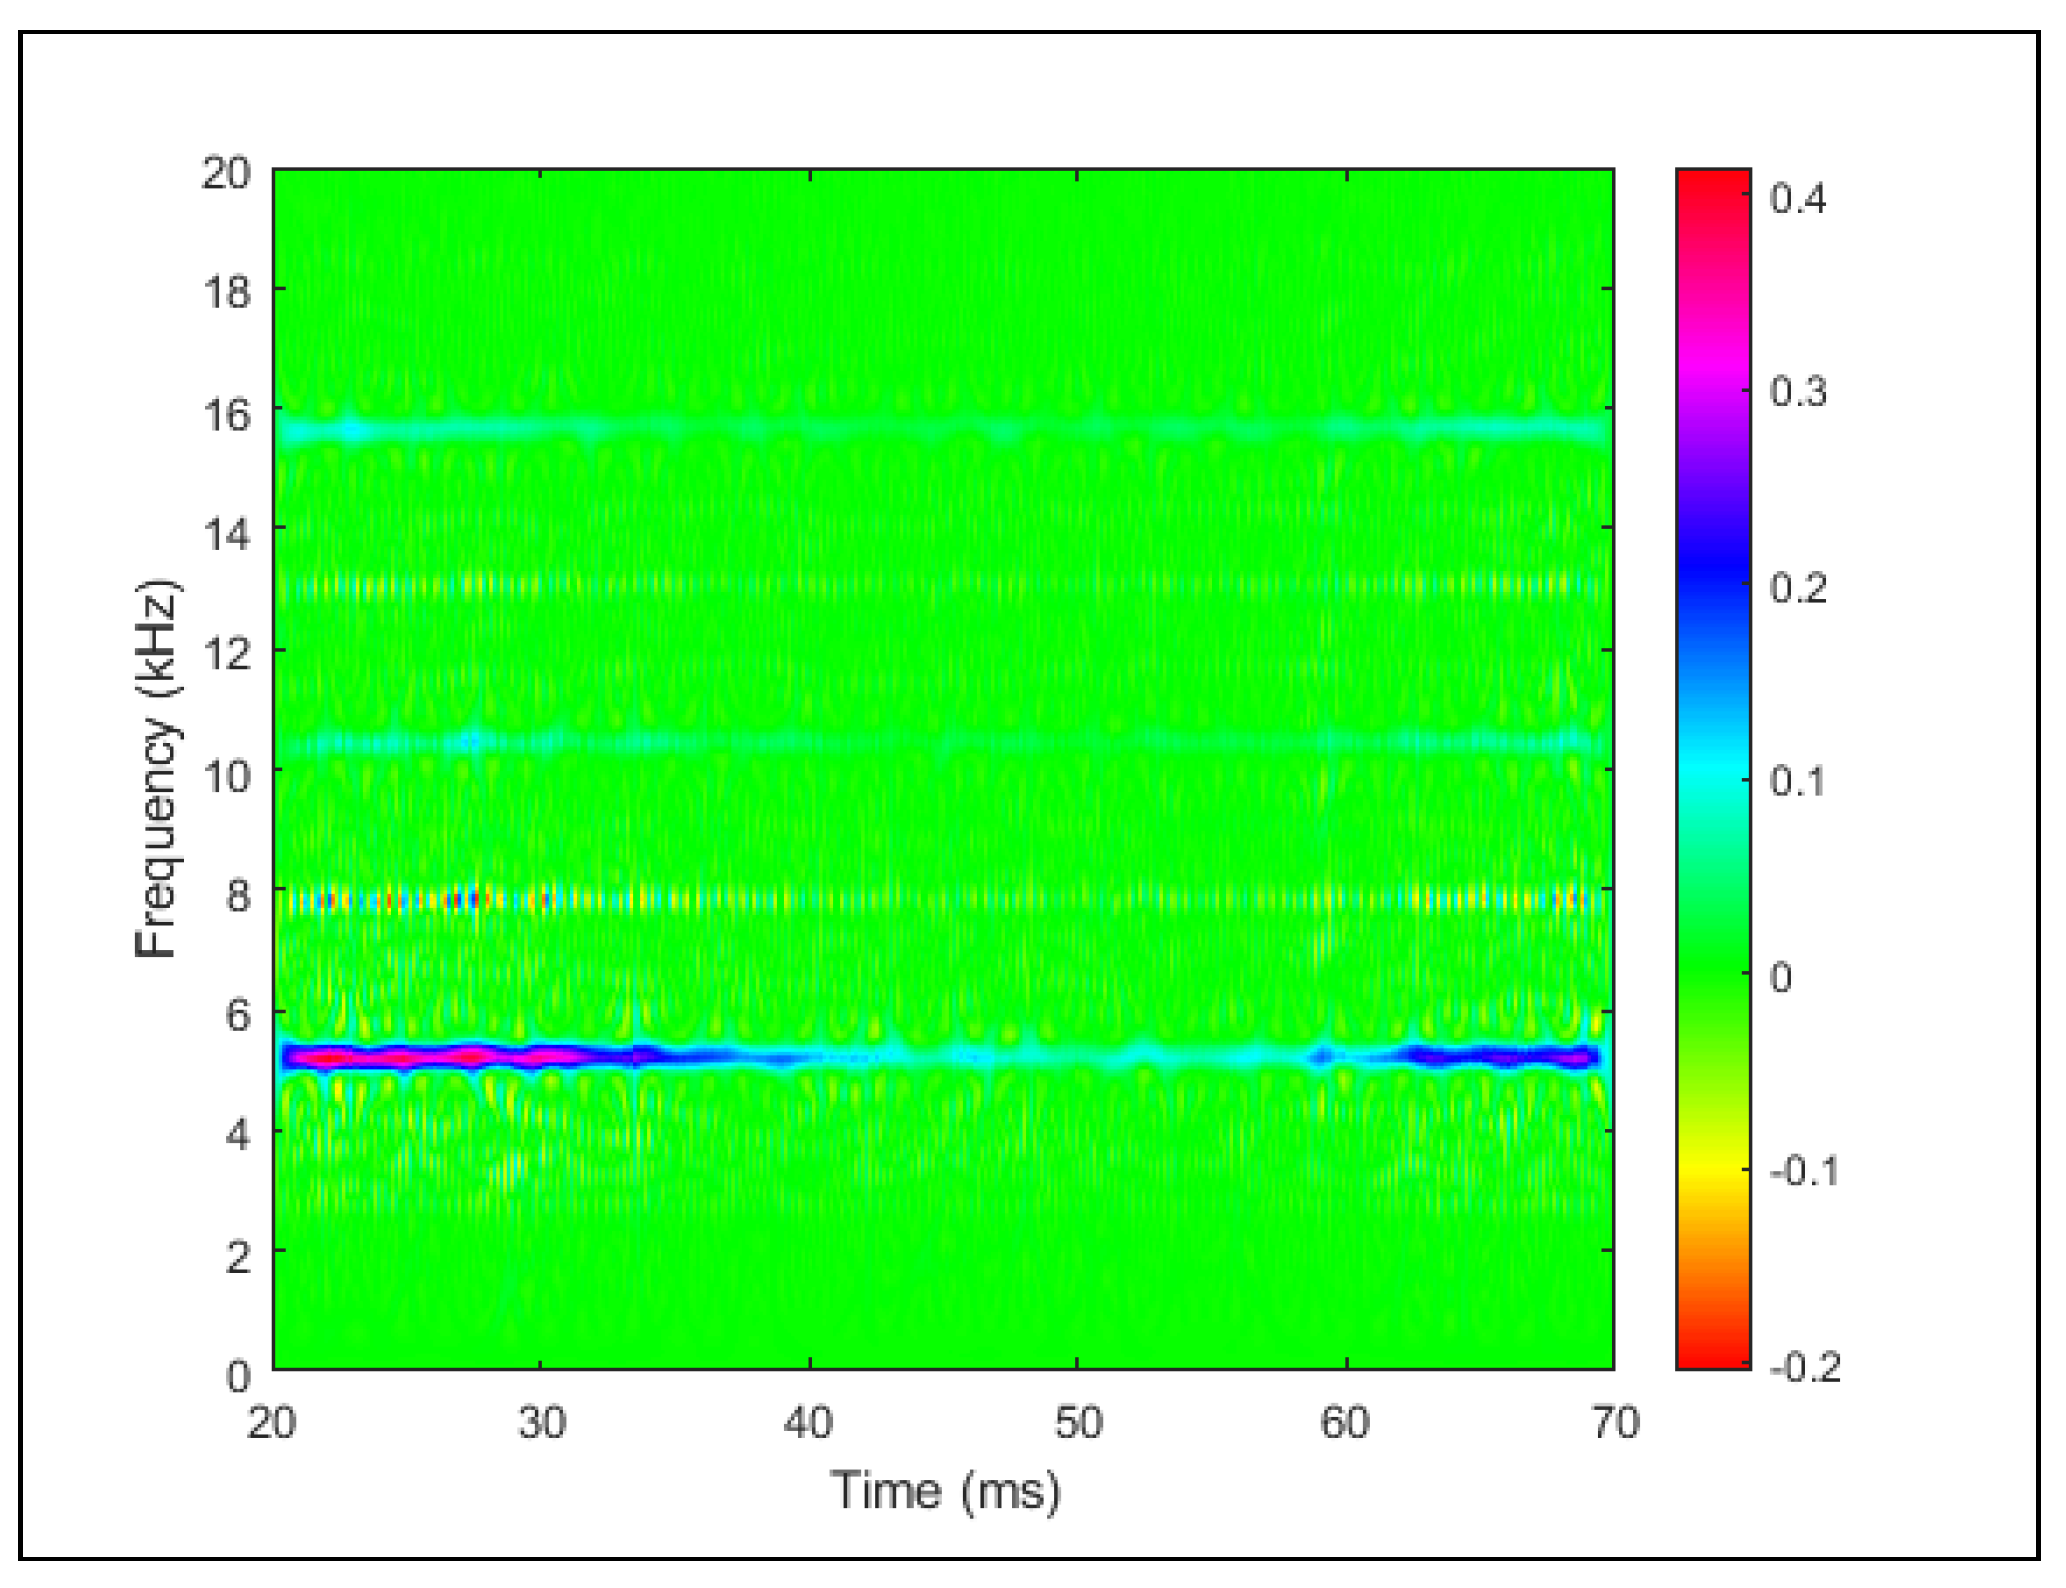
The compilation of spectra for this methodology took significantly less time than that spent on the average spectrum analysis and notably yielded better results compared to the method being compared, maintaining the signal’s spectrum even for a sample size six times smaller than the original signal. However, it can be observed from Figure 3b that the tool loses resolution with high values of k. This occurs as the sampling frequency division ( F a ) must still adhere to Nyquist’s Law, which dictates that F a must be at least 2 times greater than the signal’s bandwidth. Since the original signal has a bandwidth of 40 kHz, the reduction in sampling frequency could not adopt values of the division factor k large enough for a useful reduction in computational cost. In this scope, greater changes in time analysis, using this approach, can only be achieved for lower frequency bands of the signal.

3.4. Joint Analysis

By analyzing the signal time-series plot, it can be observed that the moment where the milling process stabilizes is approximately 20–70 ms. This interval corresponds for samples number 2000 to 7000 of the signal.
Applying the original signal by a band-pass filter from 1–40 kHz, dividing the sample rate by a factor of 1.25 and taking the aforementioned interval of the signal results in Figure 4:
Figure 4 is identical to Figure 1b, with the only difference being the time range. The time taken to plot the former was about 5 s, while the latter took 75 s to be prepared. This proves that the approach reported in this subsection is of great efficiency, and enhances significantly the time of analysis without damaging the original information.

4. Conclusions

This research delved into the realm of time-frequency analysis, with a specific focus on addressing the computational challenges associated with the analysis of large datasets. The study harnessed the smoothed pseudo Wigner-Ville distribution (WVD) as a potent tool for time-frequency analysis, utilizing a 9000-sample acoustic signal from a milling machine, sampled at 100 kHz, and filtered between 1 kHz to 8 kHz. In essence, this research has showcased the feasibility of employing a joint preprocessing of the signal, consisting in incorporating noise and transient data elimination to the second method formerly presented, as a valuable technique for reducing the computational burden associated with large dataset analysis in the realm of time-frequency analysis. By offering a pragmatic solution that balances computational efficiency with the preservation of analytical fidelity, this study paves the way for more efficient and expedited analysis of non-stationary signals in various applications. The findings of this research can be instrumental in enhancing the practicality and utility of time-frequency analysis for researchers and practitioners working with substantial datasets in diverse fields.

Author Contributions

Conceptualization, P.O.C.J., L.O.d.A.D. and P.M.d.C.M.; methodology, P.O.C.J. and L.O.d.A.D.; software, L.O.d.A.D.; validation, P.O.C.J. and L.O.d.A.D.; formal analysis, P.O.C.J., L.O.d.A.D. and P.M.d.C.M.; investigation, L.O.d.A.D.; resources, P.O.C.J.; data curation, P.O.C.J. and L.O.d.A.D.; writing—original draft preparation, L.O.d.A.D.; writing—review and editing, P.O.C.J. and L.O.d.A.D.; visualization, L.O.d.A.D.; supervision, P.O.C.J.; project administration, P.O.C.J.; funding acquisition, P.O.C.J. All authors have read and agreed to the published version of the manuscript.

Funding

This research was funded by the São Paulo Research Foundation (FAPESP), under grants: #2023/02413 and #2023/02447-4, and the Pro-Rectory of Research and Innovation of the University of São Paulo (USP), under grant: #22.1.09345.01.2.

Institutional Review Board Statement

Not applicable.

Informed Consent Statement

Not applicable.

Data Availability Statement

Publicly available dataset was analyzed in this study. This data can be found here: [https://www.nasa.gov/intelligent-systems-division/discovery-and-systems-health/pcoe/pcoe-data-set-repository/]. 3. Milling. (accessed on 5 April 2023).

Acknowledgments

The authors would like to thank the São Paulo Research Foundation (FAPESP) and the Pro-Rectory of Research and Innovation of the University of São Paulo (USP) for supporting this research work.

Conflicts of Interest

The authors declare no conflict of interest.

Abbreviations

The following abbreviations are used in this manuscript:
WVDWigner−Ville Distribution
CNNConvolutional Neural Networks

References

  1. Çınar, Z.M.; Abdussalam Nuhu, A.; Zeeshan, Q.; Korhan, O.; Asmael, M.; Safaei, B. Machine Learning in Predictive Maintenance towards Sustainable Smart Manufacturing in Industry 4.0. Sustainability 2020, 12, 8211. [Google Scholar] [CrossRef]
  2. Ding, H.; Gao, R.X.; Isaksson, A.J.; Landers, R.G.; Parisini, T.; Yuan, Y. State of AI-Based Monitoring in Smart Manufacturing and Introduction to Focused Section. IEEE/ASME Trans. Mechatron. 2020, 25, 2143–2154. [Google Scholar] [CrossRef]
  3. Serin, G.; Sener, B.; Ozbayoglu, A.M.; Unver, H.O. Review of tool condition monitoring in machining and opportunities for deep learning. Int. J. Adv. Manuf. Technol. 2020, 109, 953–974. [Google Scholar] [CrossRef]
  4. Wang, Z.; Oates, T. Imaging Time-Series to Improve Classification and Imputation. arXiv 2015, arXiv:1506.00327. [Google Scholar]
  5. Scholl, S. Fourier, Gabor, Morlet or Wigner: Comparison of Time-Frequency Transforms. arXiv 2021, arXiv:2101.06707. [Google Scholar]
  6. Huang, Z.; Zhu, J.; Lei, J.; Li, X.; Tian, F. Tool Wear Monitoring with Vibration Signals Based on Short-Time Fourier Transform and Deep Convolutional Neural Network in Milling. Math. Probl. Eng. 2021, 2021, 9976939. [Google Scholar] [CrossRef]
  7. Aghazadeh, F.; Tahan, A.; Thomas, M. Tool condition monitoring using spectral subtraction and convolutional neural networks in milling process. Int. J. Adv. Manuf. Technol. 2018, 98, 3217–3227. [Google Scholar] [CrossRef]
  8. Kai Goebel, A.A. Documentation for Mill Data Set; NASA AMES Research Center: Mountain View, CA, USA, 2007. [Google Scholar]
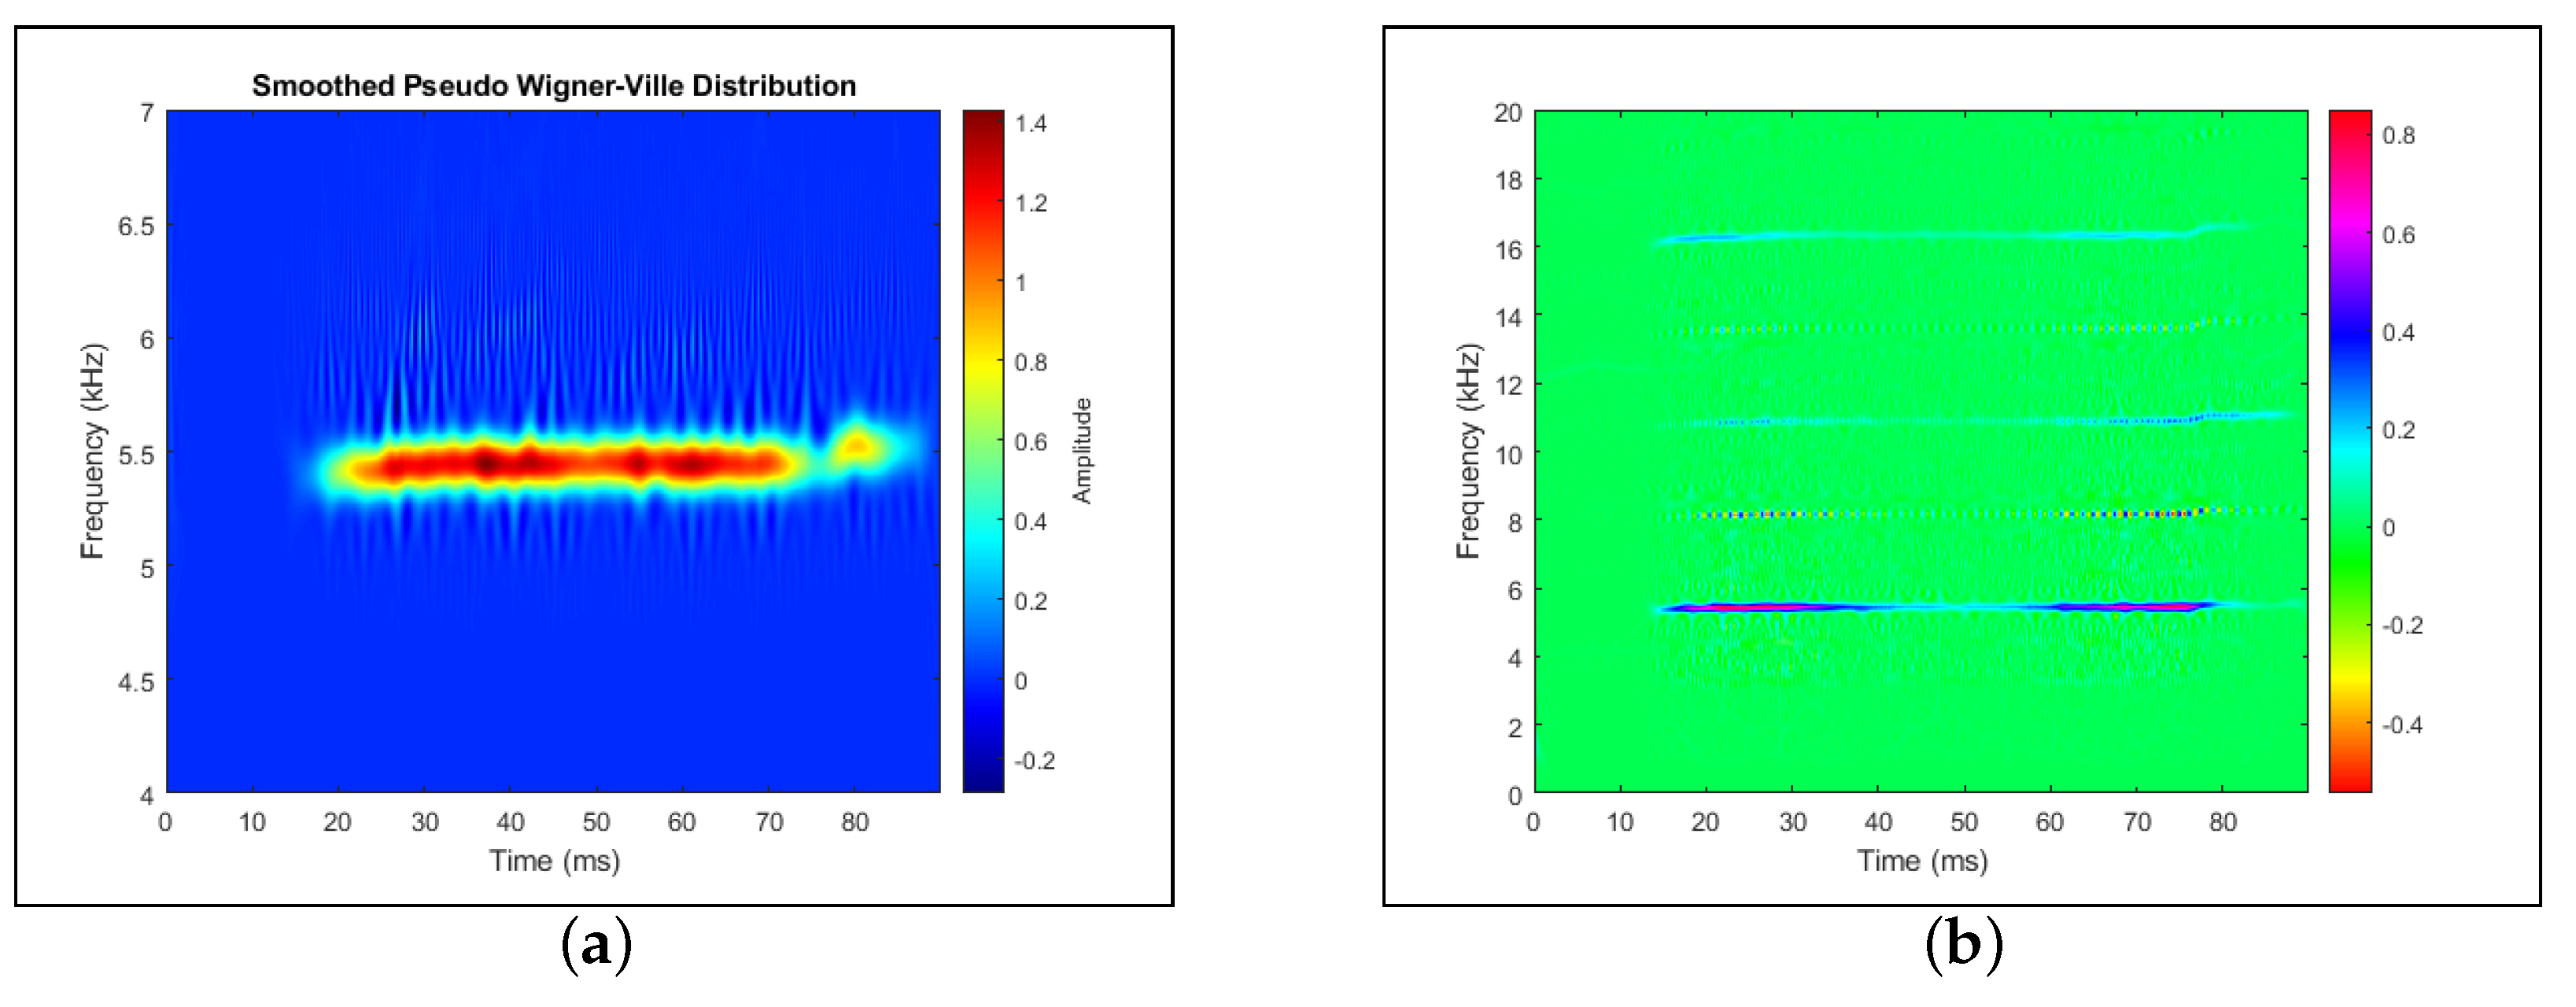
Figure 1. WVD of the Signal. (a) For the band 4 kHz to 7 kHz. (b) For the full signal band.
Engproc 58 00126 g001
Figure 2. Mean spectrum for 2000 and 3000 sample windows. (a) WVD of the average spectrum obtained from 2000 samples of the original signal. (b) WVD of the average spectrum obtained from 3000 samples of the original signal.
Engproc 58 00126 g002
Figure 3. WVD obtained for different sampling frequency division factors k. (a) WVD for k = 4 . (b) WVD for k = 10 .
Engproc 58 00126 g003
Figure 4. WVD of the signal after joint analysis.
Engproc 58 00126 g004
Disclaimer/Publisher’s Note: The statements, opinions and data contained in all publications are solely those of the individual author(s) and contributor(s) and not of MDPI and/or the editor(s). MDPI and/or the editor(s) disclaim responsibility for any injury to people or property resulting from any ideas, methods, instructions or products referred to in the content.