Abstract
Biosensors hold great promise as diagnostic devices that gain the information needed to discern between different types and severities of infection. Accurate diagnostic information allows for appropriate antimicrobial usage, thereby benefiting patient welfare and curbing the development of antimicrobial resistance. With these aims in mind, a nano- and microfiber mesh-based transducer platform for use in aqueous media was developed. When used in an electrochemical cell, this transducer is able to distinguish between different concentrations of phosphate-buffered saline in deionized water using electrochemical impedance spectroscopy. This transducer, when coupled with a biorecognition element, could serve as a new biosensor platform, to be employed as a diagnostic device that could be applied to various biological targets.
1. Introduction
Accurate diagnostic data are crucial to improving patient welfare. Further, the development of antimicrobial resistance (AMR) has been linked to inappropriate antimicrobial prescription practices, including the overreliance on broad-spectrum antibiotics in the absence of diagnostic information [,,]. Given the challenges that hinder the development of new classes of antibiotics [,,,,], and the rapidity with which AMR develops [,,], a crucial avenue is the development of biosensors that provide the diagnostic information required to ensure appropriate antimicrobial usage [,]. With this in mind, a novel transducer for use in electrochemical cells was developed by electrospinning a polymer blend onto IDEs to create a conductive nano- and microfiber mesh. The appeal of this substrate stems from its increased surface area as compared to thin-films, which increases the number of potential binding/reaction sites. This transducer was developed to serve as a backbone for further biosensor development. In this work, the transducer shows its potential for this purpose by acting as a sensor to determine concentration changes in a buffer solution. This was achieved by developing predictive models from the observed data.
2. Materials and Methods
A custom polymer blend was developed to produce the nano- and microfiber mesh substrate. Using blends by Bessaire et al. [] and Lloyd [] as a point of departure, this blend consisted of 0.015 g poly (vinyl alcohol) (PVA)(MW 89,000–98,000) (obtained from Merck), 0.065 g polyethylene oxide (PEO) (MW 1,000,000, obtained from Merck), 2.56 g poly (3,4-ethylenedioxythiophene) polystyrene sulfonate (PEDOT:PSS)(Clevios PH1000, obtained from Ossila) and 0.345 g N,N-Dimethylformamide (DMF) (obtained from Merck). The polymer blend was placed in a glass vial and mixed using a magnetic stirrer and hot-plate for 15 min, with the hot-plate heating the blend to approximately 95 °C. The blend was heated so as to increase the solubility of the PVA, thereby allowing for a shorter mixing duration. It was important to ensure that the temperature did not exceed 100 °C so as to avoid boiling, as this would change the properties of the polymer blend through the removal of water. After mixing, the polymer blend was allowed to cool.
Two electrode interdigitated electrodes (IDEs) with finger spacings of 130 μm were produced on an FR-4 substrate using ICAPE TRAX. The chosen electrode material was electroless nickel immersion gold (ENIG) owing to its chemical resistance. This is necessary as chemical reactions occurring at the electrode would affect the observed response. The electrodes were then placed in a spin-coater and covered with (3-Glycidyloxypropyl)trimethoxysilane (GOPS) at 1000 rpm for 40 s. The purpose of the GOPS is to bind the PEDOT:PSS nano- and microfibers to the IDE substrate. GOPS has been shown to significantly improve the water resilience of PEDOT:PSS []. After spin-coating, the electrodes were baked on a hot-plate at 100 °C for 30 min to allow for binding between the GOPS and the IDE substrate.
Once the polymer blend had cooled, it could be electrospun. An enclosure was prepared in which the relative humidity (RH) could be controlled using a heater. This is important as the RH affects the rate of solvent dissipation during the electrospinning process. The RH was set to 10–15% and the ambient temperature was 41.8 °C. The polymer was loaded into a syringe, which was placed into a syringe pump. A 22 G blunt-tipped needle was placed onto the syringe. The prepared electrodes were mounted to a custom octagonal-barrel rotating collector.
The purpose of the octagonal barrel was to provide flat faces to which the rigid electrodes could be mounted. The distance between the blunt needle-tip and a face of the barrel was set to 10 cm. The needle was connected to a high-voltage (HV) supply at 15 kV, and the syringe pump was set to depress the syringe at 2 mL/h. The barrel was set to rotate at 1200 rpm, which translates to a surface velocity of 12.566 m/s. This electrospinning operation was set to run for 30 min, after which the electrodes were removed from the collector. The electrodes, onto which nano-and microfibers were deposited during electrospinning, were then rinsed with ethanol and baked dry using a hot-plate at 100 °C for 1 min. The electrodes were then left to cure overnight. Once cured, 33 electrodes were selected, all with DC resistance measurements of under 2 Ω. The 33 electrodes accounted for 3 electrodes per concentration of PBS in DI water. The produced nano- and microfiber mesh can be seen in Figure 1.
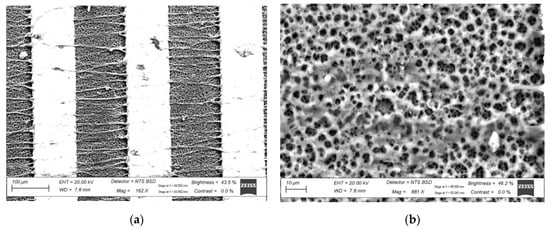
Figure 1.
The electrospun fibers. (a) Overview of the fibers between the fingers of an IDE; (b) close-up of the mesh.
In order to expose the electrodes to aqueous media, it was necessary to produce reservoirs that could contain the liquid. Custom wells were laser-cut from 5 mm thick plexiglass, and were then mounted directly to the nano- and microfiber transducers.
The next phase of the process involved exposure of the produced transducers to the series of PBS in DI water dilutions. A total of 50 μL of each concentration of PBS in DI water (ranging from 0% to 100%) was placed on the electrodes in triplicate. The electrodes were allowed to soak for 1 h, after which the impedance was measured over a broad frequency band using a Digilent Analog Discovery 2 and the accompanying Impedance Analyzer. Five sets of measurements were taken per electrode.
3. Results and Discussion
The frequency band of 100 Hz to 1 MHz was inspected. In order to account for variations in the base values of the electrodes, the data sets were normalized with respect to the impedance observed at 100 Hz. In order to account for noise in the system, a Savitzky–Golay (SavGol) filter was applied to the raw data with a window length of 31 and a polynomial order of 1. Taking the average of the 15 filtered data sets per concentration produced the graphs shown in Figure 2.
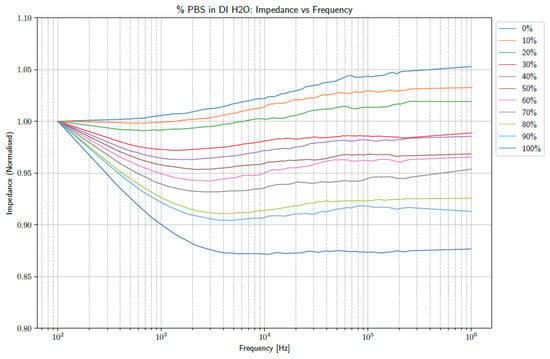
Figure 2.
The normalized averages of the impedances observed over the frequency band of 100 Hz to 1 MHz.
From the figure above, it is clear that increasing the concentrations of PBS affects the shape of the observed impedance over the selected frequency band. Further investigation into the effect at specific frequencies could provide insight into using the data as a diagnostic tool. Consequently, the data were inspected at 1 kHz and 10 kHz. Box plots of the normalized impedance as a function of PBS concentration are shown in Figure 3 and Figure 4 at frequencies of 1 kHz and 10 kHz, respectively.
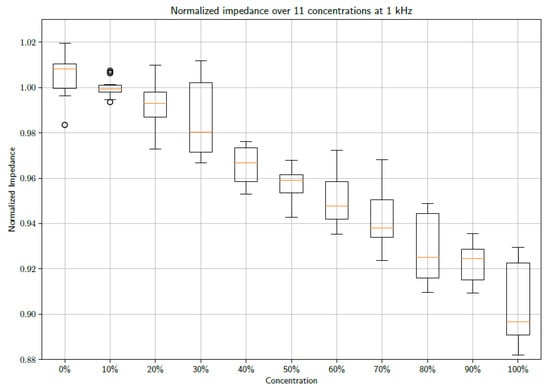
Figure 3.
A box plot showing the unfiltered data sets of 15 measurements at each concentration sampled at 1 kHz.
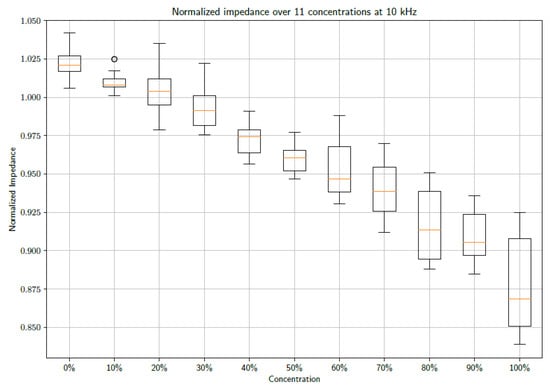
Figure 4.
A box plot showing the unfiltered data sets of 15 measurements at each concentration sampled at 10 kHz.
From the figures, a distinct linear trend in the data sets can be observed, whereby the impedance changes as the concentration of PBS in DI water increases. This makes sense as the introduction of PBS into the DI water necessarily denotes an increase in the number of conductive species present in the electrochemical cell. The maximum concentration of PBS in DI water is 100%. It must be noted that 1X PBS was used. Increasing the concentration of PBS is expected to produce further changes in impedance. However, this requires further study, as 1X PBS is a standard buffer solution and is therefore the focus of this study. When taking the median of the data points, so as to gain an indication of the trend of the data whilst accounting for outliers, it is possible to draw a line of best fit. These fits can be seen in Figure 5 and Figure 6 at frequencies of 1 kHz and 10 kHz, respectively.
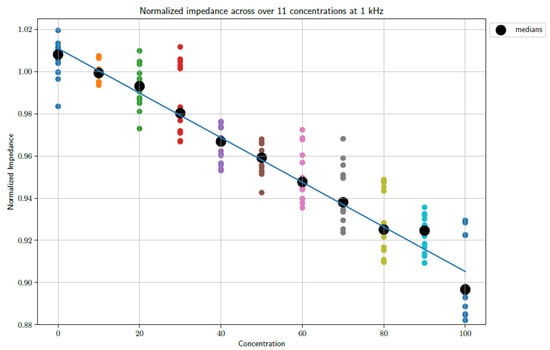
Figure 5.
A plot showing the unfiltered data sets as well as a trend line based on the medians of the data sets sampled at 1 kHz.
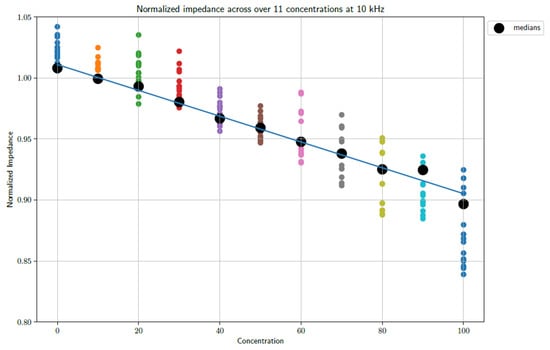
Figure 6.
A plot showing the unfiltered data sets as well as a trend line based on the medians of the data sets sampled at 10 kHz.
The fits follow a linear progression, i.e., the form y = ax + b. The parameters for the lines of best fit are as follows:
1 kHz
- a = −0.001058; b = 1.011.
- o
- Goodness of fit: R-squared: 0.9857; adjusted R-squared: 0.9841.
- o
- RMSE: 0.004454.
10 kHz
- a = −0.001434; b = 1.029.
- Goodness of fit:
- o
- R-squared: 0.9737; adjusted R-squared: 0.9708.
- o
- RMSE: 0.008239.
4. Conclusions
The data show a direct link between the concentration of PBS in DI water and the observed conductivity to the extent that linear regressions could be generated to act as predictive models for determining the concentration of unknown blends of PBS in DI water. This shows that the transducers produced can act as sensors, and can serve as the backbone of further sensor developments, specifically in the field of biosensors.
Author Contributions
Conceptualization, A.M.L. and W.J.P.; methodology, A.M.L.; formal analysis, A.M.L.; investigation, A.M.L.; resources, W.J.P.; data curation, A.M.L.; writing—original draft preparation, A.M.L.; writing—review and editing, A.M.L., W.J.P. and P.R.F.; supervision, W.J.P. and P.R.F.; project administration, W.J.P. All authors have read and agreed to the published version of the manuscript.
Funding
This research received no external funding.
Data Availability Statement
The data presented in this study are available on request from the corresponding author.
Acknowledgments
The authors would like to acknowledge the contributions of Wessel Croukamp, Wynand van Eeden and Marié Booyens.
Conflicts of Interest
Author Pieter R. Fourie was employed by the company Phagoflux (PTY) LTD. The remaining authors declare that the research was conducted in the absence of any commercial or financial relationships that could be construed as a potential conflict of interest.
References
- World Health Organization. Global Action Plan on Antimicrobial Resistance; World Health Organization: Geneva, Switzerland, 2015; pp. 1–19. [Google Scholar]
- Dittrich, S.; Tadesse, B.T.; Moussy, F.; Chua, A.; Zorzet, A.; Tängdén, T.; Dolinger, D.L.; Page, A.; Crump, J.A.; D’Acremont, V.; et al. Target product profile for a diagnostic assay to differentiate between bacterial and non-bacterial infections and reduce antimicrobial overuse in resource-limited settings: An expert consensus. PLoS ONE 2016, 11, e0161721. [Google Scholar] [CrossRef] [PubMed]
- Dittrich, S. Meeting of Experts on Biomarkers to Discriminate Bacterial from Other Infectious Causes of Acute Fever; World Health Organization: Geneva, Switzerland, 2015; pp. 5–23. [Google Scholar]
- National Research Council (US) Committee on New Directions in the Study of Antimicrobial Therapeutics: New Classes of Antimicrobials; National Research Council (US) Committee on New Directions in the Study of Antimicrobial Therapeutics: Immunomodulation. Treating Infectious Diseases in a Microbial World: Report of Two Workshops on Novel Antimicrobial Therapeutics; The National Academies Press (US): Washington, DC, USA, 2006; pp. 7–59. [Google Scholar]
- Gaynes, R. Antibiotic resistance in ICUs: A multifaceted problem requiring a multifaceted solution. Infect. Control Hosp. Epidemiol. 1995, 16, 328–330. [Google Scholar] [CrossRef] [PubMed]
- World Health Organization. Antibacterial Agents in Clinical Development; World Health Organization: Geneva, Switzerland, 2017; pp. 8–37. [Google Scholar]
- Spellberg, B.; Powers, J.H.; Brass, E.P.; Miller, L.J.; Edwards, J.E. Trends in antimicrobial drug development: Implications for the future. Clin. Infect. Dis. 2004, 38, 1279–1286. [Google Scholar] [CrossRef] [PubMed]
- Smolinski, M.S.; Hamburg, M.A.; Lederberg, J. Microbial Threats to Health: Emergence, Detection, and Response; The National Academies Press: Washington, DC, USA, 2003; pp. 13–18. [Google Scholar]
- Hamilton-Miller, J.M. Antibiotic resistance from two perspectives: Man and microbe. Int. J. Antimicrob. Agents 2004, 23, 209–212. [Google Scholar] [CrossRef] [PubMed]
- Bessaire, B.; Mathieu, M.; Salles, V.; Yeghoyan, T.; Celle, C.; Simonato, J.; Brioude, A. Synthesis of continuous conductive PEDOT:PSS nanofibers by electrospinning: A conformal coating for optoelectronics. ACS Appl. Mater. Interfaces 2016, 9, 950–957. [Google Scholar] [CrossRef] [PubMed]
- Lloyd, A.M. Quantification of CD4+ Cell Count via a Nanofibre-Based Biosensor. Master’s Thesis, Stellenbosch University, Stellenbosch, South Africa, 2019. [Google Scholar]
- Håkansson, A.; Han, S.; Wang, S.; Lu, J.; Braun, S.; Fahlman, M.; Berggren, M.; Crispin, X.; Fabiano, S. Effect of (3-Glycidyloxypropyl)Trimethoxysilane (GOPS) on the electrical properties of PEDOT:PSS films. J. Polym. Sci. 2017, 55, 814–820. [Google Scholar] [CrossRef]
Disclaimer/Publisher’s Note: The statements, opinions and data contained in all publications are solely those of the individual author(s) and contributor(s) and not of MDPI and/or the editor(s). MDPI and/or the editor(s) disclaim responsibility for any injury to people or property resulting from any ideas, methods, instructions or products referred to in the content. |
© 2023 by the authors. Licensee MDPI, Basel, Switzerland. This article is an open access article distributed under the terms and conditions of the Creative Commons Attribution (CC BY) license (https://creativecommons.org/licenses/by/4.0/).