Abstract
Product appearance is essential in shaping consumers’ preferences. Thus, we predicted consumer preference by establishing a feasible threshold for appearance innovation with a novel method. We used deep learning (DL)-based image classification and the Waikato Environment for Knowledge Analysis (WEKA) as the implementation tool. Advanced DL algorithms were adopted to classify images of disparate products according to their aesthetics. The results of the classification presented that the method could explain the level of innovation in appearance that consumers favored. The result can be used as a guideline for industrial designers in the creation of new products. Moreover, the method can be used to assess existing products that need enhancement to meet consumer preferences. The proposed method assists industrial designers in understanding consumer preferences and product innovation. Future research is required to ensure the successful design of new products.
1. Introduction
With advancements in Artificial Intelligence (AI), Data Mining, and the Internet of Things (IoT), various approaches and conceptualizations in healthcare and pharmaceuticals [1], artistic creation [2], and agriculture have been proposed. However, such applications in industrial design and product design have been scarce. When it comes to designing a product’s appearance, designers depend on their personal experience and individual aesthetic concepts, not on objective and quantified means. One major reason for this is the substantial time and effort required to collect and analyze data on market opportunities, competing products, and design strategies. Data associated with the appearance of products include images, which inherently challenges the quantified analysis. These challenges are barriers to designing product appearance strategically. Therefore, we used image classification and machine learning (ML) to find a way of innovative designs for predicting consumer preferences. The result helps designers find suitable designs for products and predict consumer preference for the designs.
2. Related Work
2.1. Typicality, Novelty, and Consumer Preference
Typicality refers to the appearance, shape, texture, and functional characteristics of product design. It signifies the wide recognition of people for a product or brand. For example, Apple Inc. has shown a unique round shape and polished appearance in product design, which has now become the trademark. Similarly, when one mentions “mammals”, people are reminded of cats, dogs, pigs, or sheep rather than platypuses or dolphins. This signifies a stronger sense of typicality.
The aesthetics of a product are an important indicator for consumers to discern products. Brands nowadays have been striving to exhibit their distinctive brand style in their products’ appearance. The design of vehicles is the most evident for typicality. Regardless of whether it is budget-friendly or luxurious, brand recognition with aesthetic design is the design goal of companies. The design of vehicles generally adheres to two design strategies: the single-driven and the market-driven approaches. The single-driven strategy is used for creating iconic product design elements and establishing a family look to attract target audiences. On the contrary, the market-driven strategy is used to develop diversified styles based on market demand to attract consumers. With the importance of aesthetic design, companies are emphasizing product appearance [3] and require innovations in design. Traditional and manual identification of styles is conducted by observing lines, curvatures, and other features that cannot match the speed of innovation and style shifts. For the innovation of product design, a balance between innovation, retaining brand style, and maintaining typicality is significant for designers and companies.
The concept of novelty corresponds to finely crafted design features. Consumers’ judgment of a product’s novelty is subjective. Hung and Chen [4] used 88 chairs in various shapes and applied them to the prototype production. They researched the semantic difference of bipolar adjectives to understand the impact on novelty and aesthetic preference. The results validated Berlyne’s hypothesis [5] that novelty and aesthetic preference showed an inverted U-shaped relationship. Moderate novelty can enhance aesthetic preference.
2.2. Integrity of Specifications
Style encapsulates the character of a designer or brand. The brand style is one of the most applied design strategies in the market, and it serves as a crucial component in brand recognition. Chan [6] stated that style was discerned by recurring features, forms, and context. Car manufacturers developed a symbolic brand appearance in the market by repetitively employing similar design elements [7]. Chan [6] proposed a measurement method based on classification. However, measuring product styles was a challenge. Hyun put forth a quantitative method to evaluate the similarity of the styles of vehicles [8] using Fourier decomposition of the data of eye-tracking on shapes. Through the analysis of visual semantics, the significance of the design elements of vehicles was weighted to find the similarity of vehicle designs. Features are more restrictive than styles, concentrating more on the characteristics or symbolic implications of logos. Chan [6] claimed that designs with higher stimulation in shapes were more easily distinguishable than other designs. The measurement of features for the identification of features was categorized into a manual setting definition [9] and coding feature definition [10].
2.3. Design Freedom and Brand Recognition
Design freedom is the threshold with which designers deviate from existing designs for innovative designs. It pertains to the permissible variation that does not stray from the brand value and recognition. Hung and Chen’s experiments affirmed that moderately innovative designs gained more popularity than excessively radical designs [4]. To investigate how to establish the range of design freedom, Burnap defined the distance across design and the difference between novel concept designs from existing ones. By incorporating customer feedback into the measurement function of design freedom, values of design freedom could be obtained for each design concept [11]. Brand recognition underscores the affiliation with the brand. Customer feedback is a key factor in purchasing decisions and affects the ranking of products [12]. In the automotive industry, the association between brand loyalty and consumer feedback is more prominent. A favorable market response can be secured if the design of the exterior of a vehicle is created within the appropriate range of design freedom. The front image of the vehicle is more significantly correlated with brand recognition than the side and rear views [13]. The front view unifies colors and the brand logo. Burnap confirmed that excessive design freedom would diminish brand recognition [11].
3. Methods
We used a deep learning (DL) method for image classification with machine learning (ML). The research was conducted in three phases: determining the reliability of ML in image classification, probing consumers’ subjective perceptions of product innovation, and finding the feasibility of deploying ML in predicting consumer preferences and analyzing product innovation.
3.1. Reliability of ML in Image Classification
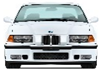
Liu [14] and Landwehr [9,15] researched the design innovation of vehicles using key features of product innovation using ML. In total, 28 frontal images of vehicles of four high-end brands (BMW, Mercedes Benz, LEXUS, and VOLVO) were collected in 2021 and 2022 for experiments. The sample images were collected from the online database of Consumer Reports issued by the American Consumer Union (CU), which is a non-profit and advertisement-free organization without any biased opinions. The database includes detailed information and images of consumer products as the source for collecting target images. The uniform image specification by Hyun [8] was employed to classify the front images of vehicles for the X-axis transformation, Y-axis transformation, and proportional transformation at different rates of 25, 75, and 100%. The morphed images were classified into training and testing sets as shown in Figure 1. The training group contained 24 deformed samples of models, while the test group consisted of four deformed samples of vehicle models.
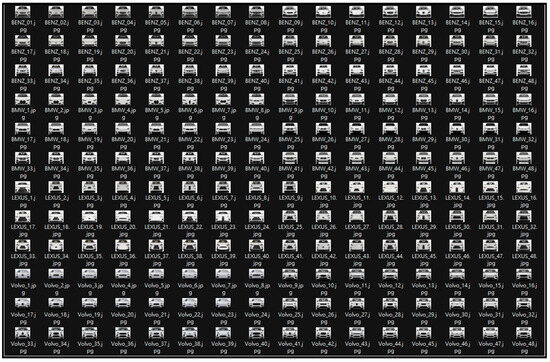
Figure 1.
Classified image samples.
The training set samples were converted into files in Attribute-Relation File Format (ARFF) and fed into the Waikato Environment for Knowledge Analysis (WEKA). The “JpegCoefficientFilter filter” in the WEKA was used to analyze the data of the sample images. On the WEKA’s “Classify page”, sequential minimal optimization (SMO) was used to categorize the data. As displayed in Figure 2, the outcomes using WEKA for the training set showed an accuracy of 100%. The samples in the testing set were converted into ARFF files and fed into the model. As shown in Figure 3, an accuracy of 100% was obtained in classification. It was found that ML classified the images accurately.
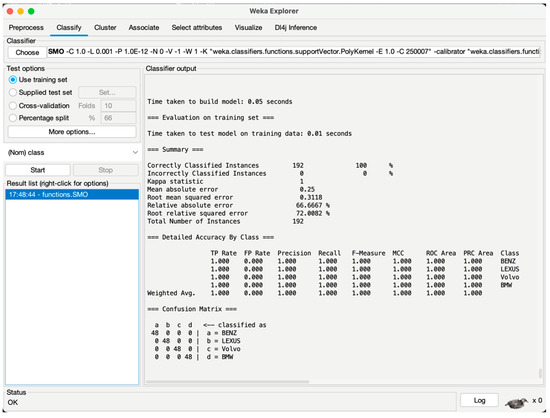
Figure 2.
Training model established using WEKA.
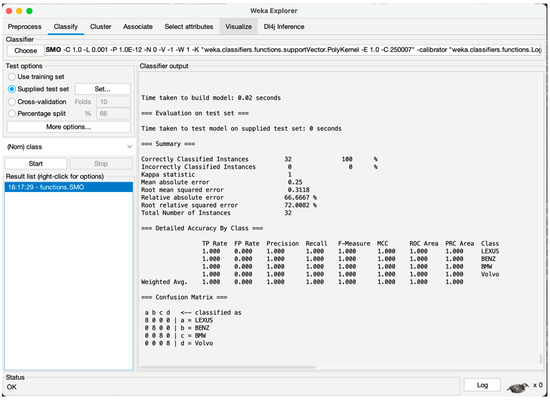
Figure 3.
Classifying using WEKA training model.
3.2. Consumer Perceptions of Product Innovation
The relationship between consumer perceptions of innovation and consumer preference for a particular brand or product was found in this study. The samples were collected from the images of BMW M3 series vehicles as the experimental sample to evaluate “Typical-Novel” and “Dislike-Favored”. To evaluate consumer perception of the vehicles, a questionnaire survey was conducted using the Semantic Differential Scale [16]. In the survey, the images of the BMW M3 model in the sixth generation were shown regarding research typicality and consumer preference. A total of 200 valid questionnaires were collected from 147 males and 53 females. In the data analysis, we obtained scores for consumer perception of the vehicle as depicted in Table 1. E36 scored the lowest (2.295). The key characteristics of the remaining five M3 models (E30, E46, E92, F80, and G80) were also scored in terms of innovation in the design of the front images. As shown in Figure 4, the order of consumer preference was E46, E30, E92, and F80. A substantial decline was found for G80 as it showed a significant decrease in favorability and innovation compared to the scores of other models: 10% (E46), 20% (E30), 40% (E92), and 50% (F80). To maintain the appropriate level of consumer preference, the innovation of the front images compared to the most typical M3 model E36 was required.

Table 1.
Questionnaire survey results.

Figure 4.
Scatter plot of typicality and consumer preference.
3.3. ML for Predicting Consumer Preferences and Analyzing Product Innovation
To investigate the capability of ML in predicting consumer preferences and identifying a suitable range of product innovation, a series of image samples was created based on the M3 and E36 models as they were regarded as typical models according to consumer perception. These samples were shown in three dimensions at different transformations of the images ranging from 10 to 100% and −10 to −100%. According to the rule of “the degree of innovation between 10 and 50%”, they were inputted into WEKA for the ML analysis to explore the relationship between innovation and consumer preference as displayed in Table 2.
Table 2.
Sample images for design innovation.
Furthermore, the front grilles of the remaining five M3 models were transplanted onto the iconic M3 model, E36, to serve as a test to evaluate the accuracy of WEKA’s prediction model in forecasting consumer preferences.
Subsequently, the grouped transformed image samples were utilized in WEKA to establish a prediction model capable of classifying the innovation level of BMW M3 models based on consumer preferences. These image samples yielded a prediction model with a classification accuracy of 84.127% after ten layers of Cross-validation, as depicted in Figure 5.
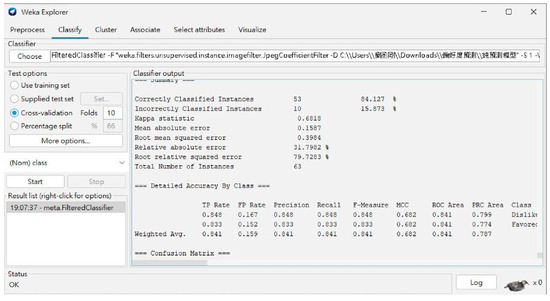
Figure 5.
Prediction model of consumer preference for BMW M3 using WEKA.
Image samples of the front images of the M3 and E36 models were used in the unknow innovation level for testing the WEKA prediction model. The model analyzed these image samples and made predictions as illustrated in Figure 6. The model’s prediction results were compared with the actual images as shown in Table 3. The accuracy of prediction was high. The result showed that ML was effective in predicting consumer preferences and determining the threshold of product design innovation.
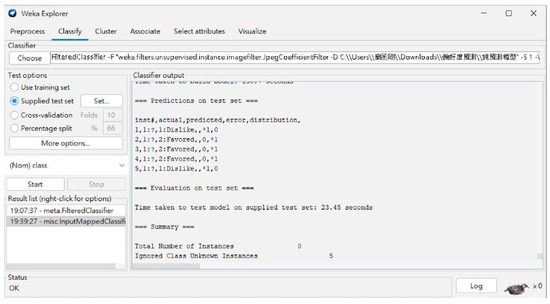
Figure 6.
Prediction of consumer preference for unknow sample images using the model.
Table 3.
Prediction results of WEKA prediction model.
4. Conclusions
Using the images of the renowned M3 model of BMW, we investigated the performance of the WEKA prediction model with ML in predicting consumer perceptions and the threshold of design innovation. The result showed that the model was effective in predicting consumer perception and can be applied to other consumer-related parameters.
Author Contributions
Conceptualization, H.-H.W.; method, H.-H.W.; resources, C.-K.L. and S.-B.Y.; data curation, C.-K.L. and S.-B.Y.; validation, H.-H.W.; writing—original draft preparation, C.-K.L. and S.-B.Y.; writing—review and editing, H.-H.W.; experiments conducted, C.-K.L. and S.-B.Y.; supervision, H.-H.W. All authors have read and agreed to the published version of the manuscript.
Funding
This research was funded by NSTC, Taiwan, R.O.C., through grant 111-2410-H-027-019-MY2.
Institutional Review Board Statement
Not applicable.
Informed Consent Statement
Not applicable.
Data Availability Statement
Data are unavailable due to privacy reasons.
Acknowledgments
The authors gratefully acknowledge the financial support of NSTC, Taiwan, R.O.C., through grant 111-2410-H-027-019-MY2.
Conflicts of Interest
The authors declare no conflict of interest.
References
- Shen, D.; Wu, G.; Suk, H.-I. Deep Learning in Medical Image Analysis. Annu. Rev. Biomed. Eng. 2017, 19, 221–248. [Google Scholar] [CrossRef] [PubMed]
- Yi, R.; Liu, Y.-J.; Lai, Y.-K.; Rosin, P.L. APDrawingGAN: Generating Artistic Portrait Drawings from Face Photos with Hierarchical GANs. In Proceedings of the IEEE/CVF Conference on Computer Vision and Pattern Recognition (CVPR), Long Beach, CA, USA, 15–20 June 2019. [Google Scholar]
- Orth, U.R.; Malkewitz, K. Holistic Package Design and Consumer Brand Impressions. J. Mark. 2008, 72, 64–81. [Google Scholar] [CrossRef]
- Hung, W.; Chen, L. Effects of Novelty and Its Dimensions on Aesthetic Preference in Product Design. Int. J. Des. 2012, 6, 81–90. [Google Scholar]
- Berlyne, D.E. Novelty, complexity, and hedonic value. Percept. Psychophys. 1970, 8, 279–286. [Google Scholar] [CrossRef]
- Chan, C.-S. Can style be measured? Des. Stud. 2000, 21, 277–291. [Google Scholar] [CrossRef]
- Karjalainen, T.-M. Semantic Transformation in Design: Communicating Strategic Brand Identity Through Product Design References; University of Art and Design Helsinki: Helsinki, Finland, 2004. [Google Scholar]
- Hyun, K.H.; Lee, J.-H.; Kim, M.; Cho, S. Style synthesis and analysis of car designs for style quantification based on product appearance similarities. Adv. Eng. Inform. 2015, 29, 483–494. [Google Scholar] [CrossRef]
- Mayer, S.; Landwehr, J.R. Objective measures of design typicality. Des. Stud. 2018, 54, 146–161. [Google Scholar] [CrossRef]
- Monga, V.; Evans, B.L. Perceptual Image Hashing Via Feature Points: Performance Evaluation and Tradeoffs. IEEE Trans. Image Process. 2006, 15, 3452–3465. [Google Scholar] [CrossRef] [PubMed]
- Burnap, A.; Hartley, J.; Pan, Y.; Gonzalez, R.; Papalambros, P.Y. Balancing Design Freedom and Brand Recognition in the Evolution of Automotive Brand Styling. In Proceedings of the 27th International Conference on Design Theory and Method, Boston, MA, USA, 2–5 August 2015; Volume 7. [Google Scholar]
- General Motors. General Motors Brand Equity Research; Internal. General Motors: Warren, MI, USA, 2014. [Google Scholar]
- Ranscombe, C.; Hicks, B.; Mullineux, G.; Singh, B. Visually decomposing vehicle images: Exploring the influence of different aesthetic features on consumer perception of brand. Des. Stud. 2012, 33, 319–341. [Google Scholar] [CrossRef]
- Liu, Y.; Li, K.J.; Chen, H.; Balachander, S. The Effects of Products’ Aesthetic Design on Demand and Marketing-Mix Effectiveness: The Role of Segment Prototypicality and Brand Consistency. J. Mark. 2017, 81, 83–102. [Google Scholar] [CrossRef]
- Landwehr, J.R.; Labroo, A.A.; Herrmann, A. Gut Liking for the Ordinary: Incorporating Design Fluency Improves Automobile Sales Forecasts. Mark. Sci. 2011, 30, 416–429. [Google Scholar] [CrossRef]
- Osgood, C.E.; Suci, G.J.; Tannenbaum, P.H. The Measurement of Meaning; University of Illinois Press: Urbana, IL, USA, 1957. [Google Scholar]


Disclaimer/Publisher’s Note: The statements, opinions and data contained in all publications are solely those of the individual author(s) and contributor(s) and not of MDPI and/or the editor(s). MDPI and/or the editor(s) disclaim responsibility for any injury to people or property resulting from any ideas, methods, instructions or products referred to in the content. |
© 2023 by the authors. Licensee MDPI, Basel, Switzerland. This article is an open access article distributed under the terms and conditions of the Creative Commons Attribution (CC BY) license (https://creativecommons.org/licenses/by/4.0/).