Abstract
The noisy environment of hospitals has always been a problem for medical workers and patients as people in hospitals need a quiet environment more than others. Thus, the study of the noisy environment of hospital buildings has been carried out for a long time. This study aims to find out the existing problems and explore solutions for improvement through research. The purpose is to investigate and analyze the lower frequency range of current noise (25–200 Hz) in four central hospitals (single building or group of buildings using a single lobby), following the research of “Characterizing the subjective noise in hospital lobbies”. In this research, the acoustic environment condition in the lobby after the road noise spread into the hospital and its environmental noise problems were analyzed by the commercial acoustic simulation software SoundPLAN for scene restoration and simulation. Focusing on reconstructing the noisy condition of the hospital lobby and comparing the measurements with those of our previous study, acoustic experimental simulations are conducted to acquire the indoor frequency spectrum. The experimental data are also compared with the live measurement data to verify the reliability of SoundPlAN. Finally, the experimental result is analyzed with the psychological experimental noisiness values in our previous study to identify the sources of the main noise existing in the lobbies of the four hospitals.
1. Introduction
Many researchers have raised the noise problems of the hospital, indicated improvement directions, and proposed related solutions. Nevertheless, in a noisy environment, one phenomenon is generally ignored: low-frequency noise. When people are forced to adapt to this noise, they would insensibly become irritable, and even irrational [1]. Prolonged exposure to low-frequency noise is likely to result in neurological weakness, insomnia, headaches, and other neurological dysfunctions, and even affect the fetus in the womb. Compared with low-frequency noise, high-frequency noise decreases rapidly as the distance increases or when encountering obstacles. As low-frequency noise decreases slowly and its sound waves are longer, they can easily pass through obstacles, run over long distances, and penetrate walls and ears. Low-frequency noise, in general, has a common nature. Their waves are formed by vibration being a form of energy transmission. A hospital requires a favorable rehabilitation environment and a working environment. Topf [2] Noise in hospitals is not conducive to patients’ recovery, and they need an environment that is quieter than the environment. They are usually experienced in daily life. Noise in hospitals also distracts hospital staff and increases the risk of medical incidents. Torija [3,4] suggested that low-frequency noise (or other acoustic features that are usually less important) is less dominant in the subjective response to other acoustic features (e.g., mid- and high-frequency noise) in noise annoyance, and is a more critical factor under indoor conditions. Low-frequency noise may be more dominant than the other frequency bands under indoor conditions Tomei [5] Increased noise will damage the human auditory system and may also induce hypertension or other irreversible cardiovascular diseases. Using the SoundPLAN acoustic simulation software, the propagation paths of low-frequency noise and the coverage of low-frequency noise are investigated in the acoustic environment of the four hospital halls. Then, the measured data in the field are compared to verify their reliability and to improve the strategies and recommendations.
2. Purpose and Objects of Research
2.1. Purpose of Research
The following are the objectives of this study.
- To study the types of low-frequency noise in hospitals;
- To investigate the impact of low-frequency noise on people’s lives and their psychological perception of it;
- To continue the investigation of the current situation of noise in the lobby of a general hospital in central Taiwan;
- To implement noise measurements in four hospitals in central Taiwan;
- To use the acoustic simulation software SoundPLAN to restore the acoustic environment scene during the measurement by Chen [6,7] for analysis and research.
2.2. Objectives of Research
In this study, low-frequency noise was measured and simulated at four hospitals (Table 1) in Taichung City in order to design and improve the physical environment.

Table 1.
Hospitals and the area of their lobbies.
3. Experimental Sites
Torija [3] suggested that low-frequency noise (or other usually less important acoustic features) may be more important than other acoustic features (such as MF and HF content) that are less dominant such as indoor conditions. Low-frequency noise is relatively more dominant indoors and behind noise barriers and relatively more significant, as it may lead to irritation, excessive fatigue, inattention, sleep disorders, and troubles. Through animal experiments, Spreng [8] found that the cellular cortisol of the tested animals would be affected by noise and cause changes, and it would cause small changes in the heart and adrenal glands.
Paunović [9] explored traffic noise-induced changes in blood pressure, heart and hemodynamics in young adults. Their study included a total of 130 people (42 men, 88 women) with an average age of 24 years old. The results of the study pointed out that 89 decibels of traffic noise will produce blood changes, including increased blood vessel resistance and reduced cardiac blood elimination. These changes occur when noise is exposed The interplay of effects results in an increase in systolic and diastolic blood pressure.
3.1. Floor Plan Acquisition
Four central hospitals near the road were selected to study the low-frequency noise. The criteria for measuring and setting the measuring points are selected following Chen’s research [6].
The measurement was conducted on normal working days from 9:00 a.m. to 5:00 p.m. and from Monday to Friday. The reason was to avoid the special impact noise when the hospital opens in the morning such as the noise of opening the iron gate, air conditioning, mechanical equipment trial operation, and so on. Noise at night occurs from 9 p.m. to 5 a.m. The measuring points need to meet the following conditions.
- The height between the measuring point and the ground must be 1.2–1.6 m;
- The distance between the measuring point and each radiation surface in space must be greater than 1.0 m;
- The distance between each measuring point must be greater than 1.5 m;
- The distance between the measuring point and the noise source in space must be greater than 1.5 m.
The floor plan is shown in Figure 1.
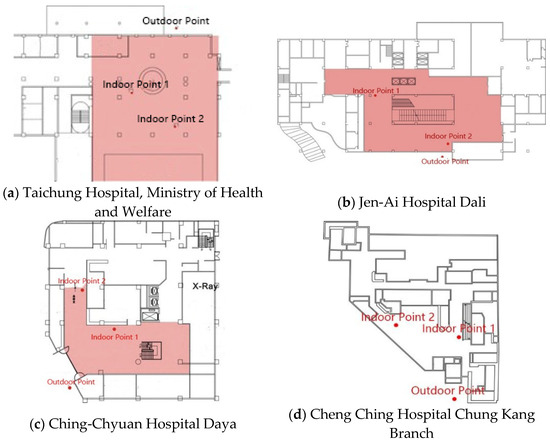
Figure 1.
Floor plane of hospital lobbies for the research [6].
3.2. Data Acquisition
Chen [6] performed a psychological quantitative survey on the audience of hospital users using the Likert Scale. It is a psychological reaction scale and is often used for questionnaire surveys. The Likert scale has two extreme quantitative methods to measure positive or negative responses. The subject scored the noise in the hospital hall at five levels of very agree, agree, ordinary, disagree, and very disagree (Table 2).

Table 2.
Summary of noise incident questionnaire data.
After collecting all data, the psychological noise parameters of the subjects in four hospitals were obtained as shown in Table 3.

Table 3.
Psychological noise parameter table.
The collated parameters were used in the later stage of the experiment with the simulated indoor spectrum.
4. Methods
A SoundPlAN model was used for data acquisition, measurement, and simulation.
4.1. Model
Based on the floor plans of four hospitals obtained by Chen [6], AutoCAD was used to restore the plans on an equal scale. The floor plans were imported into SoundPlAN to establish a model as shown in Figure 2.
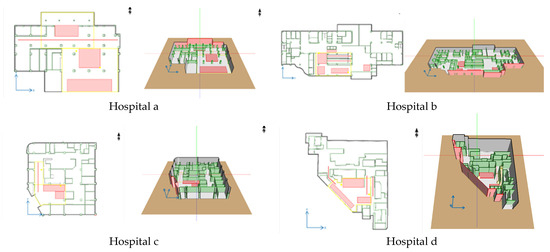
Figure 2.
Four hospital plans and 3D models in SoundPLAN.
4.2. Sound Absorption and Penetration
According to the field investigation and collection of data on the penetration coefficient (ISO 12354) [10], a sound absorption coefficient (ISO 354) [11] of 20 cm reinforced concrete walls was obtained as shown in Table 4.

Table 4.
The 20 cm RC wall penetration and absorption coefficient spectrum.
5. Process and Results
Due to the shortage of outdoor noise measurement data in Chen [6], the field measurement was obtained as the spectrum of outdoor noise sources. The measurement principle followed by this outdoor noise spectrum collection is as follows.
The measurement was carried out during the normal working day from Monday to Friday every 30 min. The reason was to avoid the special noise that occurred when the hospital opened in the morning such as opening the iron gate, air conditioning, mechanical equipment trial operation, and other noises. In case of sudden noise (except the noise brought by the hospital such as the siren of an ambulance), the measurement was terminated. The measurement time was 15 min and was repeated to ensure accuracy. The measuring points meet the previous conditions.
Precision Sound 140 Sound Analyzer was used in this research. The obtained measurement data are shown in Table 5.

Table 5.
The 25–4 kHz frequency spectrum of outdoor noise in four hospitals.
After the establishment of the model, the input of various values and the setting of the analytical program, the indoor acoustic environment spectrum of the four hospitals is finally obtained as shown in Table 6. The indoor sound pressure distribution diagram is shown in Figure 3.

Table 6.
Indoor noise spectrum of four hospitals after simulation.
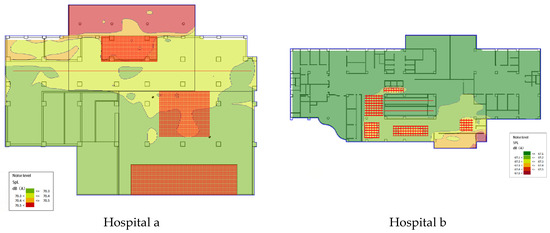
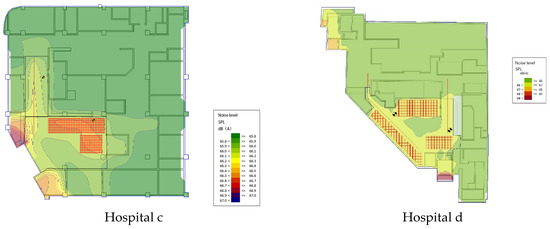
Figure 3.
Sound pressure distribution in the four hospitals.
The sound pressure distribution diagram shows the acoustic environment of the hospital lobby. The red areas included the medication collection area, the entrance lobby, and the rest and waiting area which were crowded. The second red area is for the sound sources in the corridors and escalators are linear sources. The sound level was the most prominent in the Daya Ching Chuen Hospital, presumably due to its proximity to the road.
The correlation analysis result of the indoor spectrum in SoundPlaN and the psychological noise value is shown in Table 7.

Table 7.
Correlation analysis result.
The experimental results show that the frequency band of noise was mainly concentrated in 25–315 Hz and 1600–2500 Hz and present the direction of looking for noise source mainly in low frequency (Figure 4). It is shown that the main source of low-frequency noise is in the halls of the four tested hospitals.
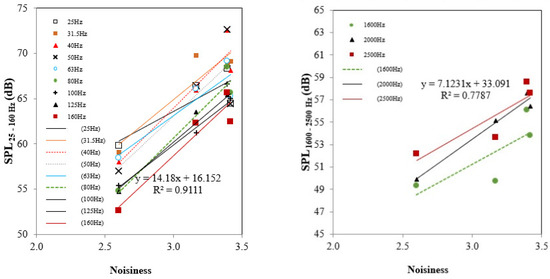
Figure 4.
Correlation between subjective noisiness and sound pressure levels of simulated noise at the range 25–160 Hz and 1600–2500 Hz.
6. Conclusions
In this study, the acoustic environment of the lobby of the four hospitals was investigated and compared to those of Chen [6], and the correlation between the measured data and the psychological experimental data was compared.
According to the experimental results, the noise affecting the four hospitals is mainly low-frequency noise. The psychological experiment data shows that the highest correlation frequency bands are 25–315 Hz and 1600–2500 Hz. Therefore, the noise frequency band with the highest perception by people in the lobby contains the middle and low followed by the high-frequency band. The acoustic simulation software (SoundPLAN) was used to restore the measurement by placing noise sources, installing noise barriers, and placing measurement points and surfaces. The experiment results present that the four hospitals had a wider distribution of indoor sound levels, and the most significant noise level was found at Daya Ching Chuen Hospital, presumably because it is closer to the road than the other three hospitals.
Author Contributions
Conceptualization, C.Y.C. and X.L.; methodology, C.Y.C.; software, X.L.; validation, C.Y.C. and X.L.; formal analysis, X.L.; investigation, X.L.; resources, C.Y.C.; data curation, X.L.; writing—original draft preparation, X.L.; writing—review and editing, X.L.; visualization, X.L.; supervision, C.Y.C.; project administration, C.Y.C.; funding acquisition, X.L. All authors have read and agreed to the published version of the manuscript.
Funding
This research received no external funding.
Institutional Review Board Statement
Not applicable.
Informed Consent Statement
Not applicable.
Data Availability Statement
Due to restrictions such as privacy or ethics, upon request provide data.
Conflicts of Interest
The authors declare no conflict of interest.
References
- Kknews. Chronic Damage to Human Caused by Low-Frequency Noise Can not be Ignored. 2018. Available online: https://kknews.cc/zh-tw/health/9vzkgpl.html (accessed on 30 November 2023).
- Topf, M. Noise induced occupational stress and health in critical care nurses. Hosp. Top 1988, 66, 30–34. [Google Scholar] [CrossRef] [PubMed]
- Torija, A.J.; Flindell, I.H. Differences in subjective loudness and annoyance depending on the road traffic noise spectrum. J. Acoust. Soc. Am. 2014, 135, 1–4. [Google Scholar] [CrossRef] [PubMed]
- Torija, A.J.; Flindell, I.H. The subjective effect of low frequency content in road traffic noise. J. Acoust. Soc. Am. 2015, 137, 189–198. [Google Scholar] [CrossRef] [PubMed]
- Tomei, F.; Fantini, S.; Tomao, E.; Baccolo, T.P.; Rosati, M.V. Hypertension and chronic exposure to noise. Arch. Environ. Health 2014, 55, 319–325. [Google Scholar] [CrossRef] [PubMed]
- Chen, C.Y. Characterizing Subjective Noisiness in Hospital Lobbies. Arch. Acoust. 2015, 40, 235–246. [Google Scholar] [CrossRef][Green Version]
- Chen, C.Y. Monitoring time-varying noise levels and perceived noisiness in hospital lobbies. Build. Acoust. 2021, 28, 35–55. [Google Scholar] [CrossRef]
- Spreng, M. Possible health effects of noise induced cortisol increase. Noise Health 2000, 2, 59. [Google Scholar] [PubMed]
- Paunović, K.; Stojanov, V.; Jakovljević, B.; Belojević, G. Thoracic bioelectrical impedance assessment of the hemodynamic reactions to recorded road-traffic noise in young adults. Environ. Res. 2014, 129, 52–58. [Google Scholar] [CrossRef] [PubMed]
- ISO12354-1. 2017. Available online: https://www.iso.org/standard/70242.html (accessed on 30 November 2023).
- ISO354. 2003. Available online: https://www.iso.org/standard/34545.html (accessed on 30 November 2023).
Disclaimer/Publisher’s Note: The statements, opinions and data contained in all publications are solely those of the individual author(s) and contributor(s) and not of MDPI and/or the editor(s). MDPI and/or the editor(s) disclaim responsibility for any injury to people or property resulting from any ideas, methods, instructions or products referred to in the content. |
© 2023 by the authors. Licensee MDPI, Basel, Switzerland. This article is an open access article distributed under the terms and conditions of the Creative Commons Attribution (CC BY) license (https://creativecommons.org/licenses/by/4.0/).