1. Introduction
New opportunities have arisen from technological progresses made in uncooled infrared focal plane array sensors over the past few years, enabling remote and low-cost radiative flux measurements. In particular, such solutions bring new applications in civil engineering infrastructure monitoring and remote absolute temperature measurements. However, one challenge of outdoor structure monitoring is that it is inherently subject to environmental parameters and their variations. In fact, the underlying temperature estimation depends on many criterion such as camera calibration [
1], geometrical considerations, but also environmental conditions. Therefore, to achieve quantitative thermography, one must consider the global radiative heat balance at the sensor level and be able to estimate the different parameters of the equation. Then, the measurement correction to estimate the temperature in an outdoor context can be made and the parameters estimated by using on-site measurements, with a multi-sensors instrumentation. However, such a solution increases the instrumentation complexity and cost, the number of data to gather and store and, sometimes, it cannot be applicable at all on the experiment facility. Moreover, even with a multi-sensor instrumentation, data may be lacking due to various possible issues.
As a consequence, we propose to use data from other means to estimate those environmental parameters. In this study, we compare the gathering of data from different observations scales: a local weather station, existing sensor networks with Meteorological Aerodrome Report (METAR) data and open source online satellite data from the European Copernicus program. First, to understand the needs of gathering environmental data, we present the principles of infrared thermography in an outdoor and quantitative context. Then, we compare the data acquired from the different means and also the resulting temperature estimation from infrared images with thermocouples on site. Finally, conclusions and perspectives are discussed.
2. Temperature Estimation from a Global Radiative Heat Balance at Sensor Level
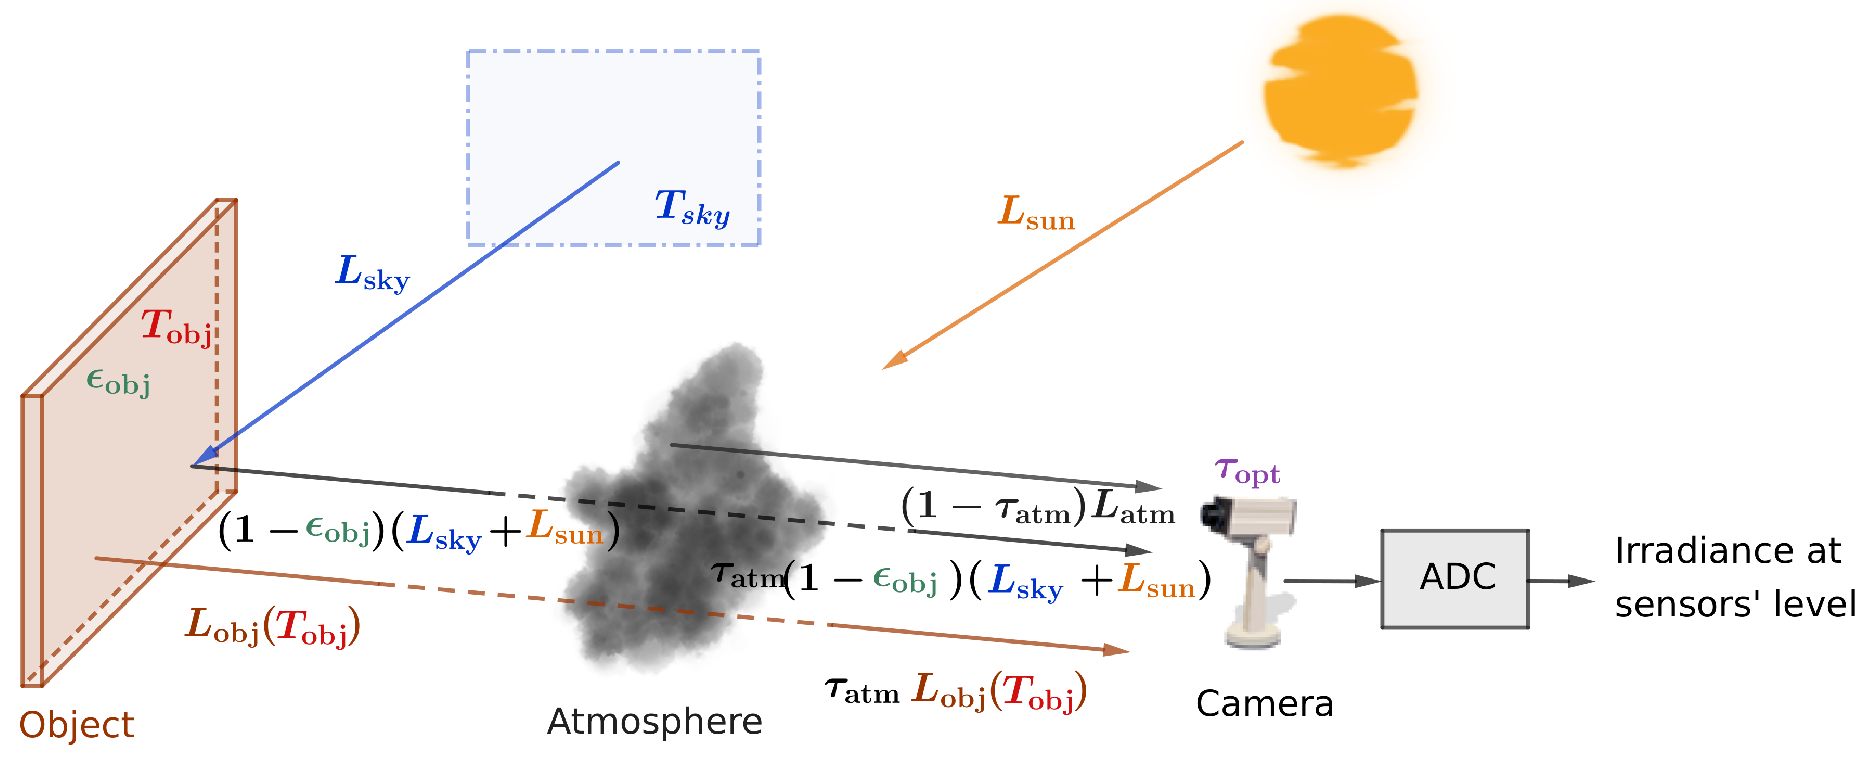
As mentioned earlier, in order to estimate the temperature from the irradiance measured by an infrared camera, it is necessary to consider the global radiative heat balance at the sensor level, represented in
Figure 1. Such balance relies on the estimation of different environmental parameters such as, for instance, the environment temperature, the sun, atmosphere contribution and involved transmissions. Of course, the emissivity of the object also needs to be known or estimated, for which particular temperature and emissivity separation methods can be used [
2]. For comprehension and writing simplification, we derive a simplified heat balance with such quantities for a given pixel and given wavelength as
where
is the atmospheric transmission,
, the real body radiation of the object at unknown temperature (
) with an emissivity
.
,
and
the other different radiatives contributions, from the sky, the sun and the atmosphere, respectively. Please note that we could also further consider the transmission and contribution from the optics of the camera, but those quantities are not of interest in the present study because we only focus on environmental quantities between the camera and target of interest.
Based on
Figure 1,
can be derived. Then, the standard RBF-function is used to obtain the temperature value, after a thermal calibration [
1,
3]. A sensitivity analysis can show that the effect of those parameters on the estimation of the temperature may not be neglected [
4] and, therefore, the parameters should be estimated, even roughly.
3. Environmental Parameters Estimation
To estimate the environmental parameters, we propose and compare three methods: local measurements, existing sensor networks with Meteorological Aerodrome Report (METAR) data and open source online satellite data from the European Copernicus program. Since some data may not be available from all the different sources, we also propose literature correlations or methods to be used to deduct those quantities.
3.1. Local Measurements
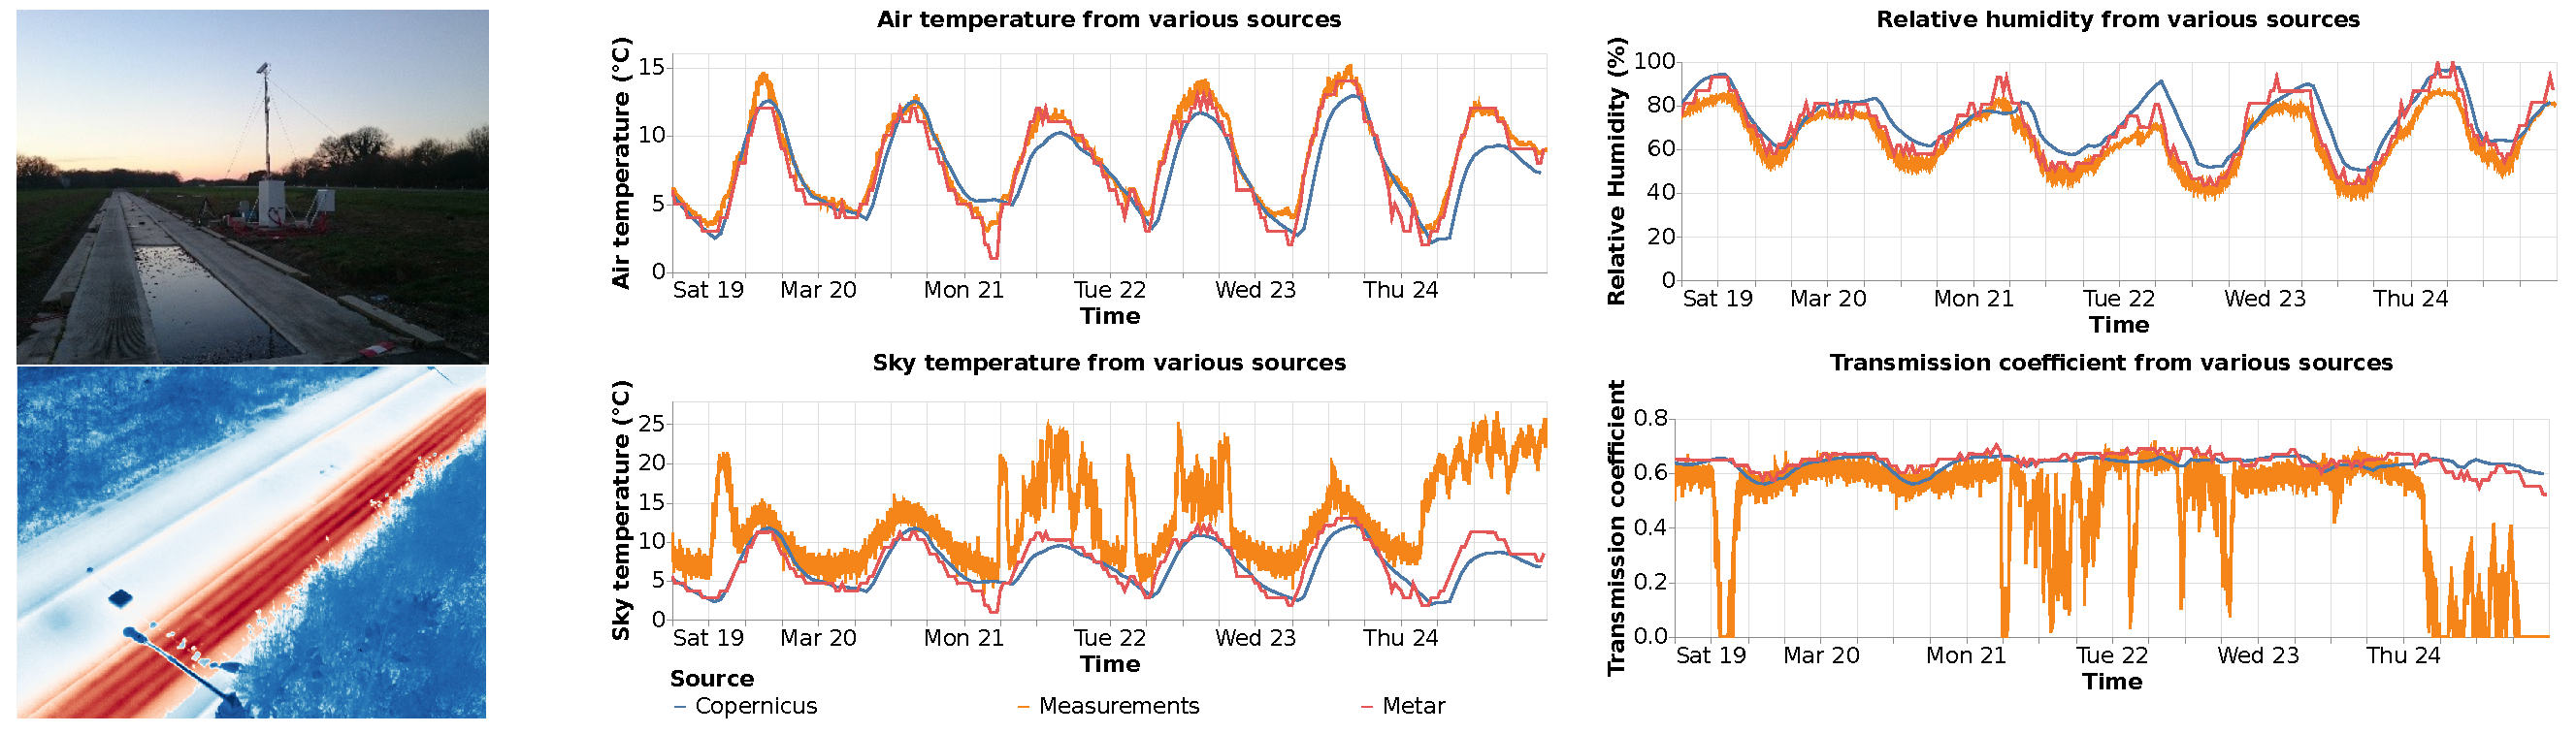
An instrumented road at our laboratory in Nantes, France with a local weather station, a pyranometer and pyrgeometer and an infrared camera is used. The road section has thermocouples on the ground from which the infrared temperature estimations with the different corrections can be compared.
3.2. Meteorological Aerodrome Report (METAR)
METAR is a normalized format to create weather reports, based on permanent weather observation stations or airports, that are generated periodically (usually once an hour). The methodology we propose is to download data from the nearest available METAR station.
3.3. Copernicus Climate Data Store (CDS)
The Climate Data Store (CDS) is part of the European program Copernicus aiming at collecting and providing edge-cutting and updated continuous data on Earth’s state. The CDS provides a single point access to many European datasets including observations, reanalysis and forecasts. For post-processing temperature computation, we propose to use the reanalysis dataset and particularly ERA5-land dataset [
5].
4. Results
The results have been computed over 1 month (March 2016) for which we acquired full infrared and sensors data each minute on an instrumented road shown in
Figure 2. Due to the involved infrared band (8–12
m), only the long-wave infrared contributions are considered. As a consequence, the sun contribution is neglected here in a first approach.
4.1. Available Parameters and Derivations
For online data, the air temperature is usually straightforward to obtain since it is directly provided in the data sources. However, the sky temperature can be approximated from the air temperature by using literature correlations or models [
6]. In this study, the sky temperature is deducted from the correlation proposed by P. Berdahl and R. Fromberg [
7]. Previous results showed that the sky irradiance and sun contribution could also be simulated by using simulation models [
8]. For on-site data, the sky temperature is obtained from a pyrgeometer while the air temperature is measured with a probe on the weather station. The relative humidity is given by METAR data and measured on-site with the weather station. For Copernicus though, it needs to be derived from the air temperature, the surface pressure and the dew point by using the August–Roche–Magnus formula [
9]. The atmosphere transmission coefficient is also computed from a correlation, by using the sky temperature and the relative humidity.
4.2. Comparison of the Parameters Based on Their Source
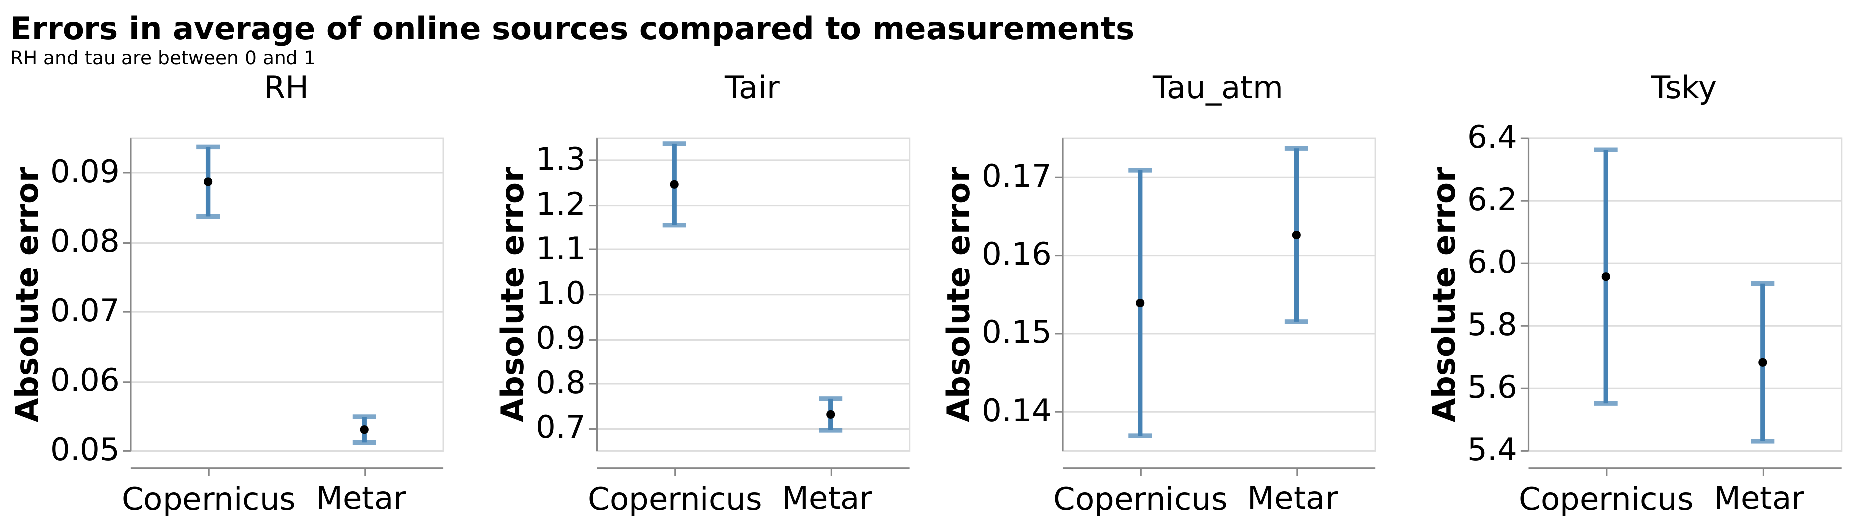
Figure 2 and
Figure 3 show that the air temperature and relative humidity obtained with METAR data are quite accurate. This observation may not be repeatable due to the fact that the experimentation site is at a few kilometers of the actual station. However, METAR data have a poor sampling rate compared to the measurements. At the opposite end, Copernicus CDS provides fair results regarding the fact that those results are more reproducible and the data are easier to access and to process.
Conversely, the sky temperature has more uncertainties, mainly due to the clear sky correlation used in this study. A better model or a simulation that takes into account a measure of the cloudiness would improve the result, and therefore the transmission one.
4.3. Comparison of Temperature Estimation with On-Site Thermocouples
Finally, a comparison of the estimated temperature with the infrared camera and a thermocouple at ground has been performed and results are shown in
Figure 4. Even if the thermocouple measurement cannot be considered as a ground truth, it is still a fair temperature reference. In this figure, it can be seen that on this period of interest, any consideration of environmental parameters from any provider will make the estimation closer to the thermocouple measure. In particular, on-site measurements provide, on average, the closest temperature estimation to the thermocouple. Please note that more investigations need to be made for particular weather conditions such as snow and rain for instance, which were not observed during this period.
5. Conclusions
A comparison of computing environmental parameters from different data providers with local measurements from a test site have been conducted. It has been shown it is possible to use online meteorological data providers to obtain an estimation of the lacking parameters. Furthermore, the estimated temperature by infrared thermography by using the environmental parameters from those different providers has been compared to local thermocouples measurements. The results indicate that considering and correcting the infrared measurements with environmental quantities helps in arriving closer to thermocouples values. However, in our dataset, it appeared that some local phenomenon, measured on site (clouds for instance), are quite difficult to retrieve in online data. Also, the geometry of the scene that would reflect on the object was not considered. As a consequence, future works should involve the calibration and the fusion of a numerical model of the facility with online data to further improve the temperature estimation and consider specific weather conditions.
Author Contributions
Conceptualization, T.T. and J.D.; methodology, T.T. and J.D.; software, T.T.; validation, T.T. and J.D.; formal analysis, T.T. and J.D.; investigation, T.T. and J.D.; resources, T.T. and J.D.; data curation, T.T.; writing—original draft preparation, T.T. and J.D.; writing—review and editing, T.T. and J.D.; visualization, T.T. and J.D.; supervision, J.D.; project administration, J.D.; funding acquisition, J.D. All authors have read and agreed to the published version of the manuscript.
Funding
This research received no external funding.
Institutional Review Board Statement
Not applicable.
Informed Consent Statement
Not applicable.
Data Availability Statement
Not applicable.
Conflicts of Interest
The authors declare no conflict of interest.
References
- Saunders, P.; Fischer, J.; Sadli, M.; Battuello, M.; Park, C.W.; Yuan, Z.; Yoon, H.; Li, W.; van der Ham, E.; Sakuma, F.; et al. Uncertainty Budgets for Calibration of Radiation Thermometers below the Silver Point. Int. J. Thermophys. 2008, 29, 1066–1083. [Google Scholar]
- Toullier, T.; Dumoulin, J.; Mevel, L. A Kriging-based Interacting Particle Kalman Filter for the Simultaneous Estimation of Temperature and Emissivity in Infra-Red Imaging. In Proceedings of the IFAC 2020–21st IFAC World Congress, Berlin, Germany, 11–17 July 2020. [Google Scholar]
- Fumihiro, S.; Susumu, H. Establishing a practical temperature standard by using a narrow-band radiation thermometer with a silicon detector. Keiryō Kenkyūjo Hōkoku 1983, 32, 91–97. [Google Scholar]
- Toullier, T. Simultaneous Characterization of Objects Temperature and Radiative Properties through Multispectral Infrared Thermography. Ph.D. Thesis, Université de Rennes 1, Rennes, France, 2019. [Google Scholar]
- Copernicus Climate Change Service. ERA5-Land Hourly Data from 2001 to Present. Available online: https://cds.climate.copernicus.eu/cdsapp#!/dataset/reanalysis-era5-land?tab=overview (accessed on 8 November 2023).
- Adelard, L.; Pignolet-Tardan, F.; Mara, T.; Lauret, P.; Garde, F.; Boyer, H. Sky temperature modelisation and applications in building simulation. Renew. Energy 1998, 15, 418–430. [Google Scholar] [CrossRef]
- Berdahl, P.; Fromberg, R. The Thermal Radiance of Clear Skies. Sol. Energy 1982, 29, 299–314. [Google Scholar] [CrossRef]
- Toullier, T.; Dumoulin, J.; Mevel, L. Study of Complementary Multi-Sensors Data Influence on Infrared Thermography Measurements for in-Situ Long-Term Monitoring. In Proceedings of the Multimodal Sensing: Technologies and Applications, Munich, Germany, 26–27 June 2019; SPIE: Washington, DC, USA, 2019; Volume 11059, pp. 144–153. [Google Scholar]
- Alduchov, O.A.; Eskridge, R.E. Improved Magnus Form Approximation of Saturation Vapor Pressure. J. Appl. Meteorol. Climatol. 1996, 35, 601–609. [Google Scholar] [CrossRef]
| Disclaimer/Publisher’s Note: The statements, opinions and data contained in all publications are solely those of the individual author(s) and contributor(s) and not of MDPI and/or the editor(s). MDPI and/or the editor(s) disclaim responsibility for any injury to people or property resulting from any ideas, methods, instructions or products referred to in the content. |
© 2023 by the authors. Licensee MDPI, Basel, Switzerland. This article is an open access article distributed under the terms and conditions of the Creative Commons Attribution (CC BY) license (https://creativecommons.org/licenses/by/4.0/).


