Proceeding Paper

Data-Driven Drug Repurposing in Diabetes Mellitus through an Enhanced Knowledge Graph †

by
Sotiris Ouzounis
1,2,
Alexandros Kanterakis
3,
Vasilis Panagiotopoulos
2,4,
Dionisis Cavouras
2,
Panagiotis Zoumpoulakis
1,5,
Minos-Timotheos Matsoukas
2,4,
Theodora Katsila
1,* and
Ioannis Kalatzis
2,*
1
Institute of Chemical Biology, National Hellenic Research Foundation, 11635 Athens, Greece
2
Department of Biomedical Engineering, University of West Attica, 12243 Egaleo, Greece
3
Institute of Computer Sciences, Foundation for Research and Technology Hellas, 71110 Heraklion, Greece
4
Cloudpharm PC, 15125 Marousi, Greece
5
Department of Food Science and Technology, University of West Attica, 12243 Egaleo, Greece
*
Authors to whom correspondence should be addressed.
Presented at the Advances in Biomedical Sciences, Engineering and Technology (ABSET) Conference, Athens, Greece, 10–11 June 2023.
Eng. Proc. 2023, 50(1), 9; https://doi.org/10.3390/engproc2023050009
Published: 31 October 2023

Abstract

:
Diabetes mellitus affects more than 400 million people worldwide, and the incidence of disease is rising. Current anti-hyperglycemic agents share major drawbacks, such as hypoglycemia and low potency due to a lack of target specificity. Drug repurposing accelerates drug research and development pipelines and empowers chemical space enrichment. Herein, we propose a data-driven approach towards drug repurposing in diabetes mellitus by integrating heterogeneous biomedical data in a unified knowledge graph. Through extensive data mining in public repositories, diabetes-related multimodal data have been retrieved. Several data analysis techniques were employed to extract information and define semantic associations, followed by data parsing and, next, descriptive statistics, regression, and cluster analysis. Biomedical entity recognition and negation detection were performed by natural language processing. Predefined biological ontologies served as reference endpoints for class definition upon data integration. Graph analytics were performed, and drug–drug, protein–protein, drug–protein, and drug–disease interactions were established. A majority vote-based machine learning framework for the prediction of human cytochrome P450 inhibitors was also integrated into the proposed enhanced knowledge graph analysis that facilitates data-driven ranking for drug repurposing candidates in diabetes mellitus. The presented method yields a ranked list of repurposing candidates.

1. Introduction

Diabetes mellitus (DM) is a worldwide fast-growing disease of the endocrine system, posing as a modern pandemic according to its global prevalence. As the latest data from the International Diabetes Federation showed, 536.6 million people were affected by diabetes in 2021, while 6.7 million deaths occurred due to this condition. The number of people afflicted by diabetes is expected to rise to 783.2 million in 2045 [1]. Diabetes is a metabolic disorder in which continuous elevated levels of blood glucose occur, a state called hyperglycemia. Diabetes can be classified into four main categories based on disease etiology and pathogenesis [2]. The most prevalent disease phenotypes include type 1 (5–10%) and type 2 (90–95%) diabetes [2]. Type 1 diabetes is an insulin-dependent autoimmune disorder that is characterized by pancreatic beta-cell dysfunction, leading to dysregulation of insulin response and hyperglycemia [3]. Type 2 diabetes, on the other hand, is insulin-independent and characterized by insulin resistance, resulting in the excessive function of beta-cells to maintain normoglycemia [4].
Apart from insulin, 59 antihyperglycemic compounds have FDA approval, of which 36 are administered as monotherapies and 23 as combination therapies [5]. The established classes of anti-diabetic drugs are Sulfonylureas (SU), Thiazolidinediones (TZD), Biguanide, Alpha-Glucosidase inhibitors, Dipeptidyl Peptidase-4 (DPP4) inhibitors, Sodium-Glucose Cotransporter Type 2 (SGLT2) inhibitors, Glucagon-Like Peptide-1 Receptor (GLP1R) agonists and Meglitinides [5]. Yet, several of the existing antihyperglycemic compounds come with major drawbacks, such as hypoglycemia, low potency, and side effects due to a lack of target specificity [6]. Therefore, more potent, safe, and highly selective antihyperglycemic drugs remain an unmet need.
Along with conventional drug discovery, drug repurposing holds promise for the control of the diabetes epidemic [7]. To this end, several in silico approaches that employ heterogeneous data sources have been developed, such as machine learning, text mining, and network analysis [8] or knowledge graph-based drug repurposing. The latter facilitates a data integration framework for the unified analysis of heterogeneous data, enabling the utilization of different layers of information [9]. Ghorbanali et al. [10] proposed the DrugRep-KG method, which employs knowledge graph embedding to represent drugs and disease associations in a unified latent space towards drug repurposing. Zhu et al. [11] introduced a similar approach, which includes several drug databases in an integrated and unified knowledge graph. The drug knowledge graph was then used to predict drug repurposing candidates through machine learning models. Herein, we propose a data-driven approach towards drug repurposing in diabetes mellitus by integrating heterogeneous biomedical data and predictions of in-house machine learning models in a unified knowledge graph. Molecular docking data were used to enrich the knowledge graph in question. Overall, the proposed enhanced knowledge graph analysis facilitates a data-driven ranking for drug repurposing candidates in diabetes mellitus.

2. Materials and Methods

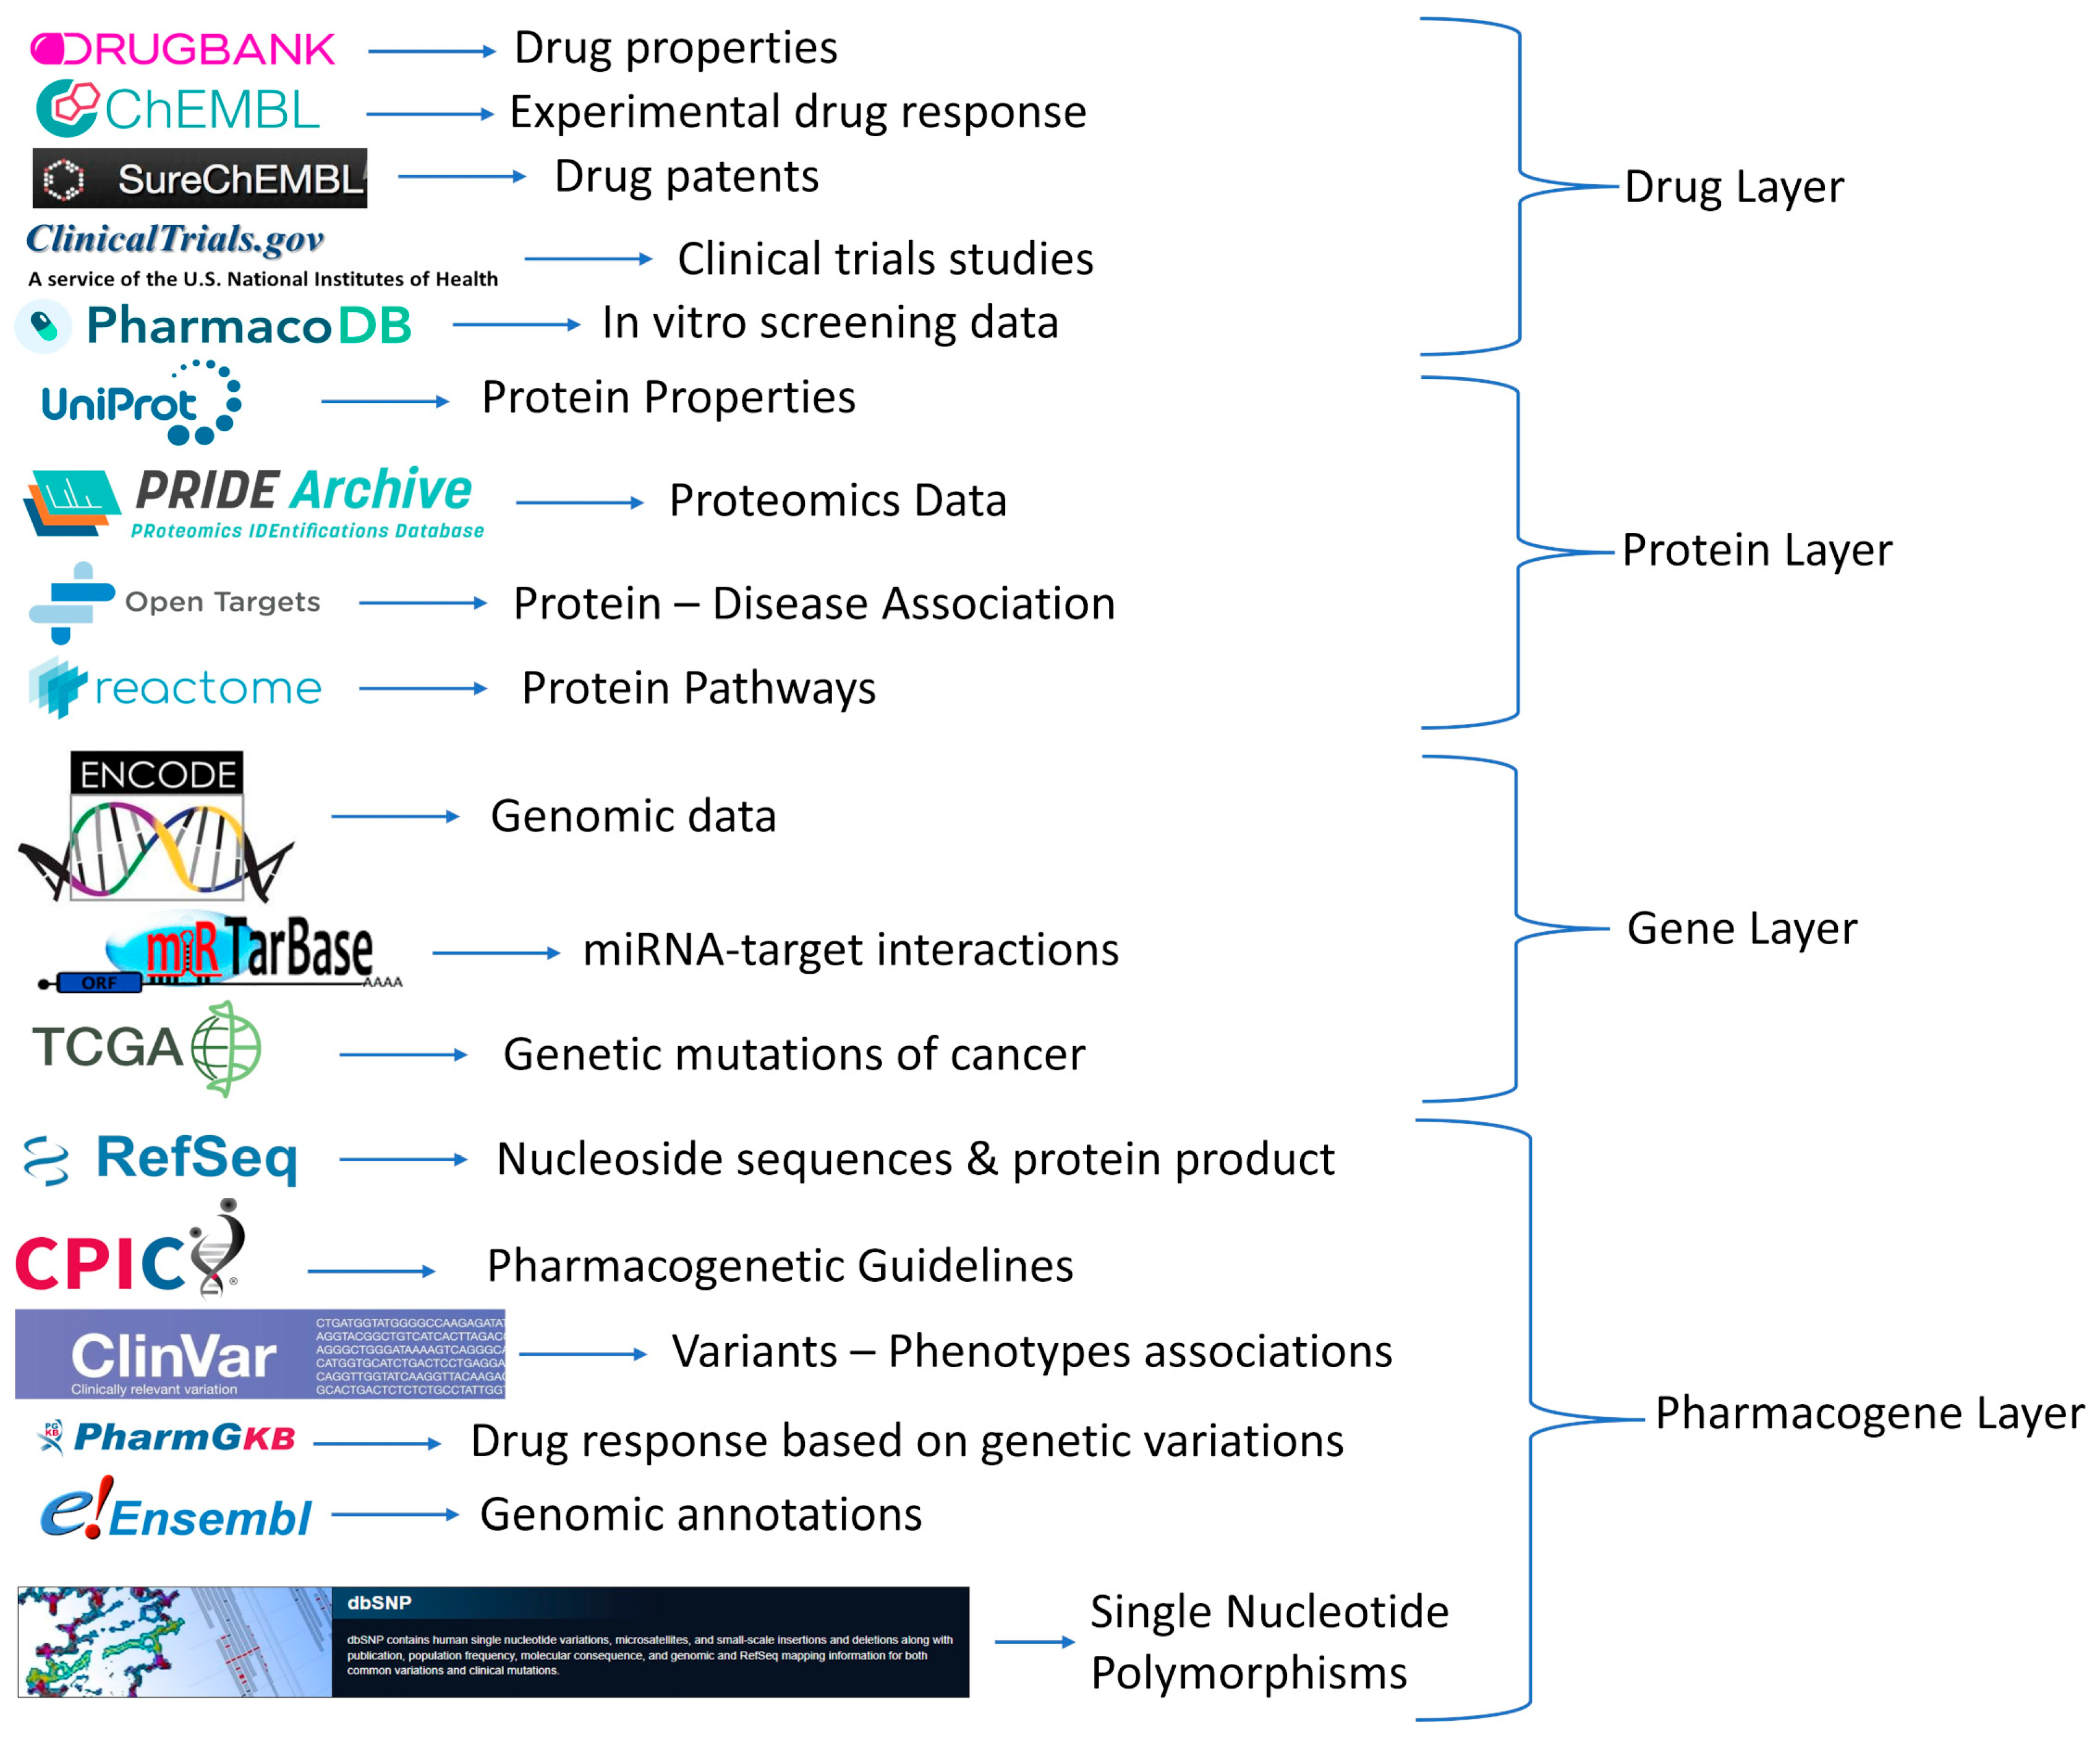
2.1. Databases and Repositories

Heterogenous biomedical data were collected from publicly available repositories. Information regarding bioactive molecules was gathered from the DrugBank database [12]. An important feature provided by this repository is the mapping of protein targets for each bioactive molecule with the UniProt database [13]. UniProt served as the main data source for proteins, providing information about their biological function and structure. Next, the SureChEMBL platform [14] was used to extract patent data, while datasets from clinical trials were collected from ClinicalTrials.gov [15]. Additionally, pharmacogenomics data were extracted from the PharmGKB repository [16]. Another repository used was Omnipath [17], as it contains information about signaling network interactions, enzyme-substrate relationships, protein complexes, protein annotations, and intracellular communication. Complementary to the aforementioned datasets, information about molecular pathways was retrieved from Reactome [18], while pharmacogenomic data were enriched with data from the ENSEMBL repository [19]. Additionally, pharmacogenomic recommendations were obtained from CPIC [20]. Gene sequences were retrieved from RefSeq [21]. ClinVar [22] and dbSNP [23] platforms provided information about the clinical significance of selected genomic variants (missense mutations) and their frequency of occurrence in different population groups. The ChEMBL repository was also queried [24] for experimental data regarding either the pharmacological response of chemical molecules in cellular assays or experimental binding values to specific protein targets. miRNA–protein interactions were collected from the mirTarBase platform [25], and TCGA was queried for gene-cancer type associations [26]. Data on drug responses was retrieved from PharmacoDB [27]. Finally, data regarding protein–disease associations were obtained from the OpenTargets platform [28]. The databases used, and the layers of information they provided are illustrated in Figure 1.

2.2. Data Gathering

Data gathering was performed per data source. Data were available a. as downloadable files either through their webpage or FTP connection (e.g., DrugBank, Uniprot), b. via data scraping (e.g., SureChEMBL) or c. REST APIs (e.g., Ominpath).

2.3. Information Extraction per Data Type

Μining and extensive filtering were performed per data type. For SureChEMBL, the first step was to parse the data retrieved via scraping and then extract the claims of each patent. Named entity recognition (NER) was applied to annotate biomedical terms. For clinical trials, data mining and filtering were applied to extract drug–disease and protein–disease associations. For pharmacogenomics, data on clinical significance for the missense mutations located at protein binding sites were prioritized, along with their frequency of occurrence and pharmacogenomic recommendations. The data collected from OpenTargets were filtered, focusing only on direct relations. Finally, only drug–protein associations along with experimental values per assay type survived filtering for ChEMBL-derived data. The overall workflow for each data type is summarized in Figure 2.

2.4. Molecular Docking

Molecular interaction data were also generated by molecular docking as an extra layer of information. In this context, virtual screening through docking simulations was performed for 7,955 bioactive molecules and 529 protein targets. Autodock vina [29] and Protein Data Bank (PDB) were used [30].

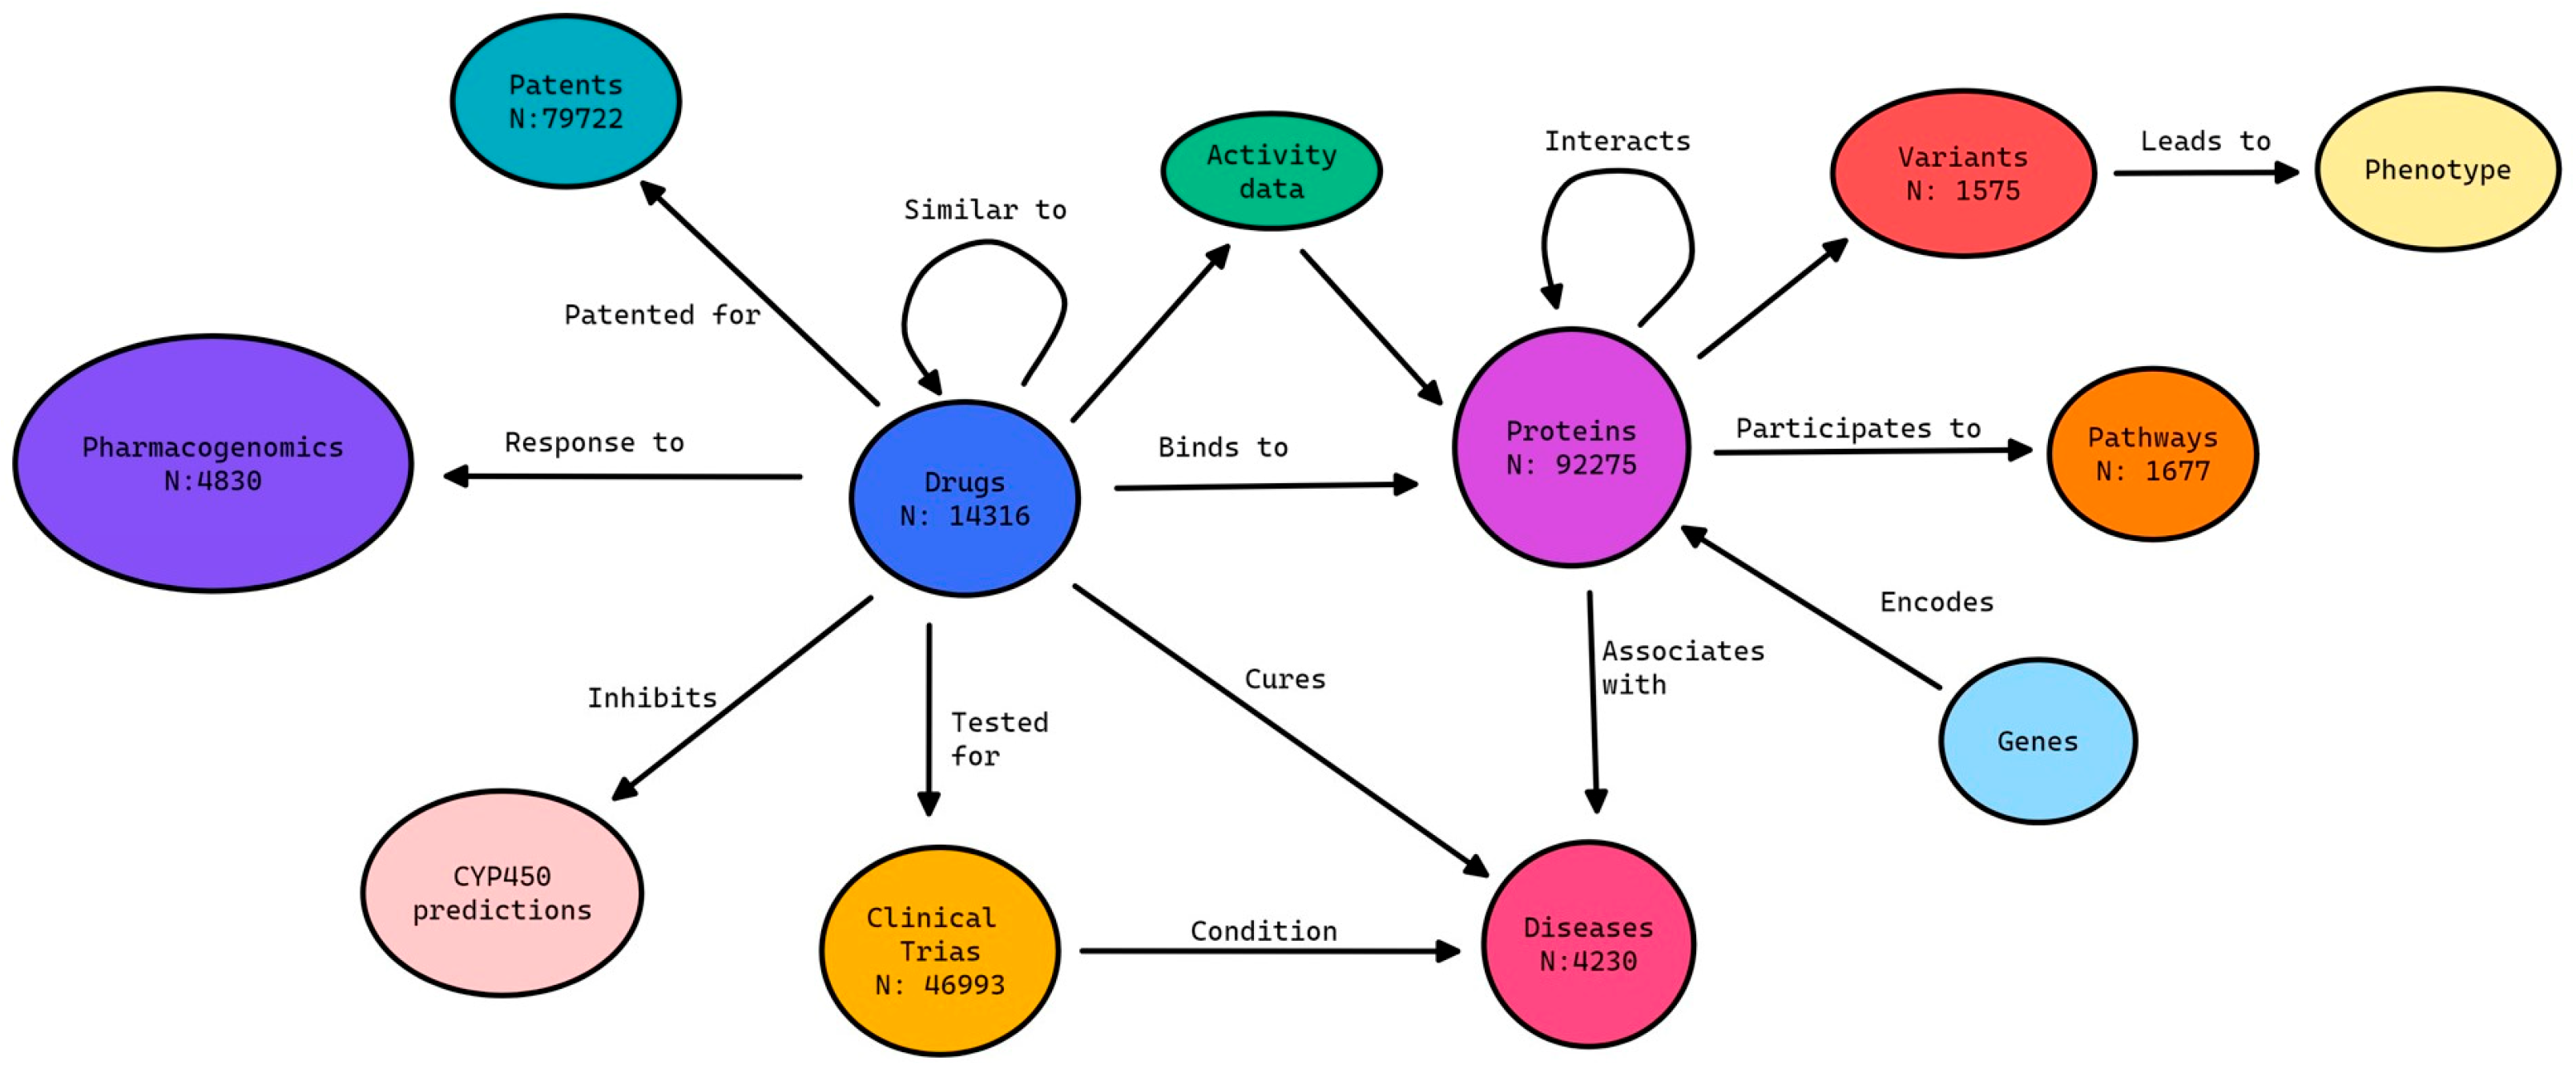
2.5. Data Integration in an Enhanced Knowledge Graph

The information extracted led to large data volume, complex inter-relationships, and extreme heterogeneity. Relational databases could not be used as they lack scalability and cannot handle unstructured data. Hence, a graph database was employed to manage and query connected data that share semantic relations (Figure 3). For data integration in a unified knowledge graph, further preprocessing of the extracted information took place. The knowledge graph in question was further enriched with cytochrome P450 toxicity predictions [31]. Additionally, docking scores were included after normalization [32].

2.6. Graph-Based Machine Learning

Link prediction employing machine learning models was applied based on the subnetwork of drug–protein associations. The aim was to predict new relationships between these two entities of the graph in question, taking into account already-known relationships. To this end, the subnetwork of interest was extracted from the knowledge graph, and drug–protein pairs were labeled by assigning pairs with known interactions to the positive class, whereas the negative class included those pairs devoid of drug–protein associations as indicated by experimental values (IC50, EC50, and Ki). Next, feature extraction was performed based on local statistical measurements of the distances between drug–protein pairs using the Fast Random Projection (FastRP) method [33]. Of note, the extracted measurements characterized each node and not the pair. Therefore, the next step was to combine the pairs by multiplying the feature vectors of each node. By importing the drug–protein pairs and their features, classifiers were designed and trained to distinguish between the connected and non-connected pairs. Data splitting took place in a 70:30 ratio for training and test sets. The training data set was used to design three classifiers (Random Forest, Support Vector Machine, and k–nearest neighbors), for which the optimal parameters were found through 10-fold cross-validation. The optimal models of each classifier were tested on the external test set. The process of splitting the data, designing, and testing the classifiers was performed ten times.

3. Results

3.1. Link Prediction through Machine Learning

The machine learning models developed to perform link prediction for the drug–protein pairs considered were evaluated through 10-fold cross-validation and tested in an external test set. Τhe mean performance of the models employing the FastRP embedding method is provided in Table 1.
As summarized in Table 1, metrics indicate that the models a. generalize well enough, as they achieve similar performance in the external test set and b. discriminate the drug–protein pairs that are linked from those that are not. The optimal parameters selected for each classifier through cross-validation were the following:
  • Random Forest: 500 trees (ntrees) with 65 features sampled during splitting at each node (mtry).
  • Support Vector Machines: radial kernel basis function as kernel, sigma equal to 0.0043, and the cost of constraints violation (C) set to 1.
  • k–Nearest Neighbors: 9 neighbors (k).

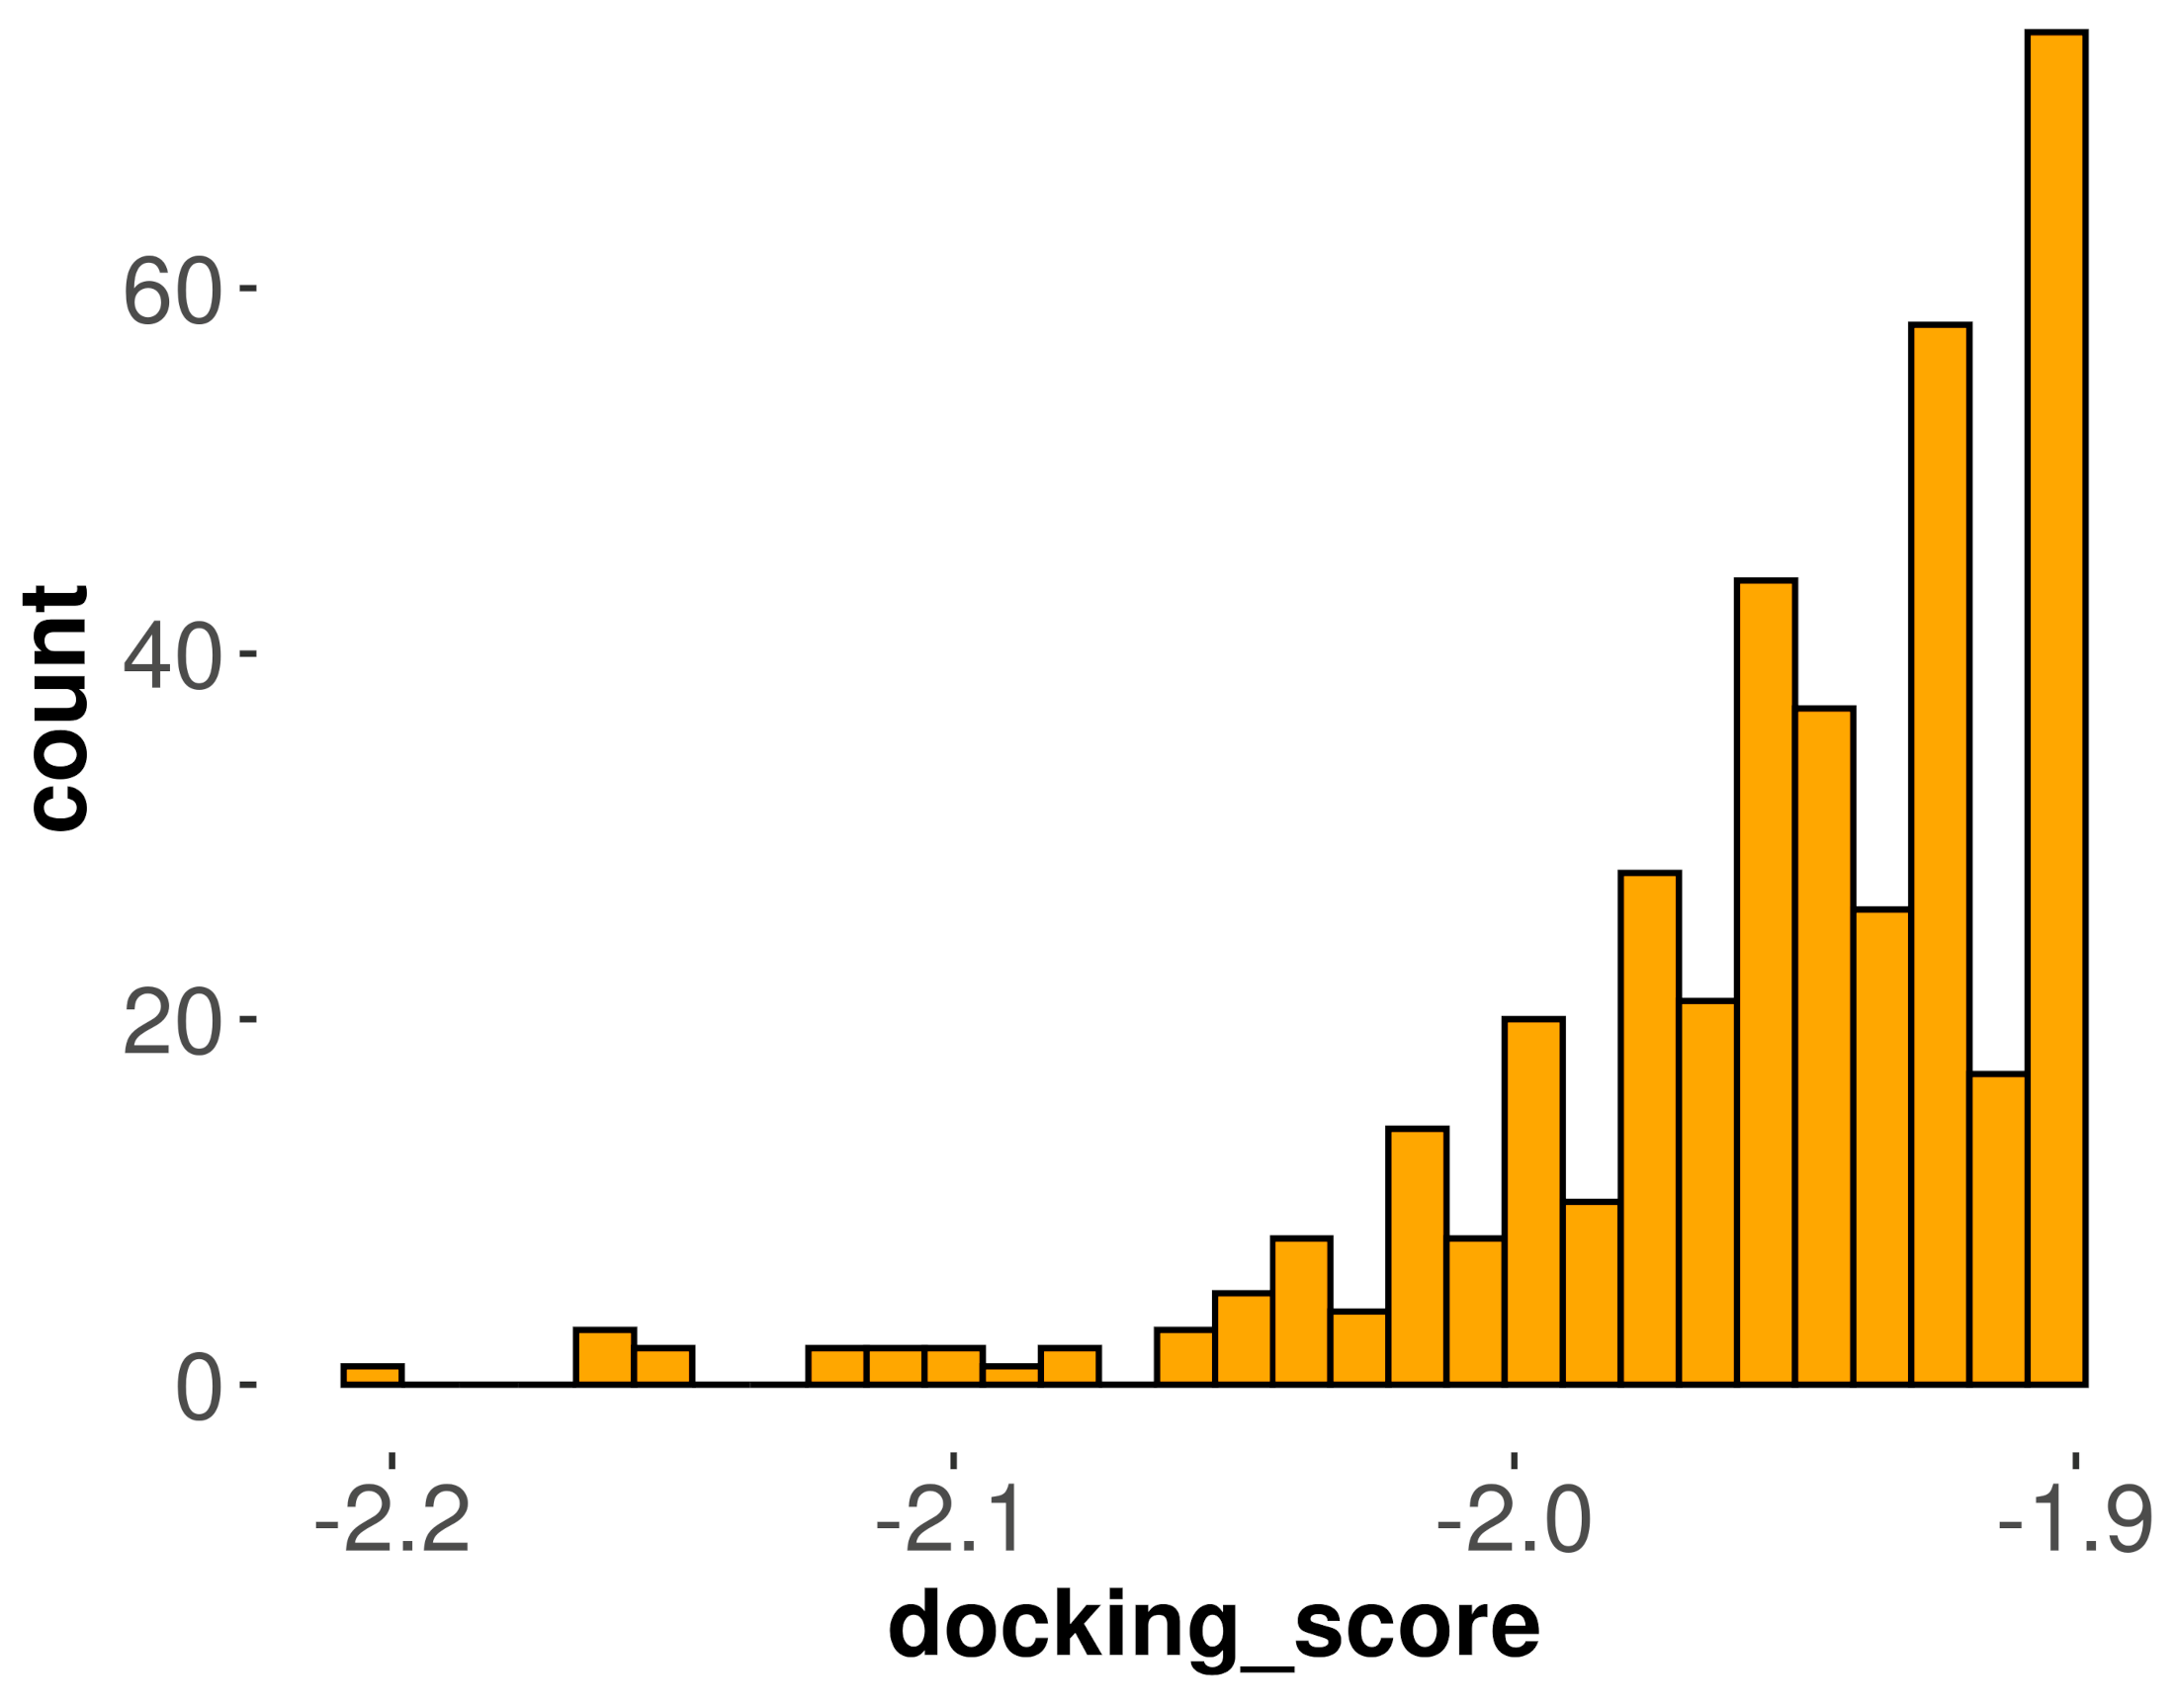
3.2. Molecular Docking Analysis for DPP-4 Inhibitors

To identify dipeptidyl peptidase-4 (DPP-4) inhibitors, docking results were analyzed for drug repurposing candidates. A simple condition was set to identify the most potent inhibitors based on which the docking score of the new inhibitor should be better than the docking score of the reference inhibitor of DPP-4. The list of drug repurposing candidates is depicted in Figure 4 as a histogram of their docking scores; 15 compounds were found to be more potent DPP-4 inhibitors with a normalized docking score lower than −2.05, among 392 test-compounds that had a score lower than −1.9 (reference score).

3.3. Identifying Drug Repurposing Candidates

The top-15 drug repurposing candidates were filtered based on a. cytochrome P450 inhibition, b. structural similarity to known DPP4 inhibitors (Tanimoto score), c. data from clinical trials, d. patent data and pharmacogenomics and led to top-four drug repurposing candidates. The latter are ranked by their docking scores, their probability of serving as DPP-4 ligands according to the SVM classifier, and their Tanimoto scores.

4. Discussion

Herein, an enhanced knowledge graph was designed for a holistic view, processing, and curation of biomedical knowledge coupled to a. structural information generated by molecular docking and b. machine learning models. Overall, such a design allowed for faster and better filtering of drug repurposing candidates in diabetes mellitus after building upon the efficacy, safety, and selectivity ranking for test compounds. DPP-4 served as a paradigm, yet our strategy is robust and easy to adapt.

5. Conclusions

The enhanced knowledge graph analysis presented herein facilitates data-driven ranking for drug repurposing candidates in diabetes mellitus. This is a unified system for integrating multi-modal heterogeneous data for informed-drug repurposing. DPP-4 served as a paradigm, resulting in top-four candidates. Overall, this is a robust adaptive strategy.

Author Contributions

Conceptualization, I.K. and T.K..; methodology, S.O., A.K. and V.P.; validation, S.O., A.K. and V.P; formal analysis, S.O. and A.K.; investigation, S.O., A.K. and V.P.; resources, P.Z., M.-T.M. and T.K.; data curation, S.O., A.K. and V.P.; writing—original draft preparation, S.O., I.K. and T.K.; writing—review and editing, D.C., I.K., M.-T.M., P.Z. and T.K.; supervision, A.K., D.C., M.-T.M., P.Z., I.K. and T.K.; funding acquisition, P.Z., M.-T.M. and T.K. All authors have read and agreed to the published version of the manuscript.

Funding

This research is supported by the European Regional Development Fund of the European Union and Greek national funds through the Operational Program Competitiveness, Entrepreneurship and Innovation, under the call RESEARCH—CREATE—INNOVATE (project code: T2EDK-03153). The APC was funded by the ABSET 2023 conference.

Institutional Review Board Statement

Not applicable.

Informed Consent Statement

Not applicable.

Data Availability Statement

All data are available within the article.

Conflicts of Interest

The authors declare no conflict of interest.

References

  1. International Diabetes Federation. Five questions on the IDF Diabetes Atlas. Diabetes Res. Clin. Pract. 2013, 102, 147–148. [Google Scholar] [CrossRef] [PubMed]
  2. Banday, M.Z.; Sameer, A.S.; Nissar, S. Pathophysiology of Diabetes: An Overview. Avicenna J. Med. 2020, 10, 174–188. [Google Scholar] [CrossRef] [PubMed]
  3. Kahaly, G.J.; Hansen, M.P. Type 1 Diabetes Associated Autoimmunity. Autoimmun. Rev. 2016, 15, 644–648. [Google Scholar] [CrossRef] [PubMed]
  4. Muoio, D.M.; Newgard, C.B. Mechanisms of Disease: Molecular and Metabolic Mechanisms of Insulin Resistance and β-Cell Failure in Type 2 Diabetes. Nat. Rev. Mol. Cell Biol. 2008, 9, 193–205. [Google Scholar] [CrossRef]
  5. Dahlén, A.D.; Dashi, G.; Maslov, I.; Attwood, M.M.; Jonsson, J.; Trukhan, V.; Schiöth, H.B. Trends in Antidiabetic Drug Discovery: FDA Approved Drugs, New Drugs in Clinical Trials and Global Sales. Front. Pharmacol. 2022, 12, 807548. [Google Scholar] [CrossRef]
  6. Chaudhury, A.; Duvoor, C.; Reddy Dendi, V.S.; Kraleti, S.; Chada, A.; Ravilla, R.; Marco, A.; Shekhawat, N.S.; Montales, M.T.; Kuriakose, K.; et al. Clinical Review of Antidiabetic Drugs: Implications for Type 2 Diabetes Mellitus Management. Front. Endocrinol. 2017, 8, 6. [Google Scholar] [CrossRef]
  7. Zhu, S.; Bai, Q.; Li, L.; Xu, T. Drug Repositioning in Drug Discovery of T2DM and Repositioning Potential of Antidiabetic Agents. Comput. Struct. Biotechnol. J. 2022, 20, 2839–2847. [Google Scholar] [CrossRef]
  8. Jarada, T.N.; Rokne, J.G.; Alhajj, R. A Review of Computational Drug Repositioning: Strategies, Approaches, Opportunities, Challenges, and Directions. J. Cheminformatics 2020, 12, 1–23. [Google Scholar] [CrossRef]
  9. Zeng, X.; Tu, X.; Liu, Y.; Fu, X.; Su, Y. Toward Better Drug Discovery with Knowledge Graph. Curr. Opin. Struct. Biol. 2022, 72, 114–126. [Google Scholar] [CrossRef]
  10. Ghorbanali, Z.; Zare-Mirakabad, F.; Akbari, M.; Salehi, N.; Masoudi-Nejad, A. DrugRep-KG: Toward Learning a Unified Latent Space for Drug Repurposing Using Knowledge Graphs. J. Chem. Inf. Model. 2023, 63, 2532–2545. [Google Scholar] [CrossRef]
  11. Zhu, Y.; Che, C.; Jin, B.; Zhang, N.; Su, C.; Wang, F. Knowledge-Driven Drug Repurposing Using a Comprehensive Drug Knowledge Graph. Health Informatics J. 2020, 26, 2737–2750. [Google Scholar] [CrossRef]
  12. Wishart, D.S.; Feunang, Y.D.; Guo, A.C.; Lo, E.J.; Marcu, A.; Grant, J.R.; Sajed, T.; Johnson, D.; Li, C.; Sayeeda, Z.; et al. DrugBank 5.0: A Major Update to the DrugBank Database for 2018. Nucleic Acids Res. 2018, 46, D1074–D1082. [Google Scholar] [CrossRef] [PubMed]
  13. Bateman, A.; Martin, M.J.; O’Donovan, C.; Magrane, M.; Alpi, E.; Antunes, R.; Bely, B.; Bingley, M.; Bonilla, C.; Britto, R.; et al. UniProt: The Universal Protein Knowledgebase. Nucleic Acids Res. 2017, 45, D158–D169. [Google Scholar] [CrossRef]
  14. Papadatos, G.; Davies, M.; Dedman, N.; Chambers, J.; Gaulton, A.; Siddle, J.; Koks, R.; Irvine, S.A.; Pettersson, J.; Goncharoff, N.; et al. SureChEMBL: A Large-Scale, Chemically Annotated Patent Document Database. Nucleic Acids Res. 2016, 44, D1220–D1228. [Google Scholar] [CrossRef] [PubMed]
  15. Zarin, D.A.; Tse, T.; Williams, R.J.; Califf, R.M.; Ide, N.C. The ClinicalTrials.Gov Results Database—Update and Key Issues. N. Engl. J. Med. 2011, 364, 852–860. [Google Scholar] [CrossRef] [PubMed]
  16. Van Den Boom, D.; Wjst, M.; Everts, R.E. PharmGKB: The Pharmacogenomics Knowledge Base Caroline. Methods Mol. Biol. 2013, 1015, 71–85. [Google Scholar] [CrossRef]
  17. Türei, D.; Korcsmáros, T.; Saez-Rodriguez, J. OmniPath: Guidelines and Gateway for Literature-Curated Signaling Pathway Resources. Nat. Methods 2016, 13, 966–967. [Google Scholar] [CrossRef]
  18. Gillespie, M.; Jassal, B.; Stephan, R.; Milacic, M.; Rothfels, K.; Senff-Ribeiro, A.; Griss, J.; Sevilla, C.; Matthews, L.; Gong, C.; et al. The Reactome Pathway Knowledgebase 2022. Nucleic Acids Res. 2022, 50, D687–D692. [Google Scholar] [CrossRef]
  19. Howe, K.L.; Achuthan, P.; Allen, J.; Allen, J.; Alvarez-Jarreta, J.; Ridwan Amode, M.; Armean, I.M.; Azov, A.G.; Bennett, R.; Bhai, J.; et al. Ensembl 2021. Nucleic Acids Res. 2021, 49, D884–D891. [Google Scholar] [CrossRef]
  20. Relling, M.V.; Klein, T.E. CPIC: Clinical Pharmacogenetics Implementation Consortium of the Pharmacogenomics Research Network. Clin. Pharmacol. Ther. 2011, 89, 464–467. [Google Scholar] [CrossRef]
  21. O’Leary, N.A.; Wright, M.W.; Brister, J.R.; Ciufo, S.; Haddad, D.; McVeigh, R.; Rajput, B.; Robbertse, B.; Smith-White, B.; Ako-Adjei, D.; et al. Reference Sequence (RefSeq) Database at NCBI: Current Status, Taxonomic Expansion, and Functional Annotation. Nucleic Acids Res. 2016, 44, D733–D745. [Google Scholar] [CrossRef] [PubMed]
  22. Landrum, M.J.; Lee, J.M.; Benson, M.; Brown, G.R.; Chao, C.; Chitipiralla, S.; Gu, B.; Hart, J.; Hoffman, D.; Jang, W.; et al. ClinVar: Improving Access to Variant Interpretations and Supporting Evidence. Nucleic Acids Res. 2018, 46, D1062–D1067. [Google Scholar] [CrossRef] [PubMed]
  23. Sherry, S.T.; Ward, M.; Sirotkin, K. DbSNP—Database for Single Nucleotide Polymorphisms and Other Classes of Minor Genetic Variation. Genome Res. 1999, 9, 677–679. [Google Scholar] [CrossRef] [PubMed]
  24. Mendez, D.; Gaulton, A.; Bento, A.P.; Chambers, J.; De Veij, M.; Félix, E.; Magariños, M.P.; Mosquera, J.F.; Mutowo, P.; Nowotka, M.; et al. ChEMBL: Towards Direct Deposition of Bioassay Data. Nucleic Acids Res. 2019, 47, D930–D940. [Google Scholar] [CrossRef]
  25. Huang, H.Y.; Lin, Y.C.D.; Cui, S.; Huang, Y.; Tang, Y.; Xu, J.; Bao, J.; Li, Y.; Wen, J.; Zuo, H.; et al. MiRTarBase Update 2022: An Informative Resource for Experimentally Validated MiRNA-Target Interactions. Nucleic Acids Res. 2022, 50, D222–D230. [Google Scholar] [CrossRef]
  26. Weinstein, J.N.; Collisson, E.A.; Mills, G.B.; Shaw, K.R.M.; Ozenberger, B.A.; Ellrott, K.; Sander, C.; Stuart, J.M.; Chang, K.; Creighton, C.J.; et al. The Cancer Genome Atlas Pan-Cancer Analysis Project. Nat. Genet. 2013, 45, 1113–1120. [Google Scholar] [CrossRef]
  27. Feizi, N.; Nair, S.K.; Smirnov, P.; Beri, G.; Eeles, C.; Esfahani, P.N.; Nakano, M.; Tkachuk, D.; Mammoliti, A.; Gorobets, E.; et al. PharmacoDB 2.0: Improving Scalability and Transparency of in Vitro Pharmacogenomics Analysis. Nucleic Acids Res. 2022, 50, D1348–D1357. [Google Scholar] [CrossRef]
  28. Ochoa, D.; Hercules, A.; Carmona, M.; Suveges, D.; Gonzalez-Uriarte, A.; Malangone, C.; Miranda, A.; Fumis, L.; Carvalho-Silva, D.; Spitzer, M.; et al. Open Targets Platform: Supporting Systematic Drug-Target Identification and Prioritisation. Nucleic Acids Res. 2021, 49, D1302–D1310. [Google Scholar] [CrossRef]
  29. Eberhardt, J.; Santos-Martins, D.; Tillack, A.F.; Forli, S. AutoDock Vina 1.2.0: New Docking Methods, Expanded Force Field, and Python Bindings. J. Chem. Inf. Model. 2021, 61, 3891–3898. [Google Scholar] [CrossRef]
  30. Berman, H.M.; Westbrook, J.; Feng, Z.; Gilliland, G.; Bhat, T.N.; Weissig, H.; Shindyalov, I.N.; Bourne, P.E. The Protein Data Bank. Nucleic Acids Res. 2000, 28, 235–242. [Google Scholar] [CrossRef]
  31. Ouzounis, S.; Panagiotopoulos, V.; Bafiti, V.; Zoumpoulakis, P.; Cavouras, D.; Kalatzis, I.; Matsoukas, M.-T.; Katsila, T. Molecular Representations Predicts CYP450 Inhibition: Toward Precision in Drug Repurposing. OMICS A J. Integr. Biol. 2023, 27, 305–314. [Google Scholar] [CrossRef] [PubMed]
  32. Ibrahim, T.M.; Bauer, M.R.; Boeckler, F.M. Applying DEKOIS 2.0 in Structure-Based Virtual Screening to Probe the Impact of Preparation Procedures and Score Normalization. J. Cheminformatics 2015, 7, 21. [Google Scholar] [CrossRef] [PubMed]
  33. Chen, H.; Sultan, S.F.; Tian, Y.; Chen, M.; Skiena, S. Fast and Accurate Network Embeddings via Very Sparse Random Projection. In Proceedings of the 28th ACM International Conference on Information and Knowledge Management, Beijing, China, 3–7 November 2019; pp. 399–408. [Google Scholar] [CrossRef]
Figure 1. Collection of public repositories mined to extract biomedical data.
Engproc 50 00009 g001
Figure 2. Data analysis pipeline per data source to extract the information of prime interest.
Engproc 50 00009 g002
Figure 3. A schematic representation of our enhanced biomedical knowledge graph.
Engproc 50 00009 g003
Figure 4. Histogram of the normalized docking scores for those test compounds sharing better docking scores than the DPP-4 reference inhibitor.
Engproc 50 00009 g004
Table 1. Machine learning models and their mean performance for ten iterations.
Metric10-Fold Cross-ValidationExternal Test Set
RFSVMKNNRFSVMKNN
Accuracy95.2396.6295.8995.1296.6895.89
Precision97.3298.9197.7697.1798.9497.71
Recall85.7586.2687.4285.8686.4787.68
MCC0.830.880.860.830.880.86
AUC0.960.970.970.960.970.97
MCC, Matthews correlation coefficient; AUC, Area Under the Curve; RF, Random Forest; SVM, Support Vector Machine; KNN, k–nearest neighbors.
Disclaimer/Publisher’s Note: The statements, opinions and data contained in all publications are solely those of the individual author(s) and contributor(s) and not of MDPI and/or the editor(s). MDPI and/or the editor(s) disclaim responsibility for any injury to people or property resulting from any ideas, methods, instructions or products referred to in the content.

