Abstract
The Matrix Profile (MP) algorithm has the potential to revolutionise many areas of data analysis. In this article, several applications to financial time series are examined. Several approaches for the identification of similar behaviour patterns (or motifs) are proposed, illustrated, and the results discussed. While the MP is primarily designed for single series analysis, it can also be applied to multi-variate financial series. It still permits the initial identification of time periods with indicatively similar behaviour across individual market sectors and indexes, together with the assessment of wider applications, such as general market behaviour in times of financial crisis. In short, the MP algorithm offers considerable potential for detailed analysis, not only in terms of motif identification in financial time series, but also in terms of exploring the nature of underlying events.
1. Introduction
Time series motifs (repeated, matched or partially matched sequences) occur both within and between individual time series [1]. Motif discovery is the task of extracting previously unknown recurrent patterns from such data sets [2] with applications in fields ranging from music [3] to seismology [4], and of course, to finance, facilitating attempts to assess the importance of historical events and predict future trends.
In the financial domain, a wide range of motif discovery approaches have been explored to date, including that of piecewise aggregate approximation (PAA) [5], used to investigate historical Standards and Poor’s S&P500 index data. In addition, a motif tracking algorithm was used to examine motifs in a West Texas intermediate (WTI) crude oil daily price time series (a popular indicator of oil prices in general) [6].
A spatio-temporal pattern-mining approach was also applied to the examination of company portfolios, where for each company examined, this was taken to correspond to a moving trajectory over a two-dimensional financial grid (for discretised size and price-to-book ratio) [7]. A set of similar financial trajectories taken over the same time period was then considered to be a motif. For a more detailed review of currently available motif discovery and evaluation techniques for financial applications, as can be seen, e.g., [8].
Among the motif discovery algorithms that we have investigated [8,9], a new data construct based upon an efficient nearest neighbours discovery method and designated as the Matrix Profile (MP) [10] has already clearly demonstrated considerable potential for its extension and flexibility of application. Thus, we are less concerned here with the relative superiority of the MP on a point-by-point basis as compared to other motif discovery algorithms, but rather a demonstration of how visual tools, namely MP plots, can provide insight on single and multiple financial series data and their macro-economic interpretation.
While such tools have their limitations (discussed in Section 3.3 and Section 3.5), considerable insight can be obtained on series coincidences and responses to events of different types, including the identification of potential hedging opportunities.
To demonstrate relevance, MP plots created using Matlab were used to identify similar patterns (motifs) within a single series. The impact, on the plot evolution of increasing motif length was also examined, where this can indicate the persistence of given behaviour over longer timescales. Additionally, histogram plots of MP data can illustrate whether the proportion of matches (motifs) or mismatches (discords) is greater for a given financial time series.
The examination of multi-dimensional MP plots for localised minima allows the combination of different measures for a single financial series to be explored. Additionally, periods of similar behaviour both within and across market sectors can be demonstrated in representative time series, while individual stocks contributing to a given index can also be investigated. MP use is illustrated for the financial crisis period, from January 2007 to January 2009, and verified against the relevant raw series.
2. Materials and Methods
The Matrix Profile (MP) is a novel algorithm (proposed by the Keogh research group) that has proven useful for numerous data mining and time series analysis tasks [11]. As the MP is highly scalable for time series sub-sequence all-pairs-similarity search [10], it efficiently identifies time series motifs and discords (i.e., mis-matches). Thus, the examination of MP plots can aid in the interpretation of distinctive or recurring patterns in financial time series.
The main advantages (amongst others) of the MP algorithm are that it:
- Returns an exact solution for motif discovery.
- Requires only one input parameter (sub-sequence length m).
- –
- For example, a similarity/distance threshold does not need to be specified (unlike for many other similar algorithms).
- Has a time complexity that is constant in sub-sequence length.
- –
- Thus, it can be constructed in a deterministic timeframe, an important consideration for time-sensitive financial applications.
- Incorporates flexibility.
- –
- No assumptions are made about the underlying data.
- –
- Is incrementally maintainable.
For an input time series with a given sub-sequence length m, the MP returns four results. These are:
- Matrix Profile Index (MPI)
- –
- For every index i (or time point) in the examined series, the MPI contains a pointer to another index j (in the original series) indicating the start location of the nearest neighbour sub-sequence (or similar behaviour pattern).
- Matrix Profile (MP)
- –
- For every index i in the examined series, the MP contains a record of the Z-normalised Euclidean distance [10] to the nearest neighbour sequence (as indicated by the MPI).Note: Zero distance implies exact match.
- Motif Index (Mi)
- –
- For the given series, Mi records the start location index of the sub-sequence that has the lowest sub-sequence distance value of MP, i.e., closest match in terms of distance or ‘classical’ time series motif.
- Discord Index (Di)
- –
- Di records the start location index of the sub-sequence that has the highest sub-sequence distance value of MP, i.e., poorest match in terms of distance or ‘classical’ time series discord.
A sample MP plot (red line) based on a synthetic input series (blue line) is shown in Figure 1. Illustrated is a MP with (a) a matching region, i.e., low MP distance values and (b) a mis-match region corresponding to high MP distance values. One important feature of the MP utilised in the following analysis is that exact matches of content are not necessary to obtain meaningful results, as a localised MP minimum value can be used to identify a close match even if the MP distance value considered is non zero.

Figure 1.
Sample synthetic Matrix Profiles [11]: (a) MP with motif region; and (b) MP with discord region.
3. Results
When investigating the Matrix Profile of a financial time series, a typical focus is on regions (as highlighted by lower MP distance values) indicating similar behaviour at some other point in the data series, as financial markets show evidence of auto-regression [12].
The nature of this behaviour can be characterised by shorter or longer sub-sequences or by common ‘shapes’, indicative of standard financial features of the original series. Examples include pennant, consisting of significant rise or fall in the series followed by a period of consolidation and the triple bottom, which occurs when the reduction in series values creates three distinct troughs, at around the same price level, before breaking out and then reversing the trend [13,14,15].
Constructing a sub-sequence of length m (to create the given MP) and starting at the index value indicated by the lowest MP distance value (i.e., the closest match), it is possible to explore whether similar regions occur at regular intervals or can be associated with external events such as, for example, an FED rate announcement.
3.1. Single Series Motif Identification
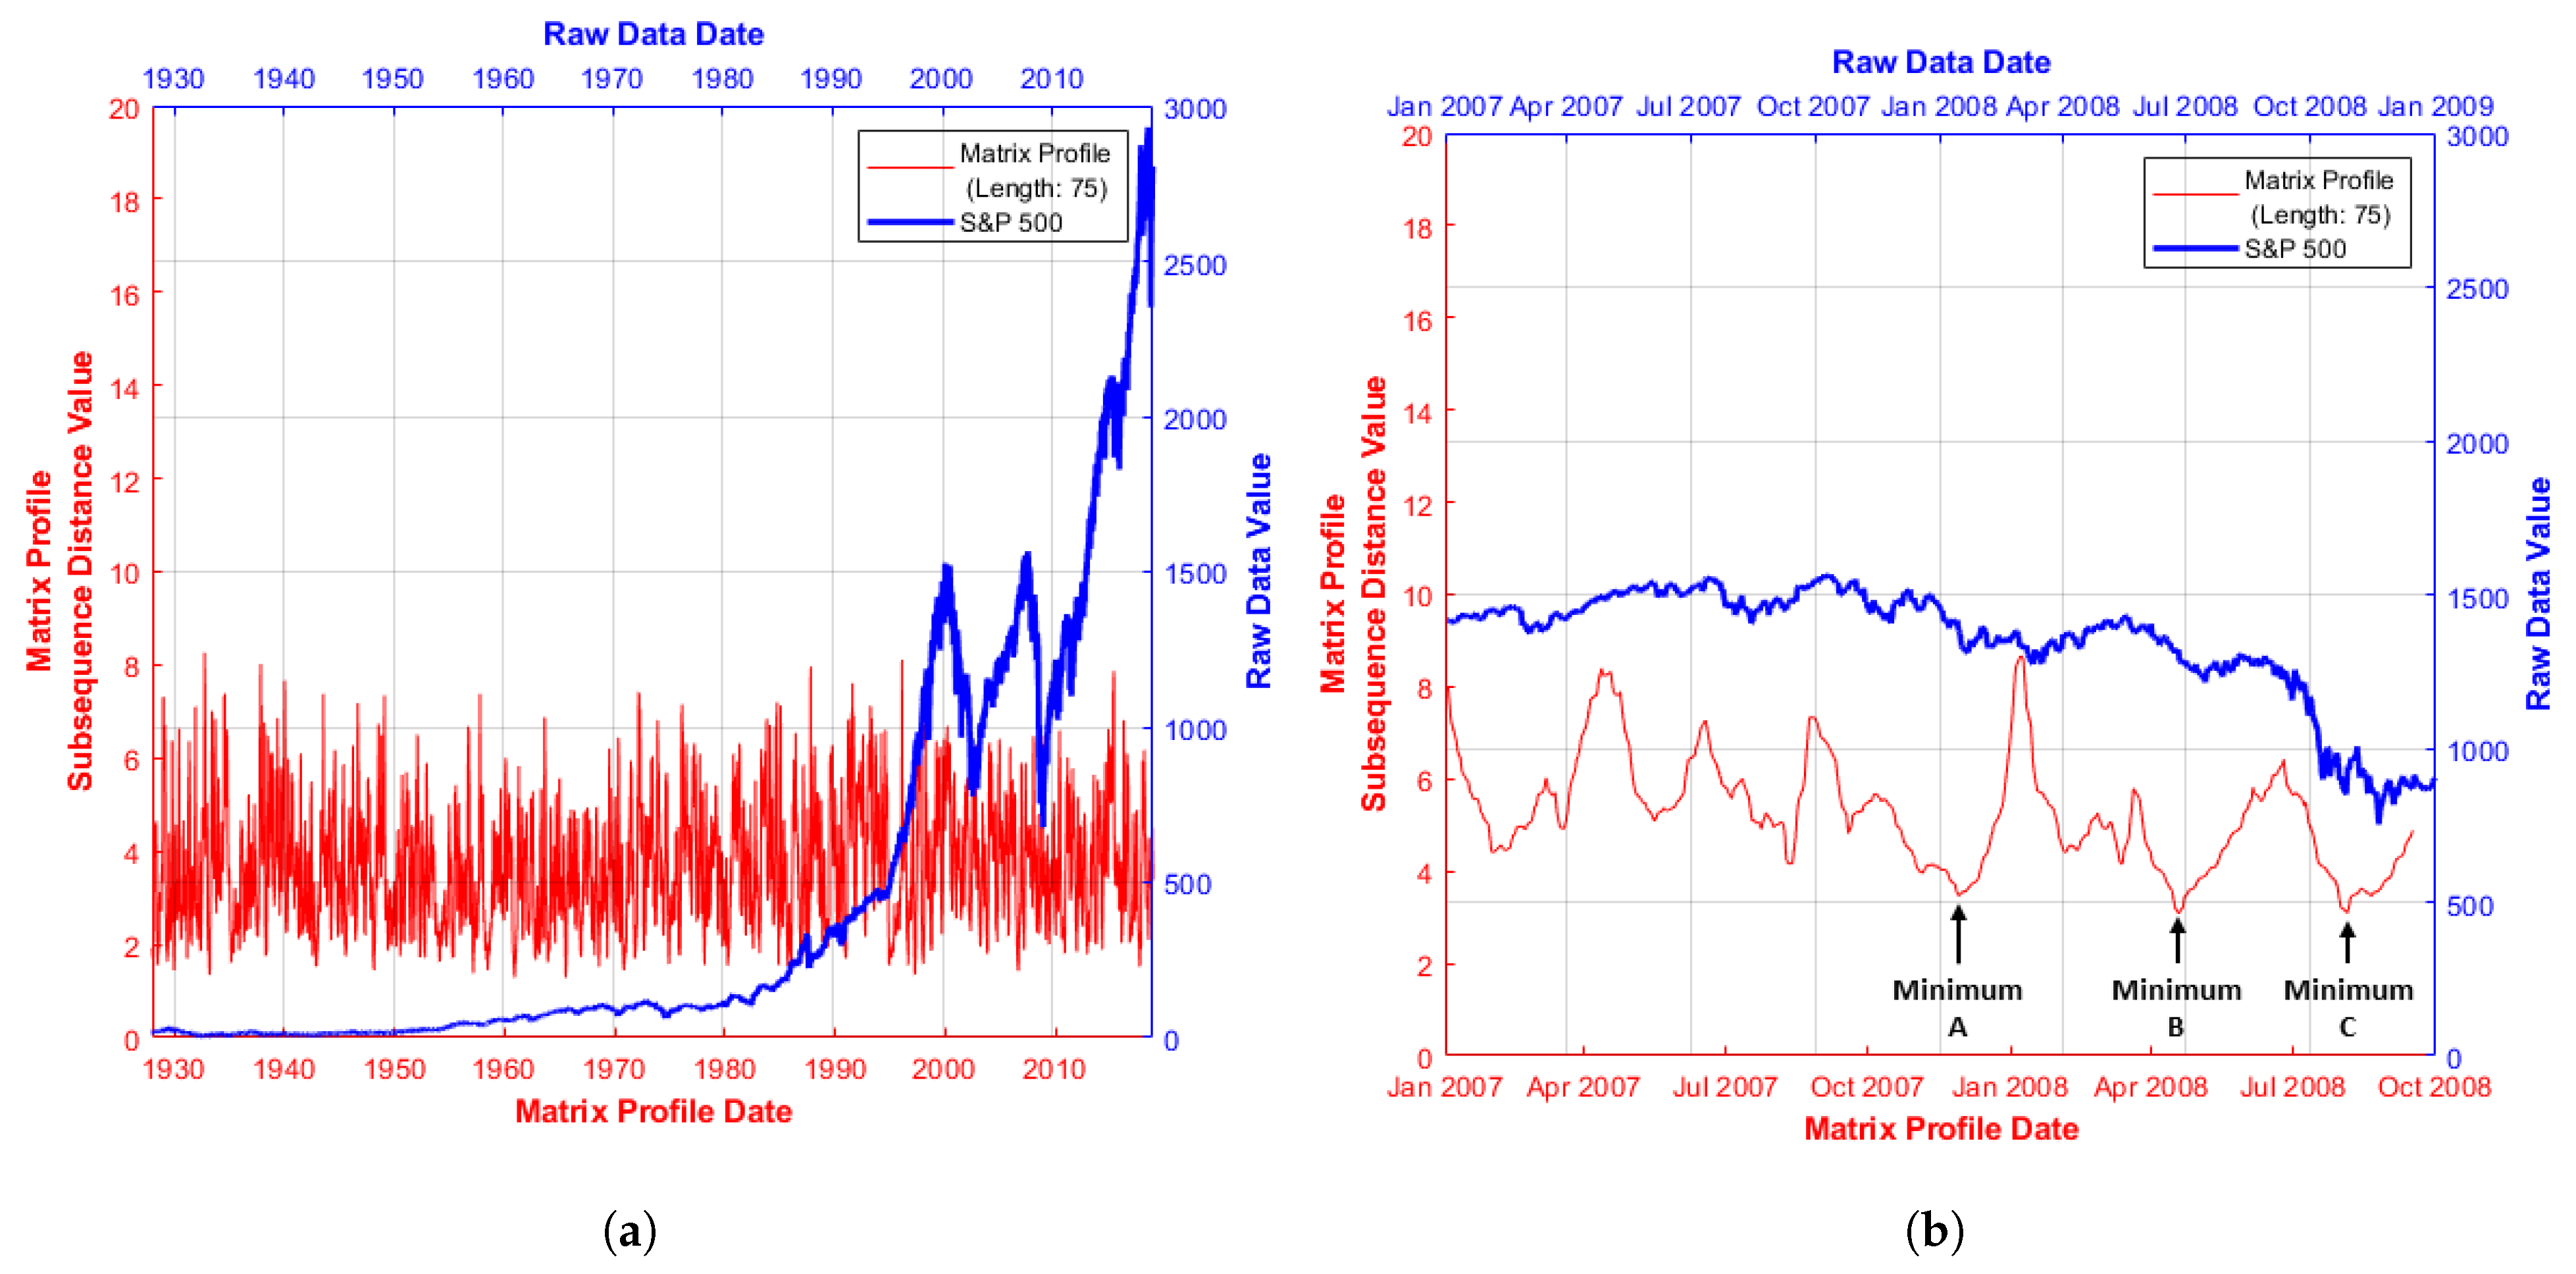
Financial data are inherently noisy however, so the MP interpretation is inevitably affected to some degree [16]. Figure 2a shows a MP for the full S&P500 time series (available at time of writing [17]) labelled by both date and original series index, while Figure 2b shows a subset of the original S&P500 series restricted by a given date window.
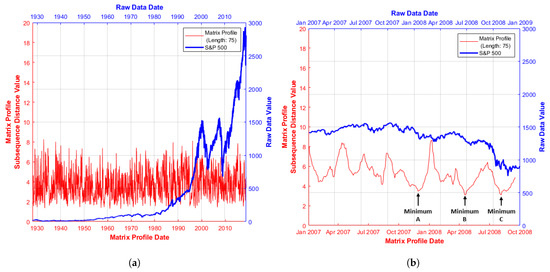
Figure 2.
S&P500 series and associated MP distance values: (a) January 1928–March 2019; and (b) January 2007–January 2009. Further MP minima location detail is contained in Table 1.
Figure 2b thus shows MP patterns illustrated in greater detail, facilitating the relation of these patterns to market conditions occurring within the given timeframe. The window chosen and used for further analysis reflects the considerable stress experienced in the global marketplace at this time [18] corresponding to initial confidence issues in the American sub-prime property market.
This sparked a global liquidity crisis [19] that caused many financial institutions to collapse and triggered large systemic interventions in the form of bailouts from both governments and global financial institutions such as the IMF, in order to re-establish system stability.
Figure 2b (red series) illustrates three points of interest highlighted as points A, B and C (with further detail in Table 1). Low MP values indicate the similar behaviour of the S&P500 index (blue series) at some other point in the time window examined (obtained from the corresponding MPI). Thus, MP plots can highlight behavioural similarities which may be less obvious from the raw series data.

Table 1.
MP minima details of reduced S&P500 series as highlighted in Figure 2b. Matrix Profile Index (MPI) values, i.e., locations of the matching index, are also shown.
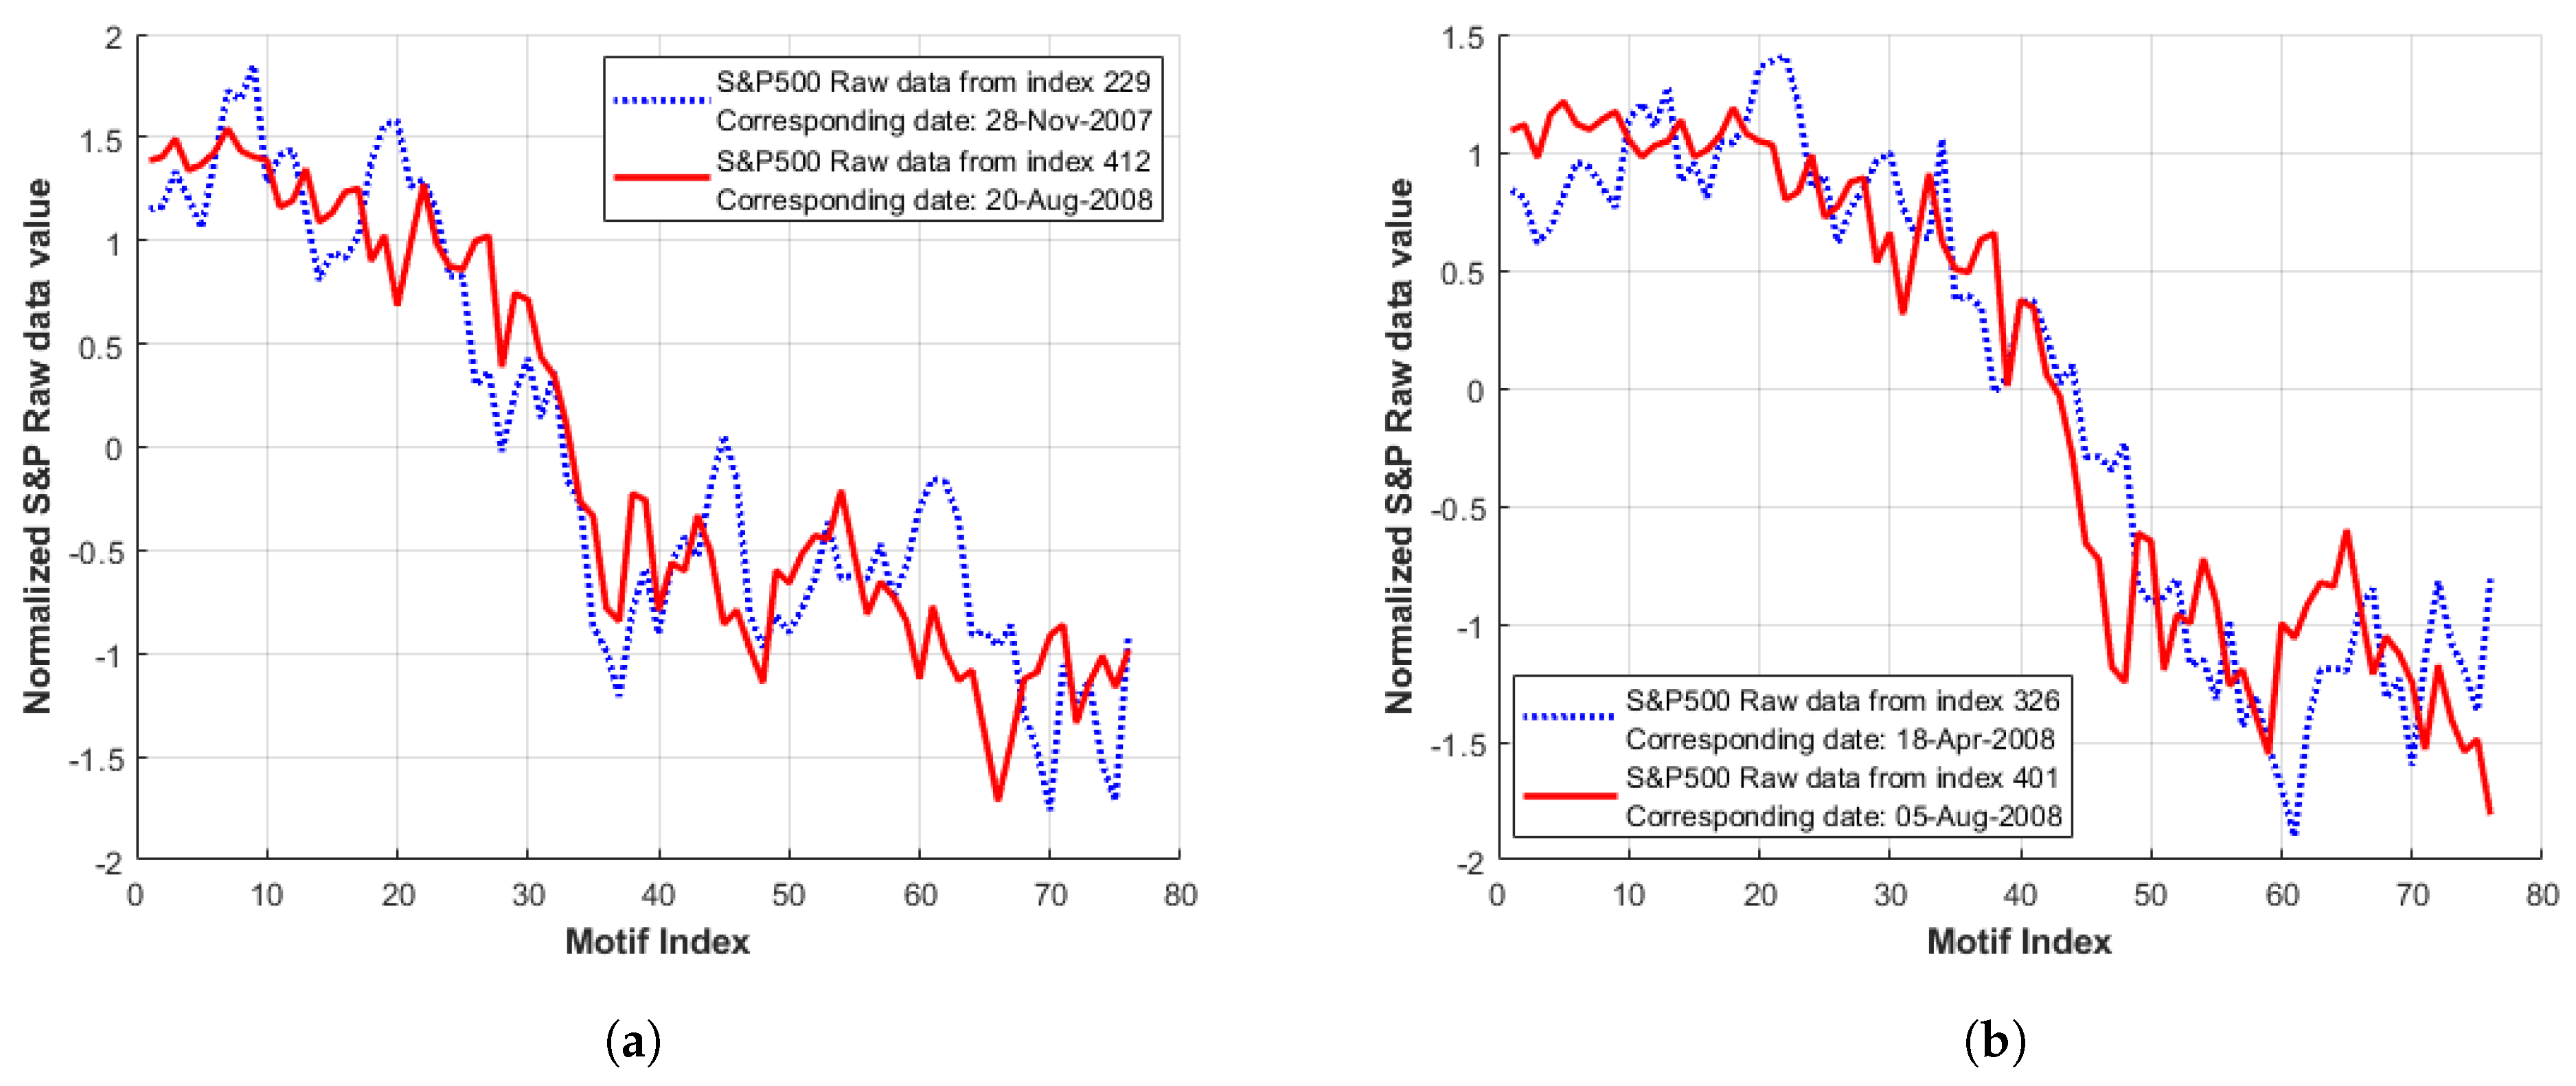
To demonstrate in more detail, Figure 3 indicates typical motifs obtained from the raw S&P500 series (as indicated by the MP and MPI values of Figure 2b and Table 1). These are constructed by the generation of a sub-sequence of MP length (m = 75) to facilitate the display of longer term sub-sequences within the length bounds enforced by the MP algorithm (minimum and maximum constraints relative to the series length apply). An initial sub-sequence from the start index of the minimal MP distance value (visual inspection) is compared with a second sub-sequence, which starts at the nearest ‘matching index’, as indicated by the corresponding MPI value (Table 1).
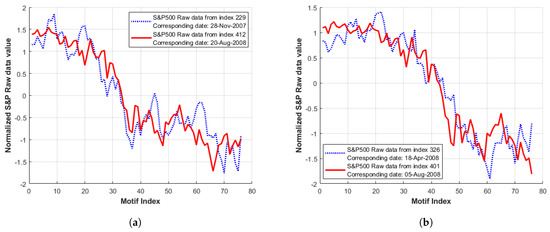
Figure 3.
Raw data of S&P500 series indicated as motif locations by low MP values in Figure 2b and Table 1. Here, the blue series indicates the sub-sequence visually identified from low MP values, while the red sub-sequence represents the nearest ‘match’ as indicated by the corresponding MPI value: (a) location A (index 229) in Figure 2b; (b) location B (index 326) in Figure 2b.
Note that although several local MP minima locations are identified in Figure 2b, only two raw data sequences are displayed in Figure 3 as, in this particular case, the remaining localised MP minima form a ‘classic’ motif (i.e., closest match in terms of distance). This can be seen in Table 1, where for minima locations B and C, the MPI values are reversed, i.e., marking the same sub-sequence.
3.2. Single Series MP Evolution over Length
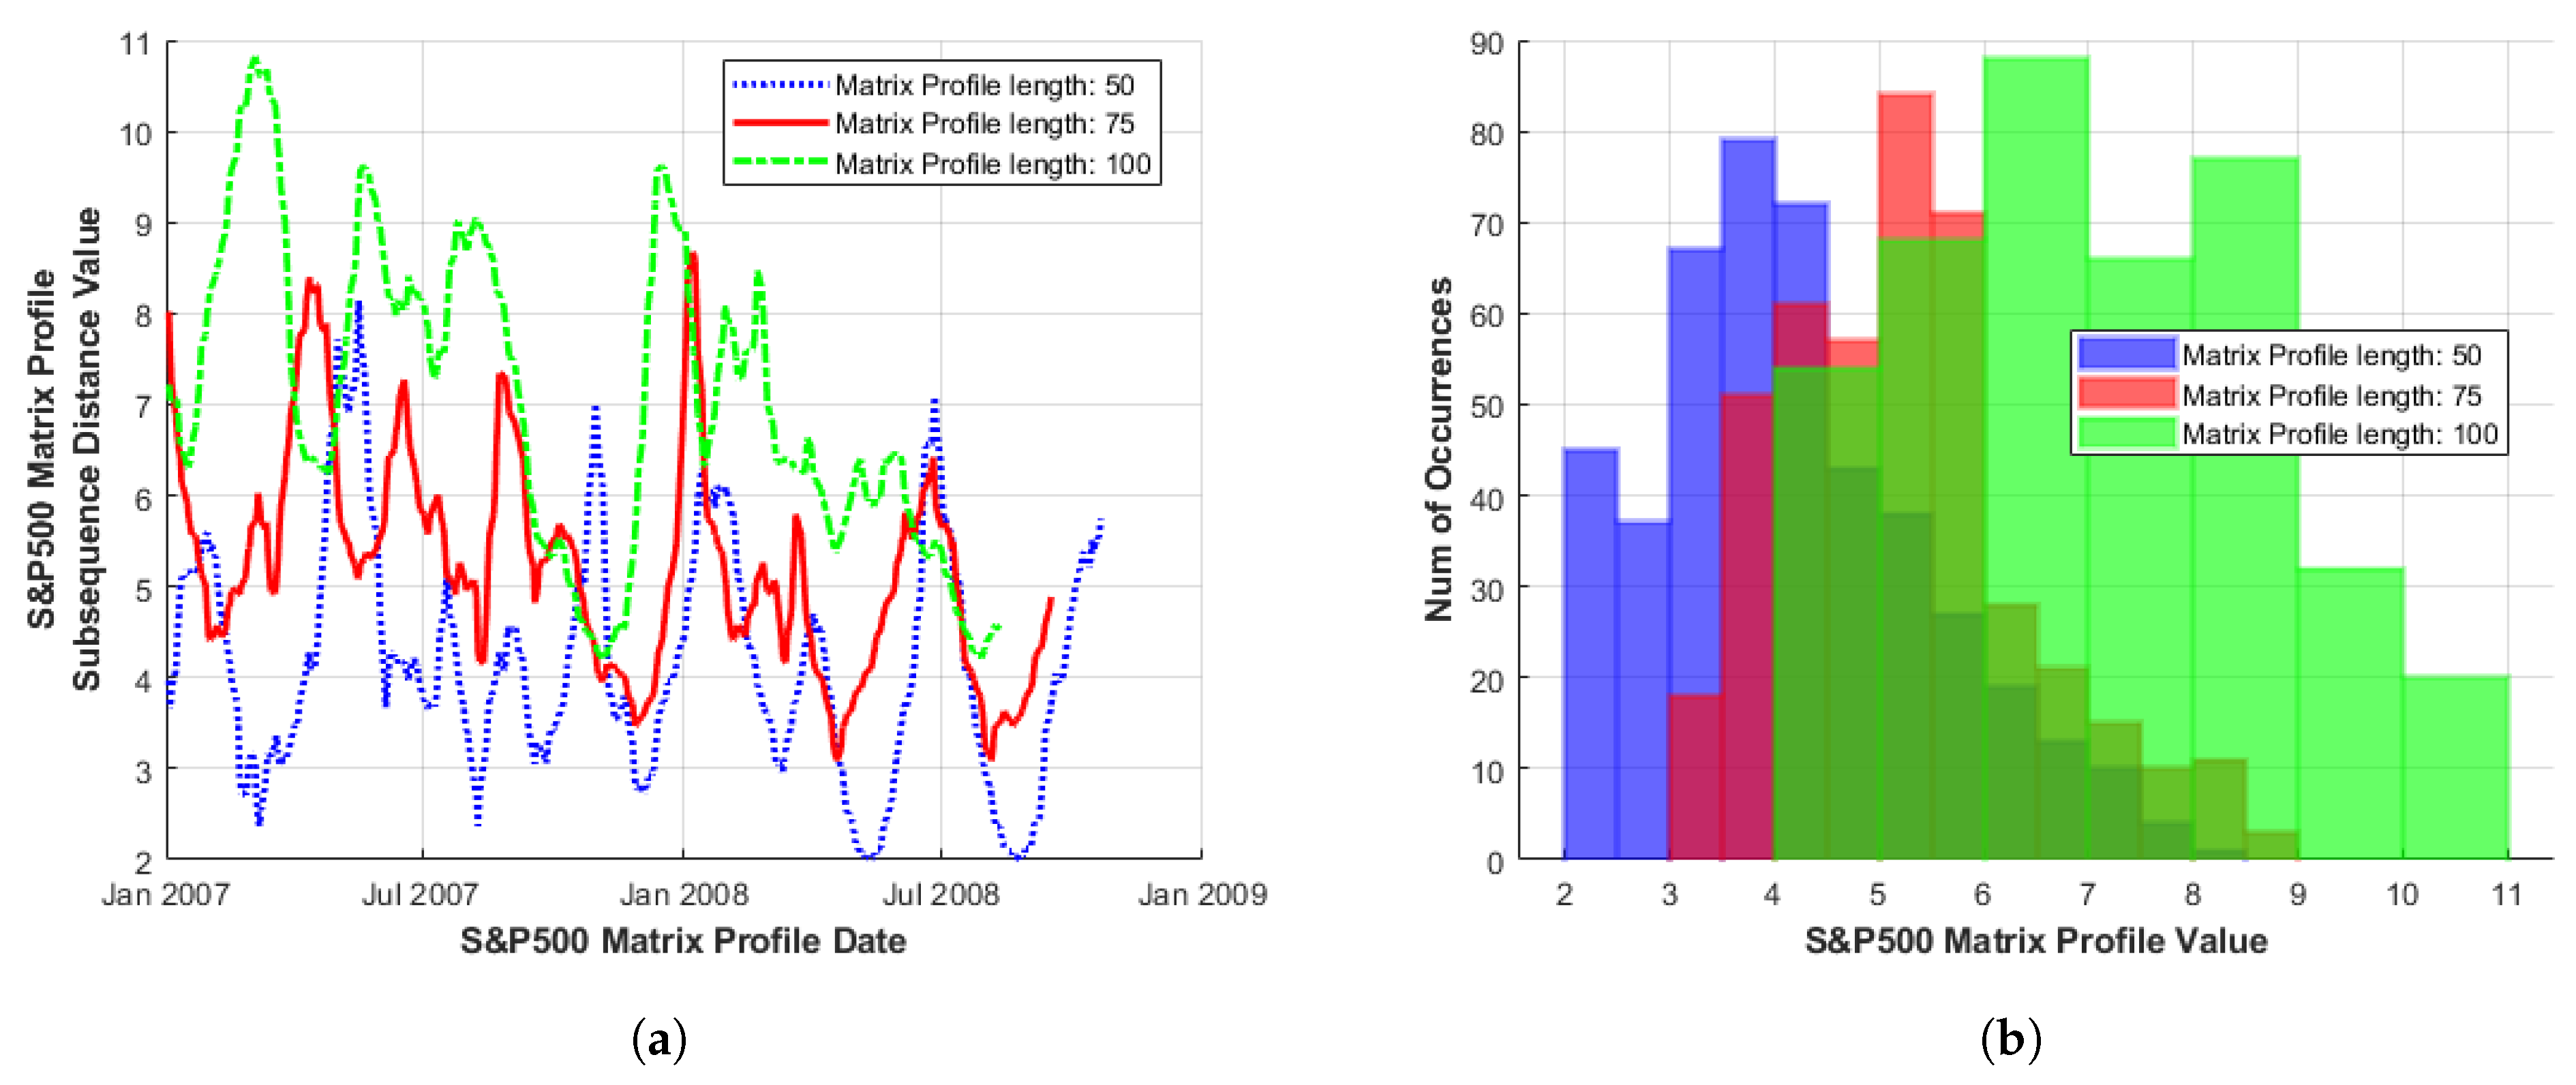
As the MP sub-sequence length increases, the average MP distance value for that sub-sequence length also appears to increase, indicating a less-exact match (in terms of average Z-normalised Euclidean distance) over the entire length of the MP (Figure 4a). This result is intuitive, as the shorter the sub-sequence length is, the more readily it is matched [2].
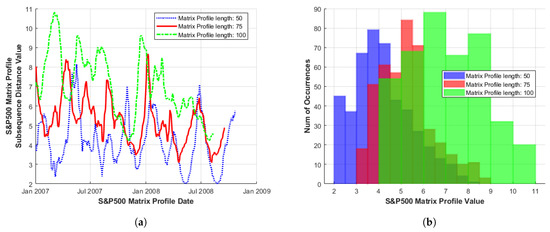
Figure 4.
(a) MP and (b) histogram of the S&P500 series. Illustrated over increasing sub-sequence length, during the period January 2007–January 2009.
As the MP sub-sequence length is increased, the frequencies of MP motif match and discord values correspondingly decrease, (Figure 4a). However, where found, these large MP distance values (occurring at approximately the same index in MP plots of shorter and longer sub-sequence lengths) may indicate the existence of longer term trends in the data, despite more volatile behaviour being observed at shorter MP sub-sequence lengths.
It should be noted that an increase in MP sub-sequence length does not necessarily result in a clearer, ‘less noisy’ MP structure (particularly for the multi-variate cases examined, as shown in Section 3.3 and Section 3.4) in individual series. Hence, both a range of sub-sequence lengths and MP distance minima are needed for balanced interpretation.
This is further illustrated by a histogram plot of the same MP data in Figure 4b. The entire histogram (of overall distance to repeats) was shifted to the right (for given sub-sequence length). The global behaviour of the MP can be linked to the distributional morphing. The shorter MP length (of 50) here with a higher frequency of occurrence of matches/discords, is closer to the Normal (or Gaussian) form. For higher sub-sequence length (of 100 here) the distribution is flatter, indicating larger variation in the motif and discord distance values. However, an examination of detailed motif shape in these longer sequences may prevent over-reliance on short-term volatility, while capturing longer-term patterns of growth or stability, with a corresponding reduction in transaction costs.
The MP distance histogram also highlights the fat-tailed distribution of many financial market series data, (where a right-skew indicates a higher proportion of discords and a left-skew indicates a higher proportion of motifs). Figure 4a shows MP line series plots of increasing sub-sequence length while Figure 4b illustrates their corresponding histogram values. These plots are based upon S&P500 [17] and share value data, again, for the time window of January 2007–January 2009.
The same generalised behaviour as that of Figure 4 is observed in Figure 5 for Microsoft [20] series data; however, in this case, with a higher proportion of increased MP distance values (or discords) as indicated by a skewed distribution to the right. This occurs for all MP sub-sequence lengths examined to date and indicates that series behaviour is consistent over longer timescales.
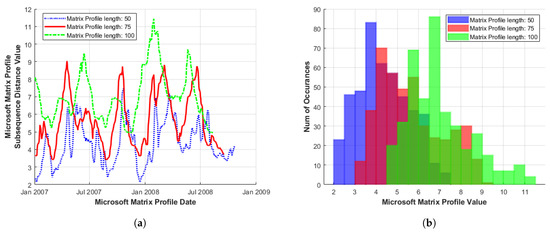
Figure 5.
(a) MP and (b) histogram of the Microsoft series. Illustrated over increasing sub-sequence length, during the period January 2007–January 2009.
3.3. Multi-Variate Series
In an attempt to characterise wider market behaviour, the MP single-series approach must be expanded to multi-variate series. Applications for finance include the investigation of multiple companies within the same market sector, as opposed to an individual stock or index considered independently.
3.3.1. Single Sector
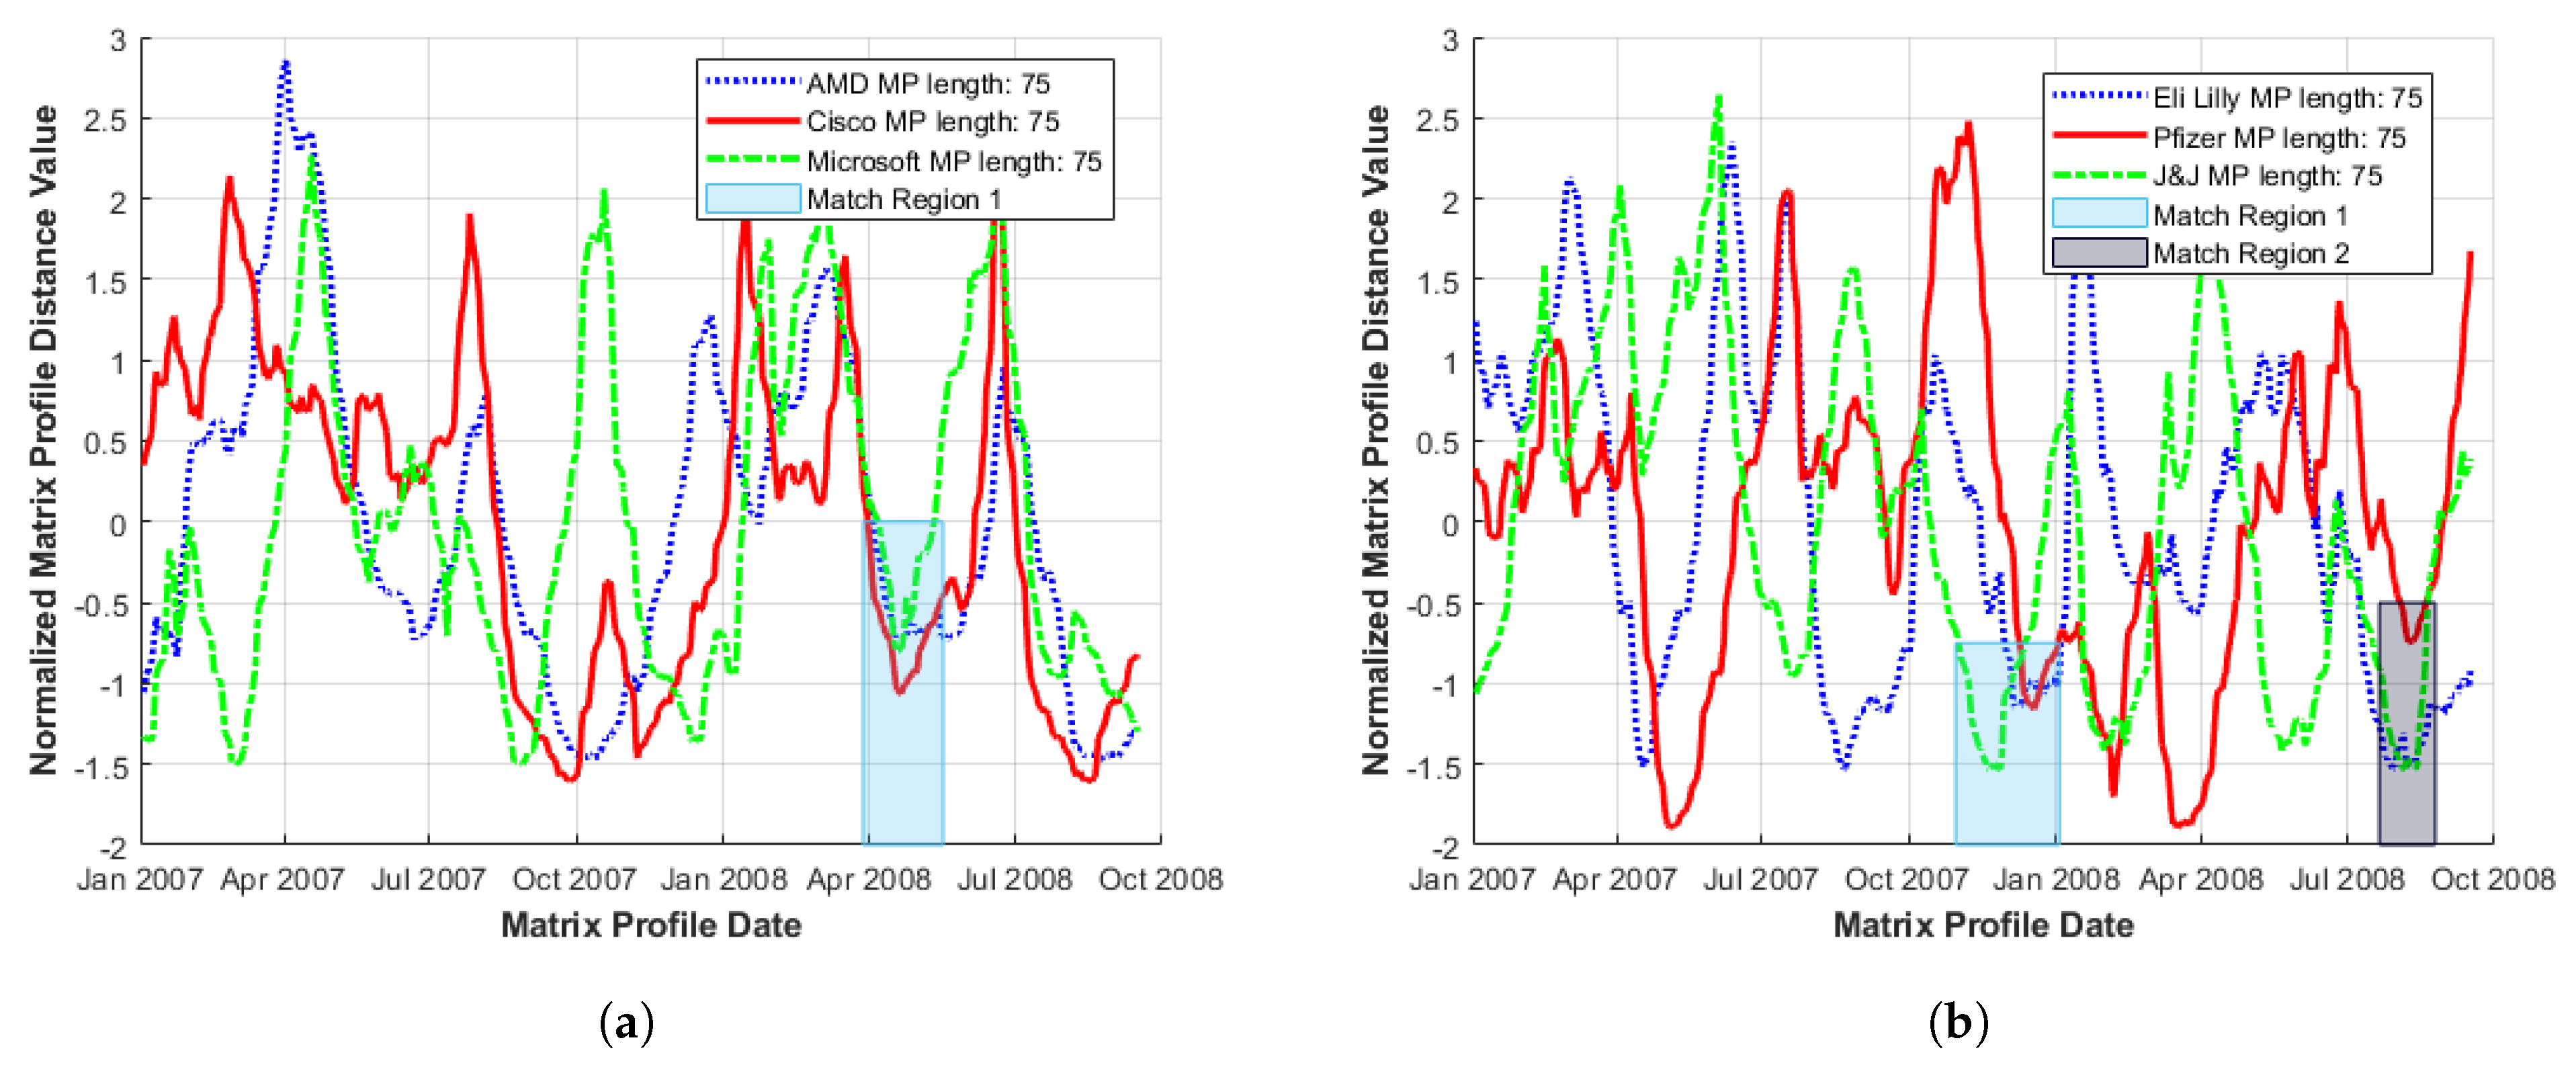
Figure 6 illustrates the MP plot of stock series for influential companies within (a) technology and (b) pharmaceutical sectors chosen at random from several top 10 lists based on market cap, percentage annual return and market value [21,22]. Although fluctuations in amplitude are large, coherent movements at lower MP distances are observed over short time-frames, (i.e., local minima regions correspond across series).

Figure 6.
Sample set of normalised Matrix Profiles across individual market sectors: (a) tech sector; and (b) pharmaceutical. Localised MP minima coherence are indicated by coloured rectangles. During the period January 2007–January 2009.
Clearly, both the occurrence and values of these local MP minima over the shortest timeframe are of interest for motif identification and verification. The main considerations are (i) the time duration to when similar behaviour is repeated (i.e., when a match occurs); and (ii) distance range (indicating how close a match it is). Thus, a visual choice of the point at which a generalised local minima region occurs in a multi-variate MP series plot is made based upon obtaining the best combination of local minima over the shortest timeframe and restricting the MP minima spread to be as low as possible. We consider these to be match regions as highlighted by shaded areas in Figure 6a,b for example.
Occurrence of a motif within an identified match region may be slightly shifted from series to series, either with respect to the starting index or by extension, date. In consequence, plots can be constructed to start at a specific index (where a given series feature may slightly overlap with a similar or matching feature in another series) or at a specific date, where shifts between series may be clarified.
It should be noted that, due to total MP series variance and the fact that areas of interest are small compared to the overall plot size involved, visual MP distance plot analysis is a limited technique. These plots become harder to interpret and sectors of interest more challenging to identify as multiple series are added, so that typically, only a small series set is examined. However, consistent behaviours such as reduced volatility, less precise matching (increased MP distance) and better-defined MP structure are generally observed for long as well as shorter sub-sequence lengths.
3.3.2. Multi Sector
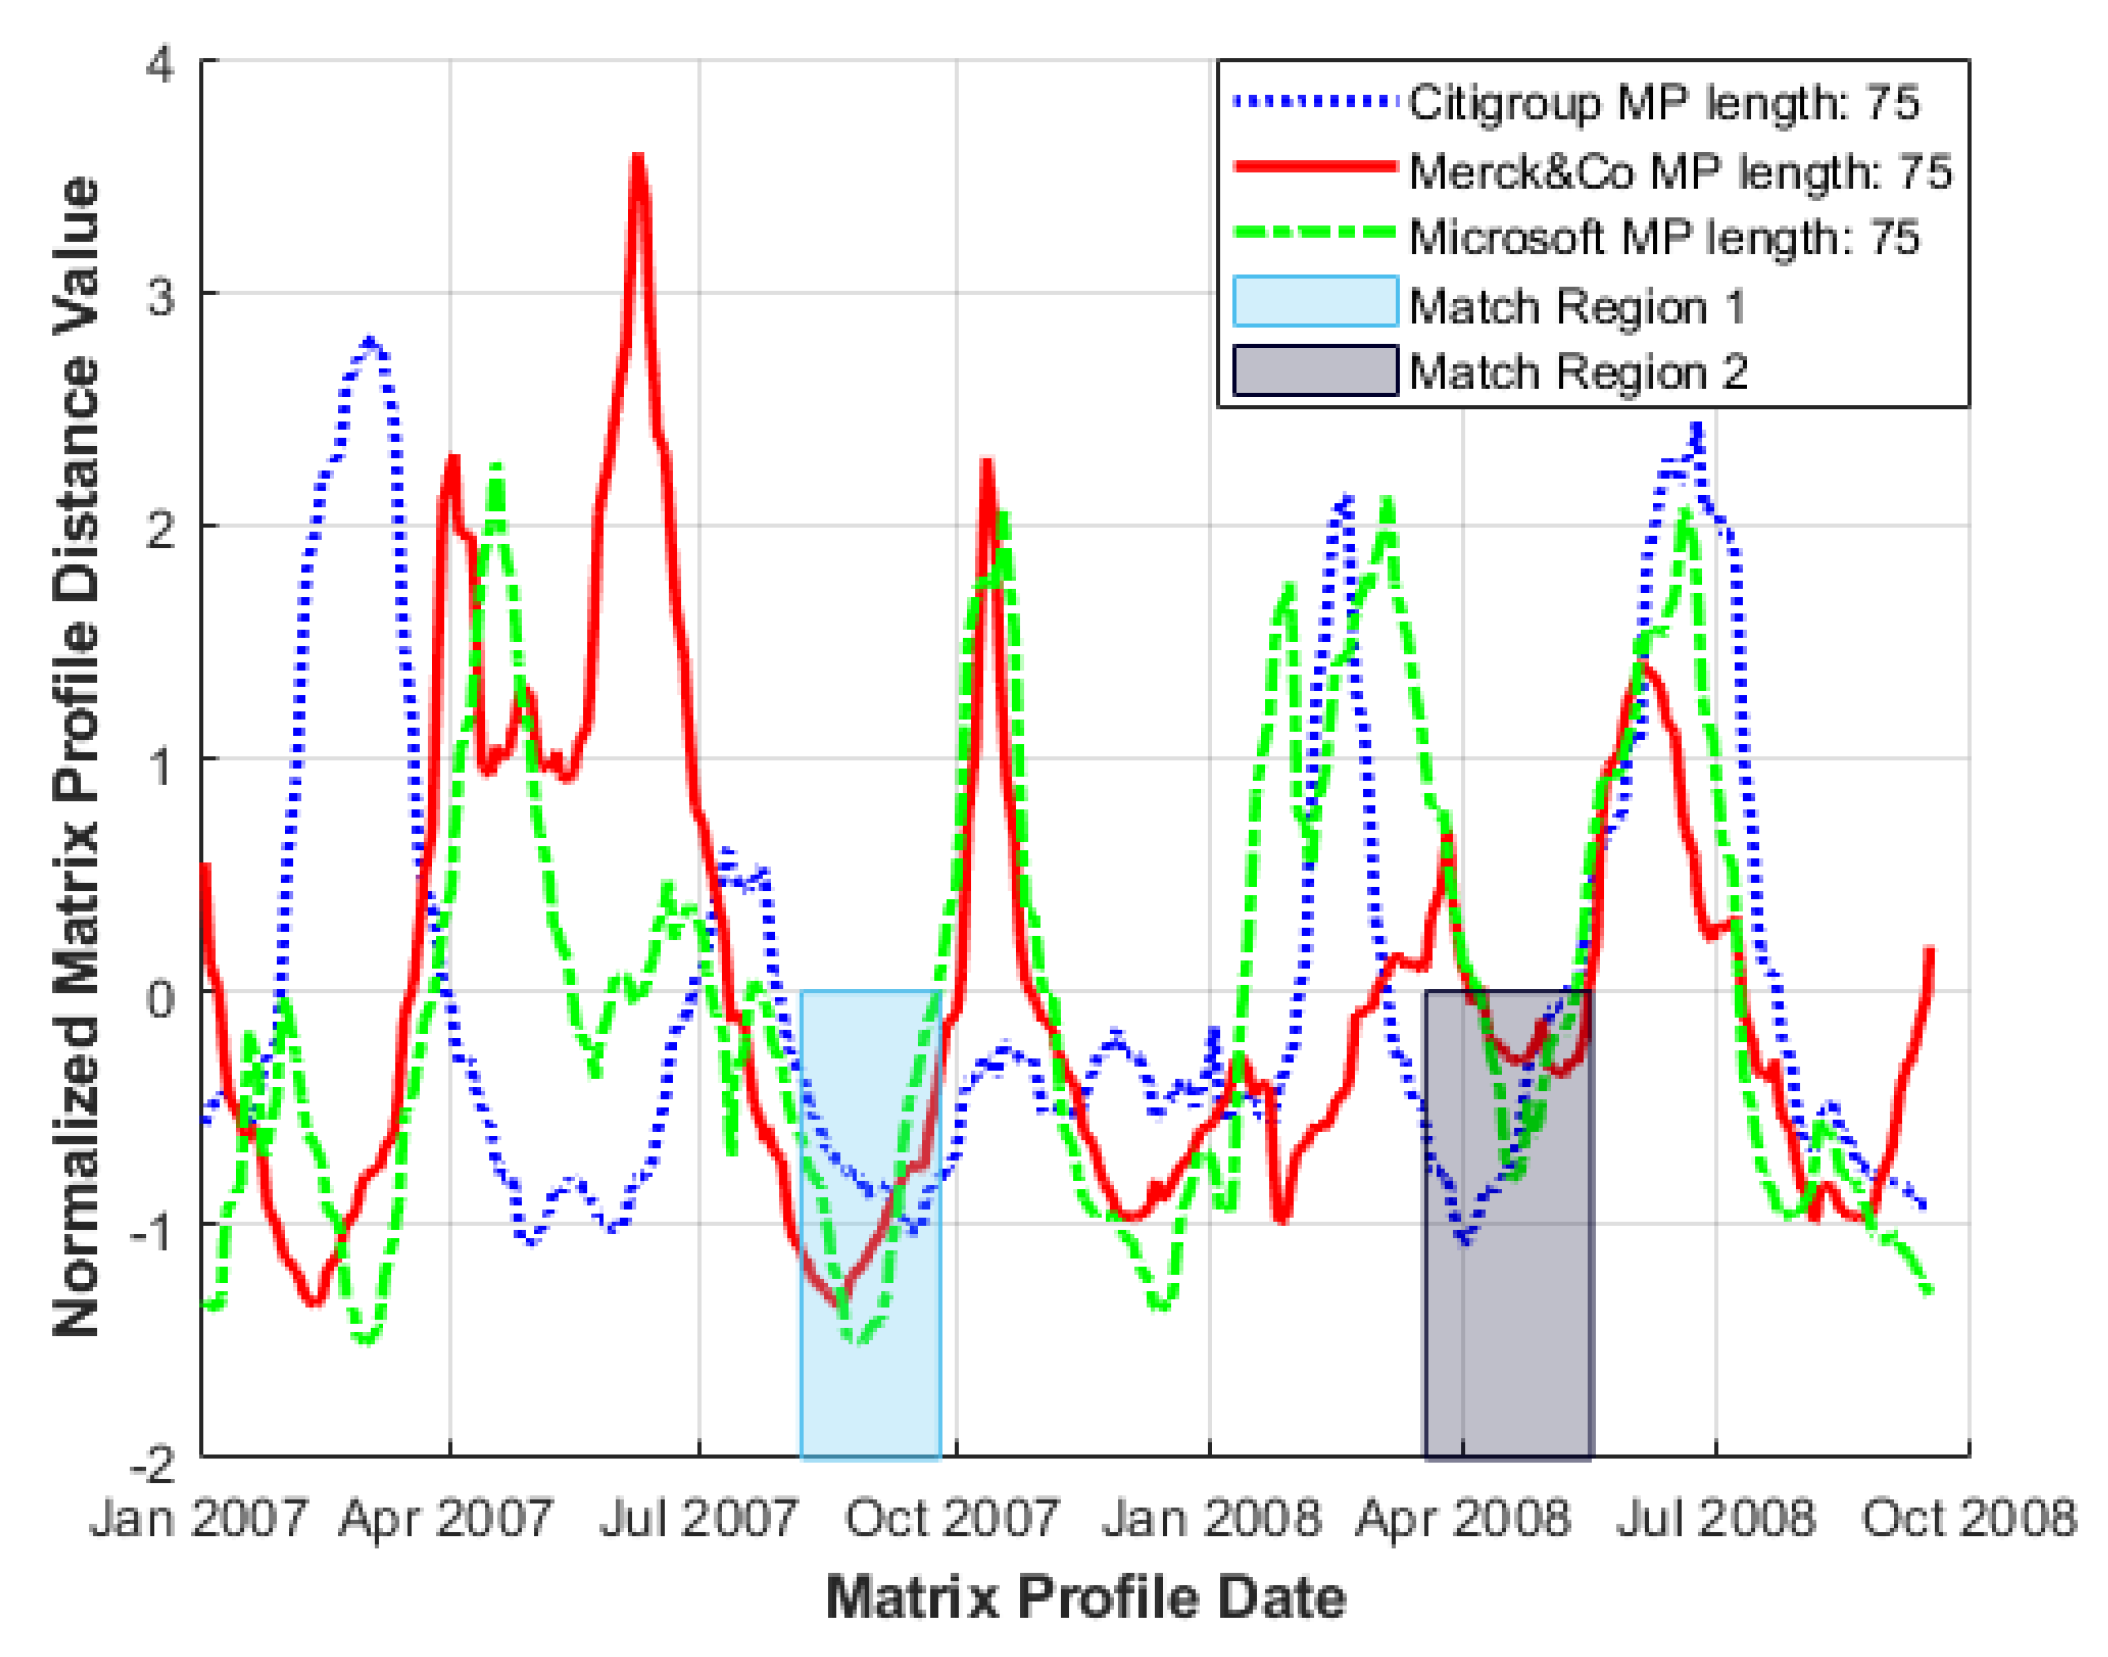
Expanding the approach to multiple sectors (including indexes) can be useful in illustrating more generalised market behaviour where, for example, large events such as global shocks can generate coherence that is reflected in the behaviour of the corresponding MPs. To illustrate this, a range of leading sectoral companies were chosen, again from several top 10 lists based on Market Cap, percentage annual return and market value. These sectors span information technology (Microsoft), the pharmaceutical industry (Merck&Co) and the finance sector (Citigroup) [21,22,23]. MP line plots, constructed for the same time window of January 2007–January 2009, are shown in Figure 7, together with coincident local MP minima that occur within narrower time intervals (shaded match regions).

Figure 7.
Sample set of normalised Matrix Profiles across multiple market sectors, where local MP minima coherence is indicated by coloured rectangles. January 2007–January 2009.
3.4. Stocks within an Index
Matrix Profile plots are also useful in examining the influence of individual stock series on the index to which these contribute. Comparison of MP index series against several MP plots of individual companies (chosen to cover a wide range of sectors trading within that index) serves to characterise the convergence of lower MP distance values (Figure 8).
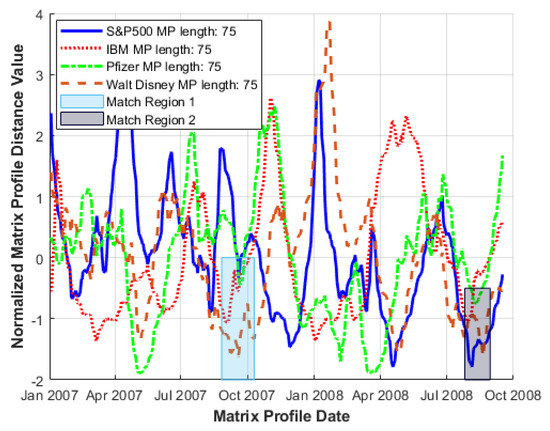
Within the time window examined, short periods occur where localised MP minima coincide with those of the S&P500, suggesting coherent behaviour; (for raw data analysis, see Section 3.5). Table 2, moreover, shows the shift in location (and by extension timing) of MP minima occurrence within these series.
Table 2.
Identified MP minima dates and indexes of match regions 1 and 2 (i.e., localised MP minima coherence) as highlighted in Figure 8.
For some series, the MP minima occur before the S&P500 minima, indicating a leading influence upon the index, while others are identified shortly afterwards, indicating that underlying series subsequently reflect index movement. Only three sub-series are currently included of course so, given that other stock series may be influential, a comprehensive analysis would need to consider additional index components and combinations thereof.
3.5. Reviewing the Raw Data
In the multi-variate cases examined thus far, a low MP value at approximately the same index as for multiple series is taken to be a good indication of similar behaviour. Strictly, however, the MP algorithm in its current form examines each series independently so that an extreme MP value may indicate either a close match (motif) or mismatch (discord) within a single series. For example, series X and Y may both have a low MP value, coinciding at index x, indicating two matches (one within each series) but these are independent, so that event type motif shapes may differ. MP plots for several series indicate regions of possible consistency, so for real behaviour to be characterised, event types in the raw series must be related to MP matches.
A motif as a repeated identifiable sub-sequence has a minimum of two parts, namely the initial sequence (as indicated by the index of the localised MP minimum) and the corresponding matching sequence obtained from the MPI (indicating the start point of the nearest neighbour sub-sequence). Figure 3b illustrates the two parts of a sample classic motif of the S&P500 series found by locating low MP distance values in the time window of January 2007–January 2009. However, in the multi-variate case considered here, only one subsection (or motif part) per series is shown for clarity.
The two complementary approaches of the analyses consider: (1) nature of the behaviour of the sub-sequences (indicated by shape), i.e., event type, and (2) timing. Of interest, with respect to (1) for a set of sub-sequences considered in isolation, is whether such events match in terms of length, magnitude and location. Alternatively, sub-sequences may exhibit amplification or damping over an extended period. In terms of (2), interest centres on whether a motif sub-sequence leads, lags or coincides with other sub-sequences in terms of event timing.
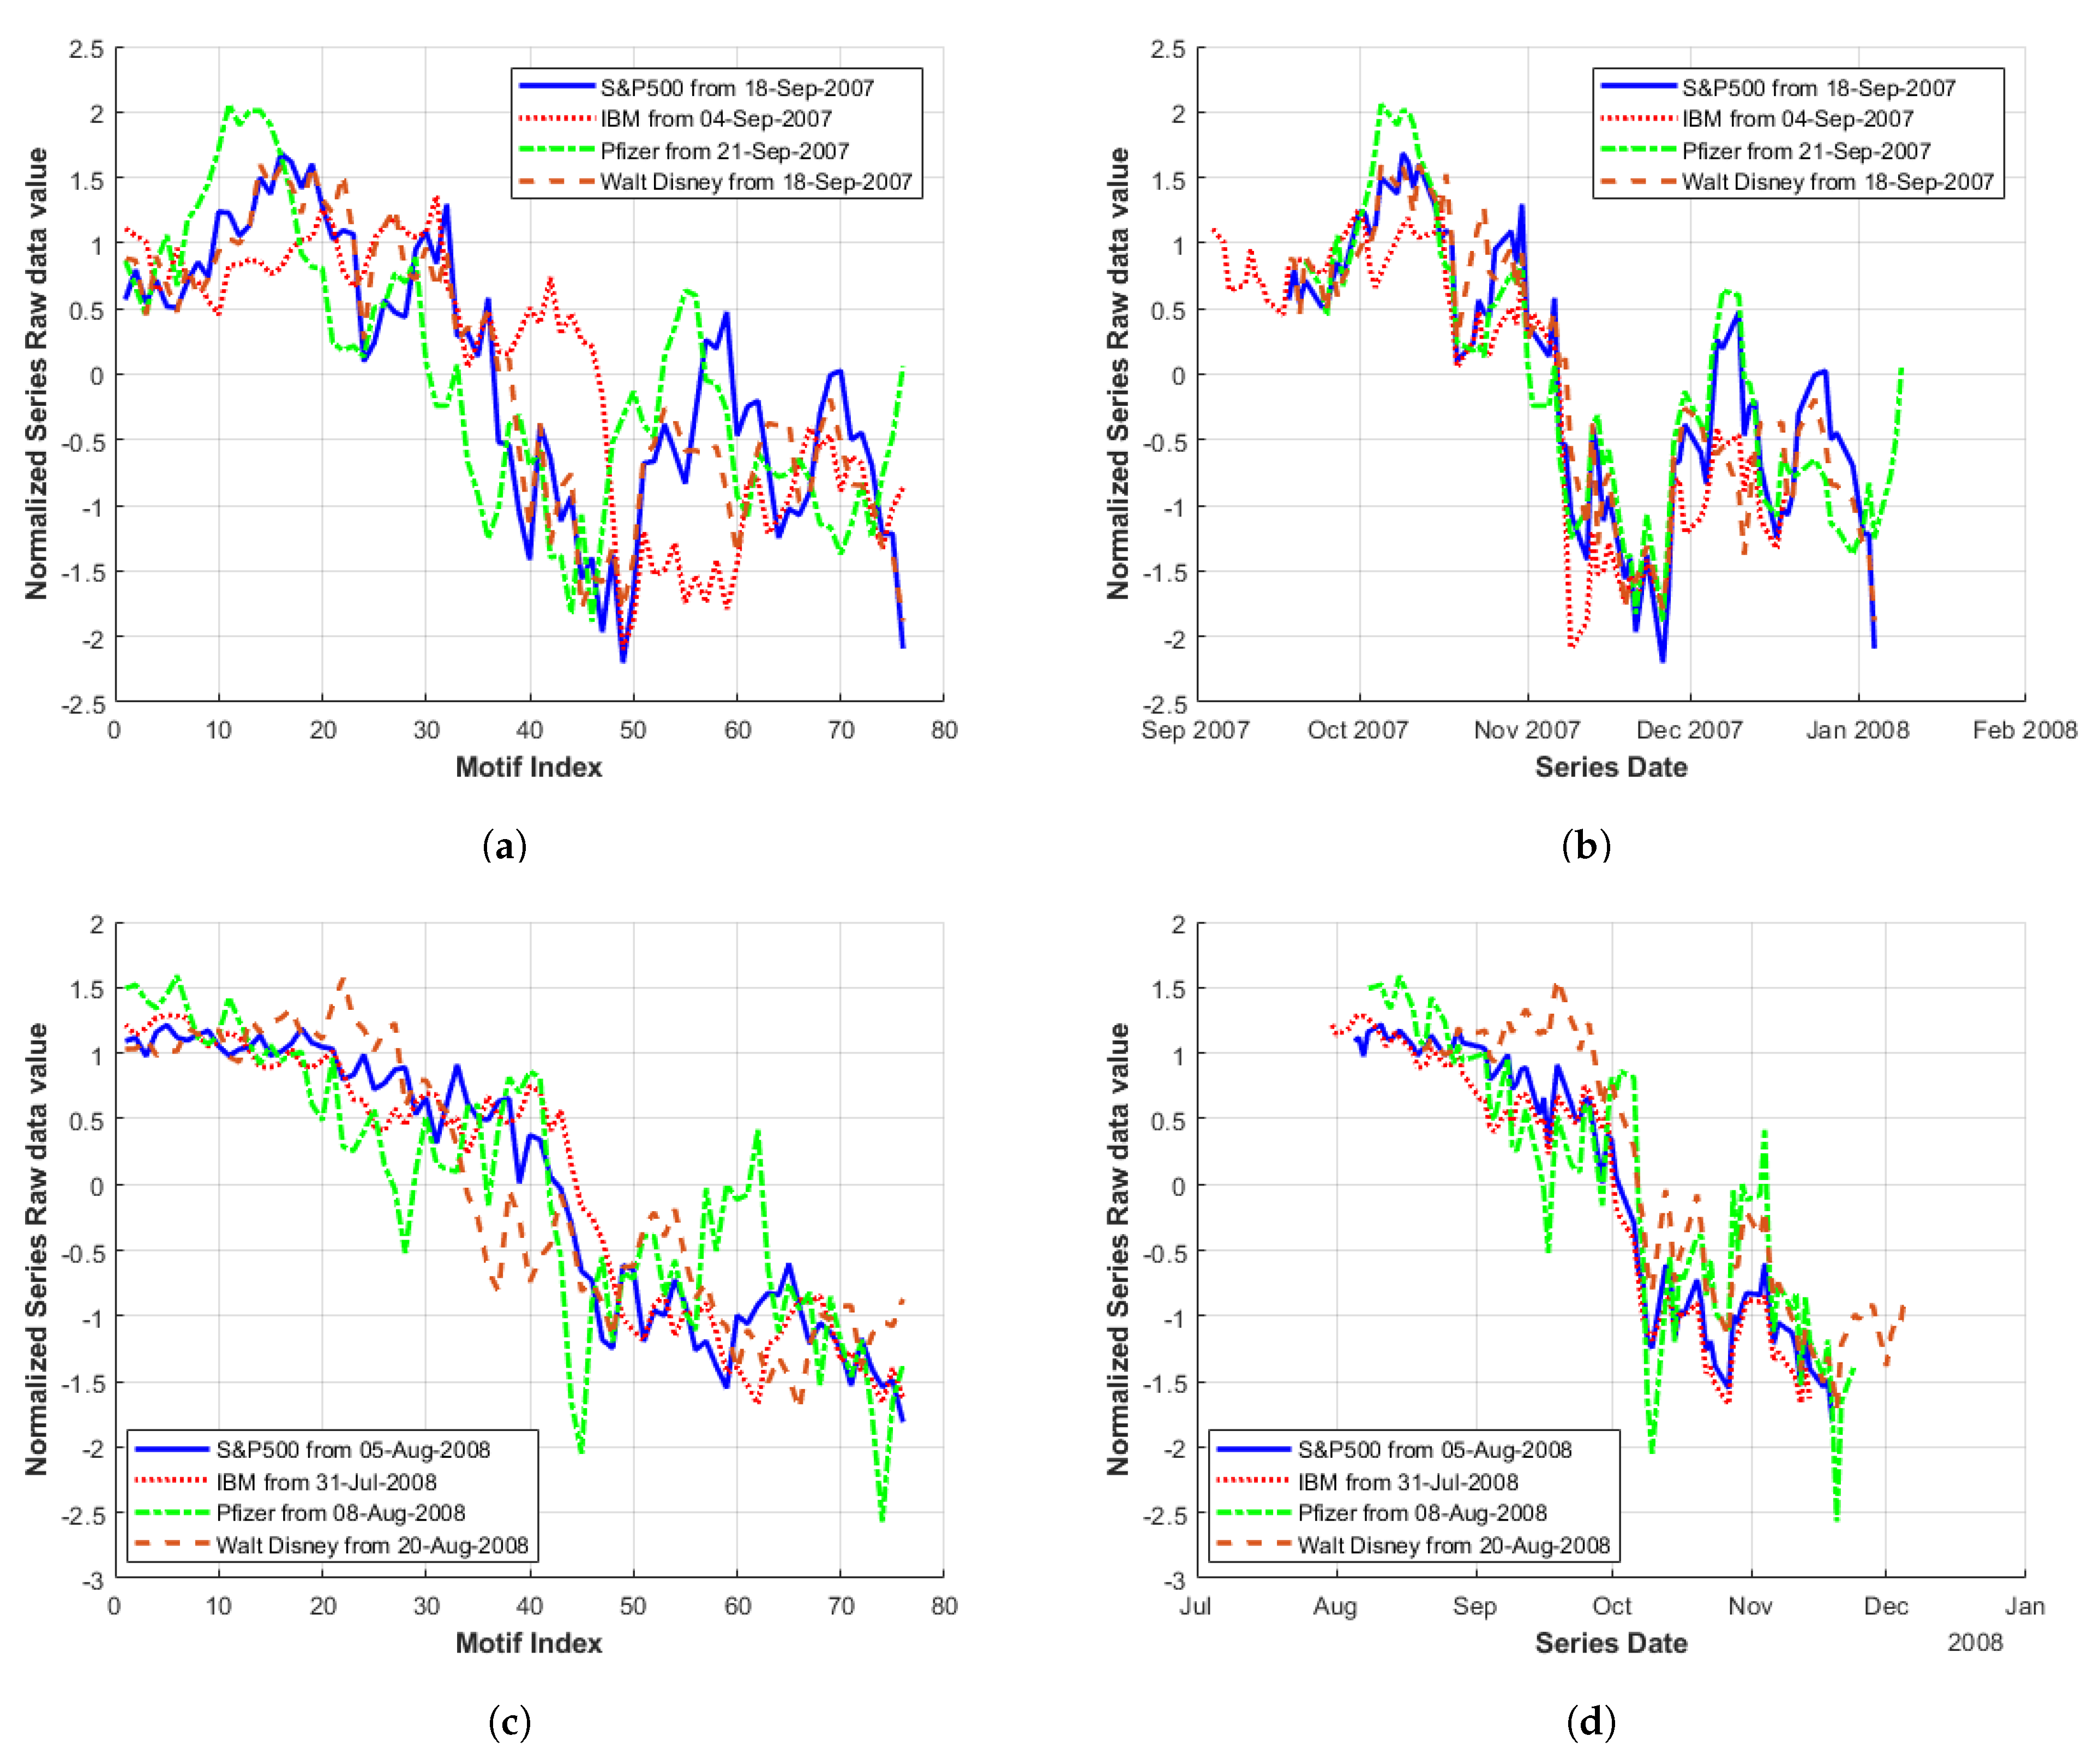
Underlying motif sub-sequences in the original series of the MP plots (Figure 8) exhibit localised MP minima of index-contributing stocks across multiple market sectors. In Figure 9a,c, the motif sequences for each series are plotted according to the motif sub-sequence index (i.e., overlapping). Again, illustrative of similar behaviour (in terms of shape), a large drop in value occurs approximately halfway through each of the motif sub-sequences. In Figure 9a, it initially appears that both the IBM (red) and Pfizer (green) series are reacting at a later point in time to the S&P500 (blue series). However, when plotted according to date (Figure 9b), it can be seen that the large drop in value actually occurs over the same time window of November 6th–12th 2007 for all series.
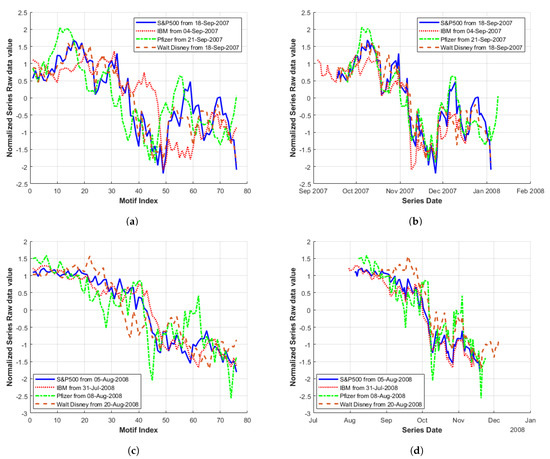
Figure 9.
Motif of stocks within an index: i.e., original data sub-sequences with starting indexes obtained from MP minima located in Match Regions 1 and 2 in Figure 8: (a) Match Region 1 overlapping; (b) Match Region 1 by date; (c) Match Region 2 overlapping; and (d) Match Region 2 by date.
To place this in context, this corresponds to a period when a deepening liquidity crisis sparked by issues in the American sub-prime property market [24] began to accelerate globally (as illustrated by the run on the Northern Rock bank in England in September 2007). Despite initial action by the FED over 2007 to increase liquidity in short-term money markets through larger open market operation interventions (as described [25]), the peak of market values was reached in October 2007. However, fears of losses at Citigroup in combination with poor market sentiment prompted a more generalised sell-off (as reflected in Figure 9a,b).
Similar behaviour is observed in Figure 9c,d, in this case with the Pfizer and Walt Disney (brown) series reacting slightly after the S&P500 (during the period of 1–10 October 2008). This corresponds to the US Congress opening its first hearing on the growing financial crisis when stocks then tumbled further (the Dow Jones index dropped below 10,000 for the first time in 4 years [26]), coinciding with the realisation by investors that the credit crisis was spreading around the globe and the recent (29 September) rejection by the US Congress of a proposed USD 700 billion bailout plan would not stabilise the situation. However, as the country’s financial system continued to deteriorate, several representatives changed their minds and the legislation was signed off on 3 October 2008 [27]. Overall coherent behaviour was observed for the S&P500 series and individual stocks, particularly when plotted by date (as initial lag between series is no longer evident).
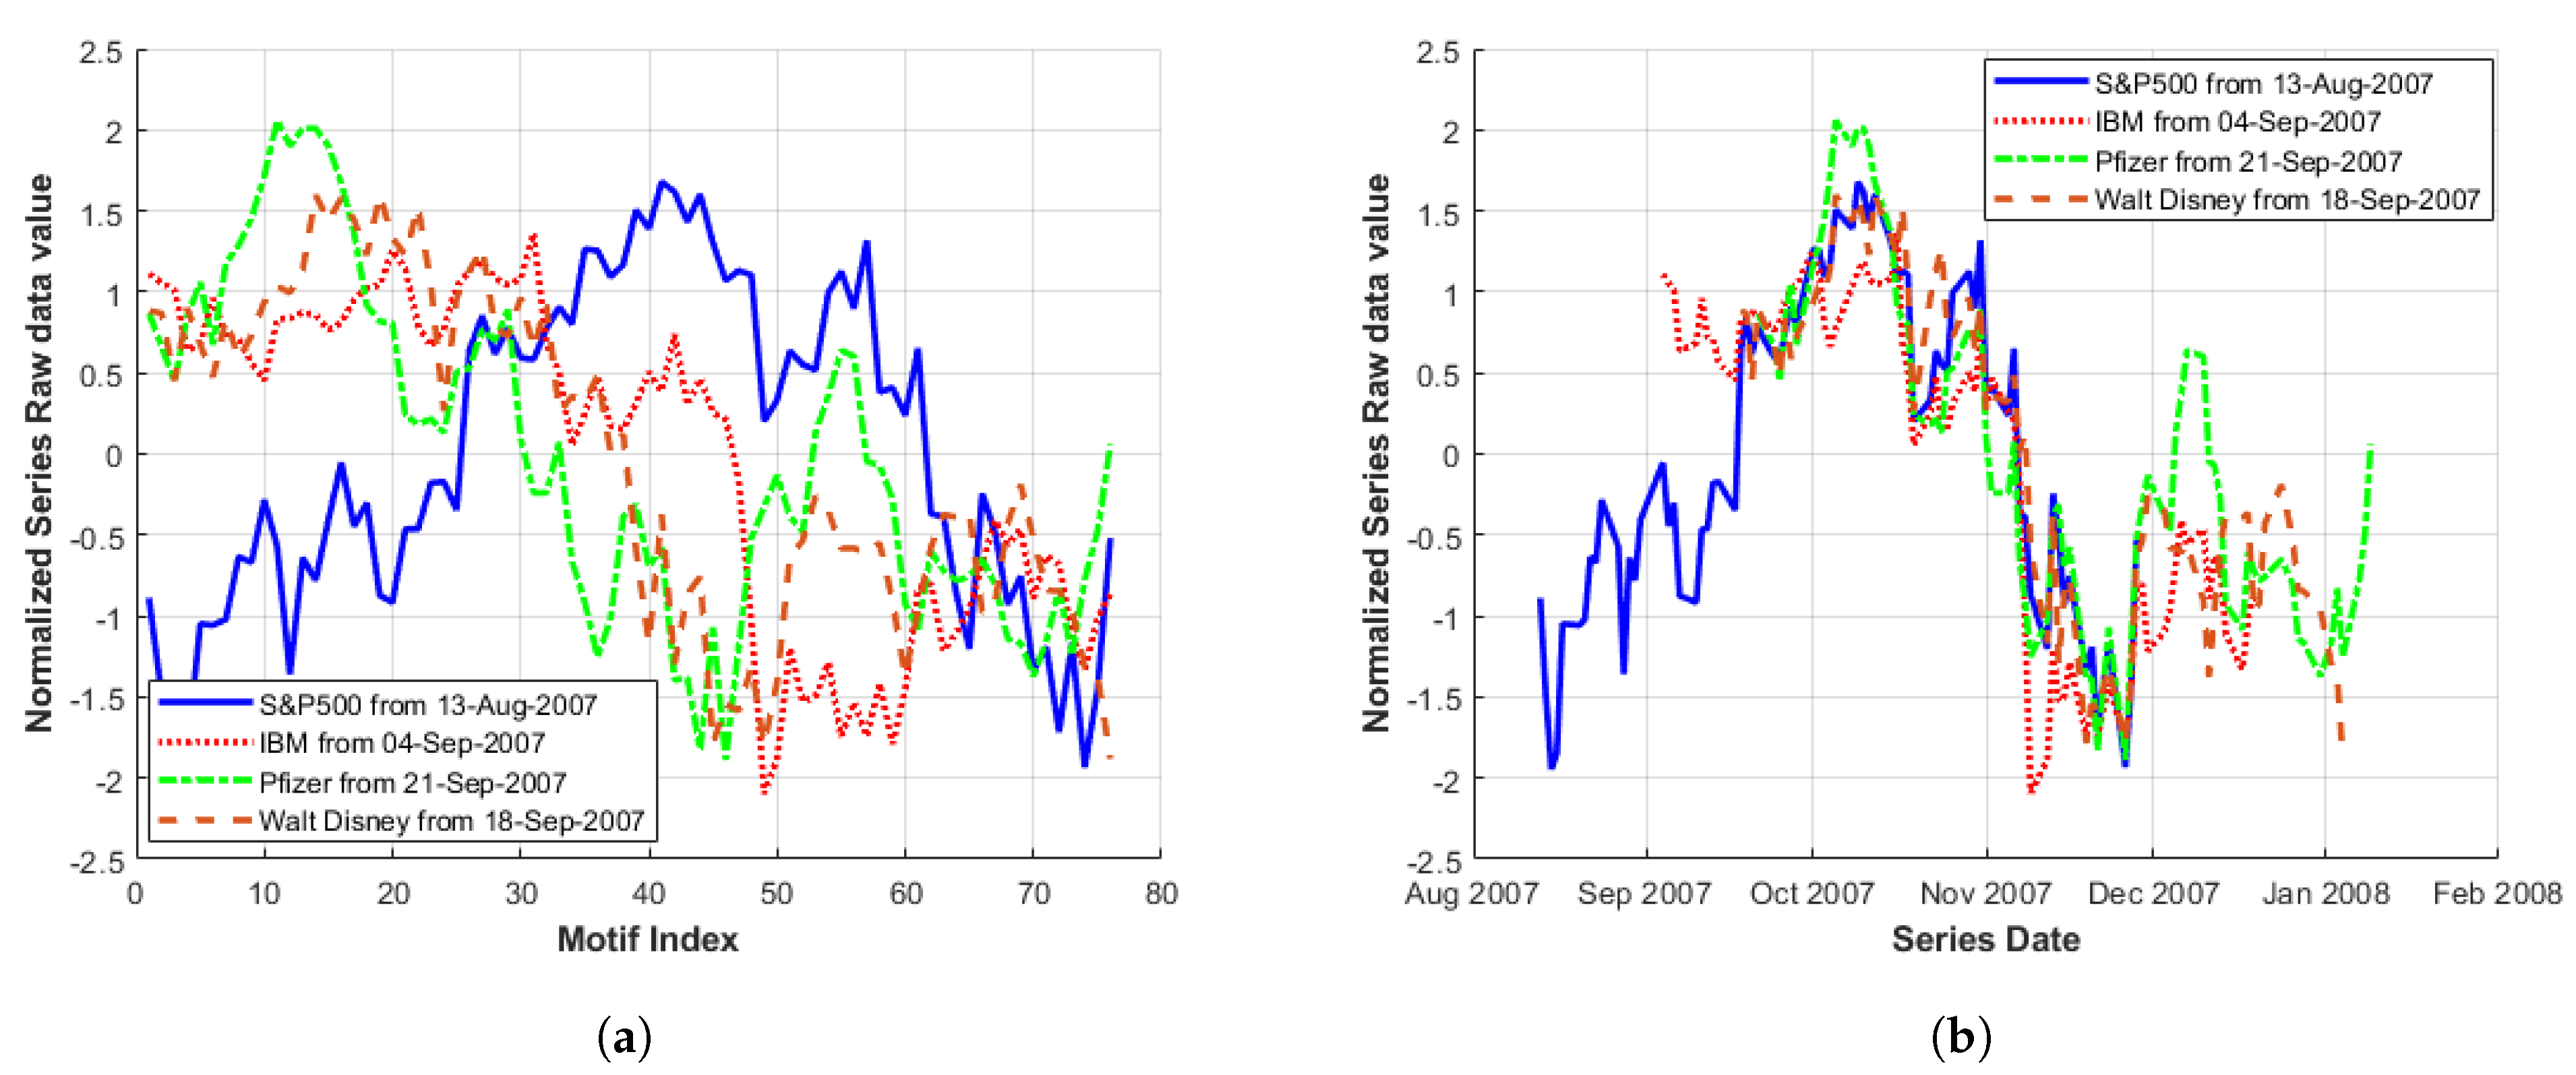
When examining Figure 8 to identify suitable lowest MP minima match regions, an alternative lower index value of the S&P500 MP than was initially chosen for Match Region 1 is also available. This gives a reduced MP value (i.e., a closer match in terms of Euclidean distance to some other point in the S&P500 series). Incorporating this alternative S&P500 MP minima value (154) occurring on 13 August 2007 into Figure 9a,b gives the plots displayed in Figure 10. Plotting according to date (Figure 10b), the S&P500 series corresponds quite well with the remaining series in the region where dates overlap. However, Figure 10a illustrates that event type, (when considered as motif shape), does significantly differ between the series in question.

Figure 10.
Motif of stocks within an index, i.e., original data sub-sequences with starting indexes obtained from MP minima in Figure 8 Match Region 1 (using an alternative S&P500 index). Plotted (a) overlapping; and (b) by date.
3.6. Multidimensional Analysis of a Single Stock
In addition to utilising the MP for the multi-variate analysis of separate series spanning differing market sectors, the approach can also be applied for the combination of series based upon different measures of a single company or index.
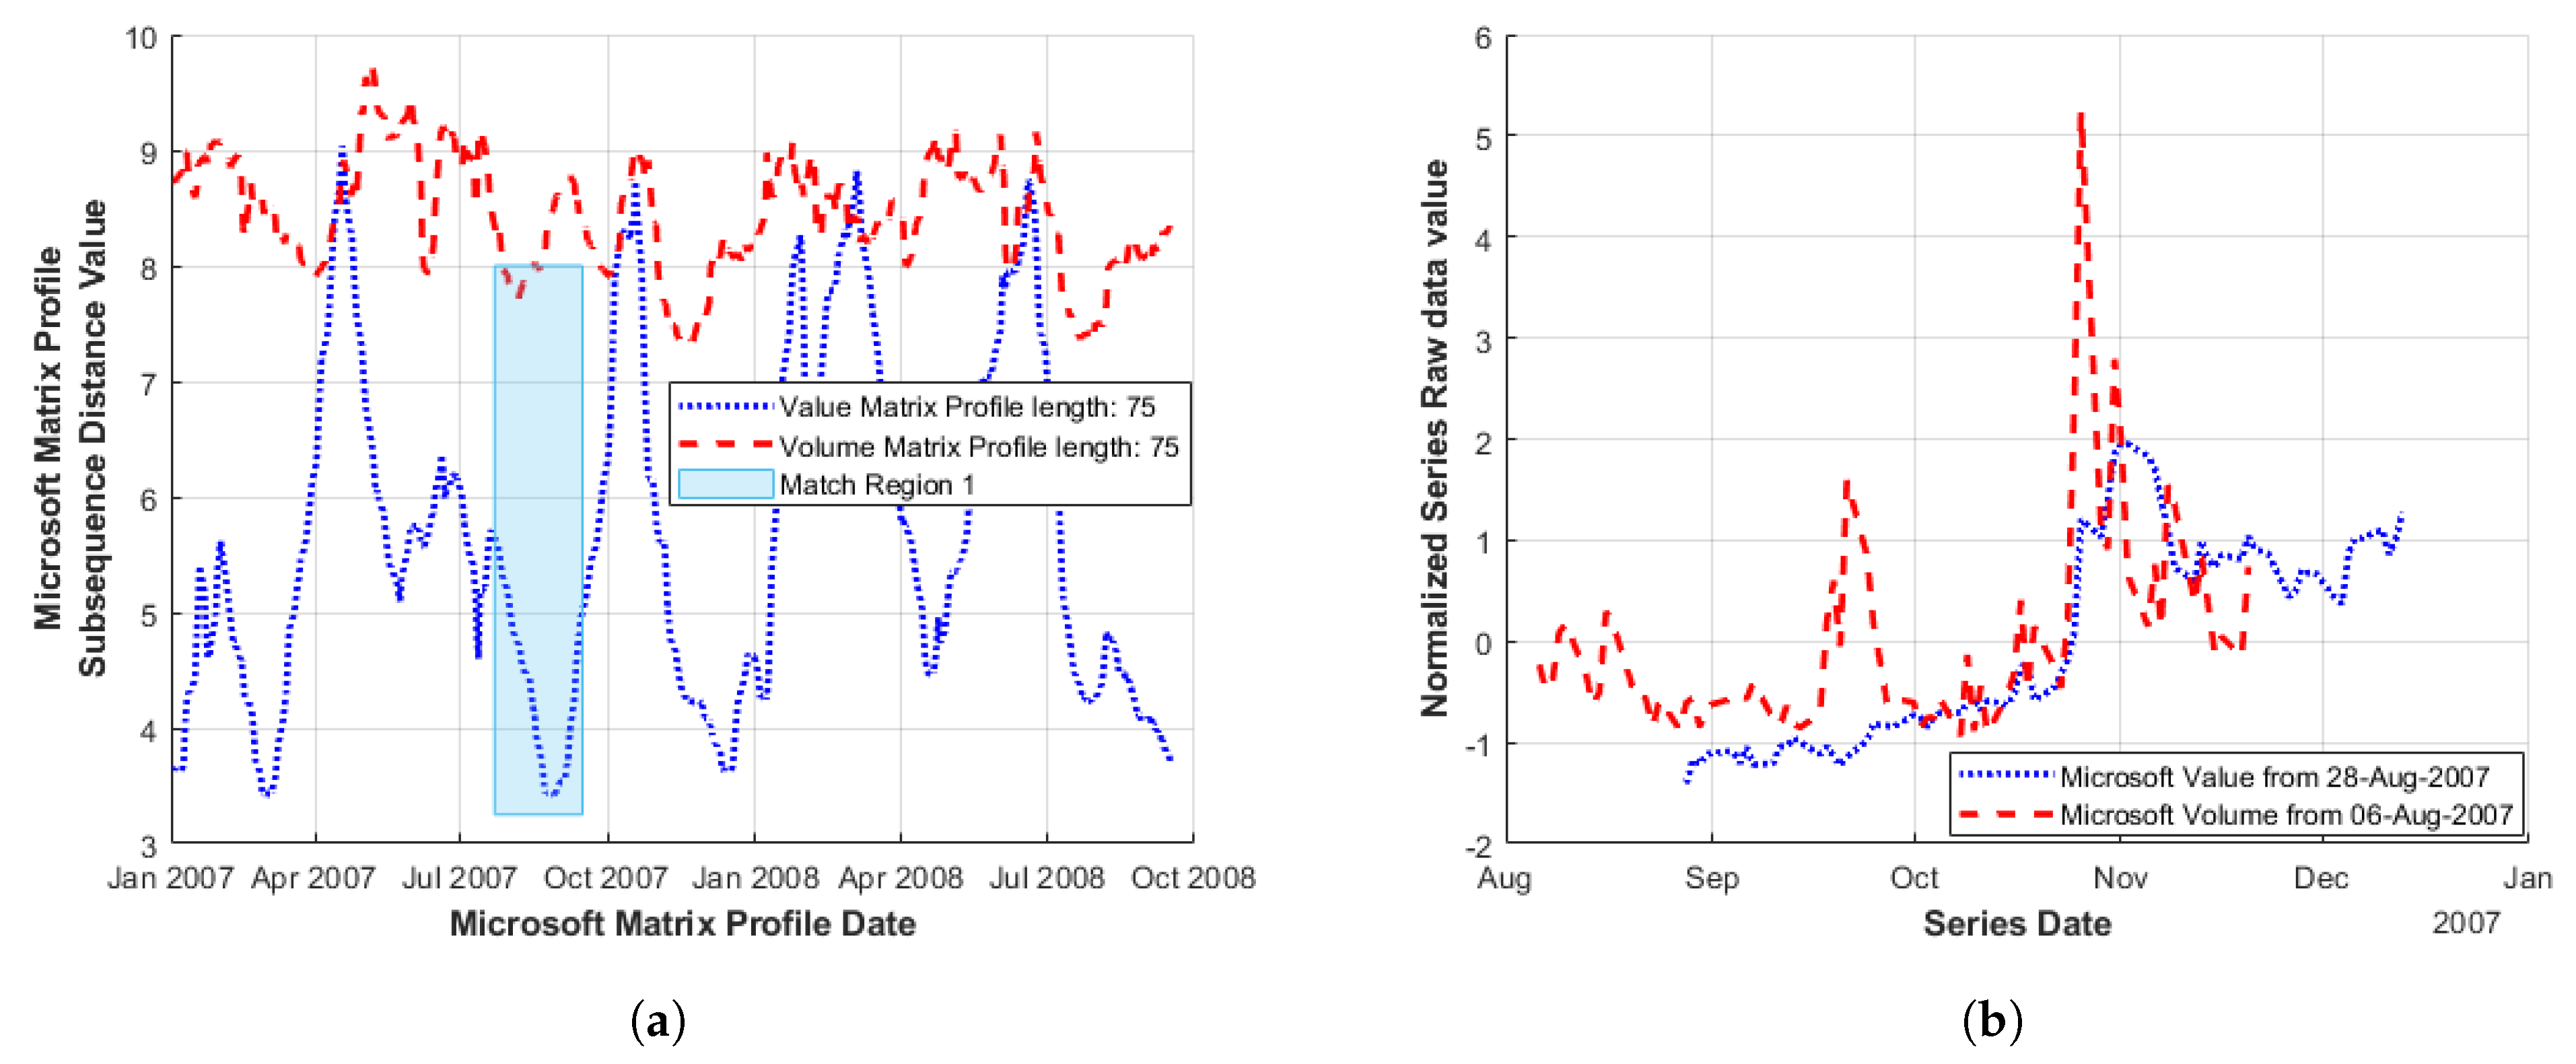
In Figure 11a, the MP in two measures of Microsoft stock (value & volume) are illustrated (again for the time window of January 2007–January 2009) [20]. A match region (co-incidence of MP minima) was identified while raw data sub-sequence values shown in Figure 11b appear to indicate a large increase in both series occurring at approximate dates (26 October 2007 for volume and 1 November for share value).
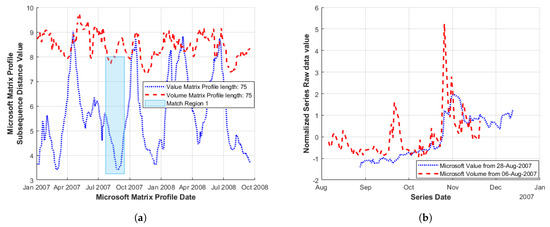
Figure 11.
Motif of differing measures of Microsoft stocks during the period of January 2007–January 2009: (a) MP Microsoft share volume and value; and (b) raw data Microsoft share volume and value based upon MP minima identified in Match Region 1.
Although both series are based upon the same stock, the previous flexibility to display raw data sub-sequences by date of the identified MP minima still applies to features identified in both series (in this case, applying to when these occur). Here, it illustrates the timing of the occurrence of features identified in one series relative to another. Figure 11b highlights the reasonable alignment for an increase in both share value and trading volume.
The examination of other combinations of commonly used company measures such as price-to-book and price-to-earnings ratios is also possible.
3.7. Motif Length Selection Considerations & Long- vs. Short-Term Behaviour
An important consideration for the selection of the motif or sub-sequence length for analysis is whether interest is focused on short- or long-term behaviour (shorter or longer motif lengths, respectively). The large number of motif locations found for shorter MP lengths can obscure particular trends, while the reduced number of motifs returned for longer lengths can facilitate the identification of extended match regions. Recent developments on the length selection process providing an illustration of the motif content (by MP length) include the SKIMP [28] algorithm.
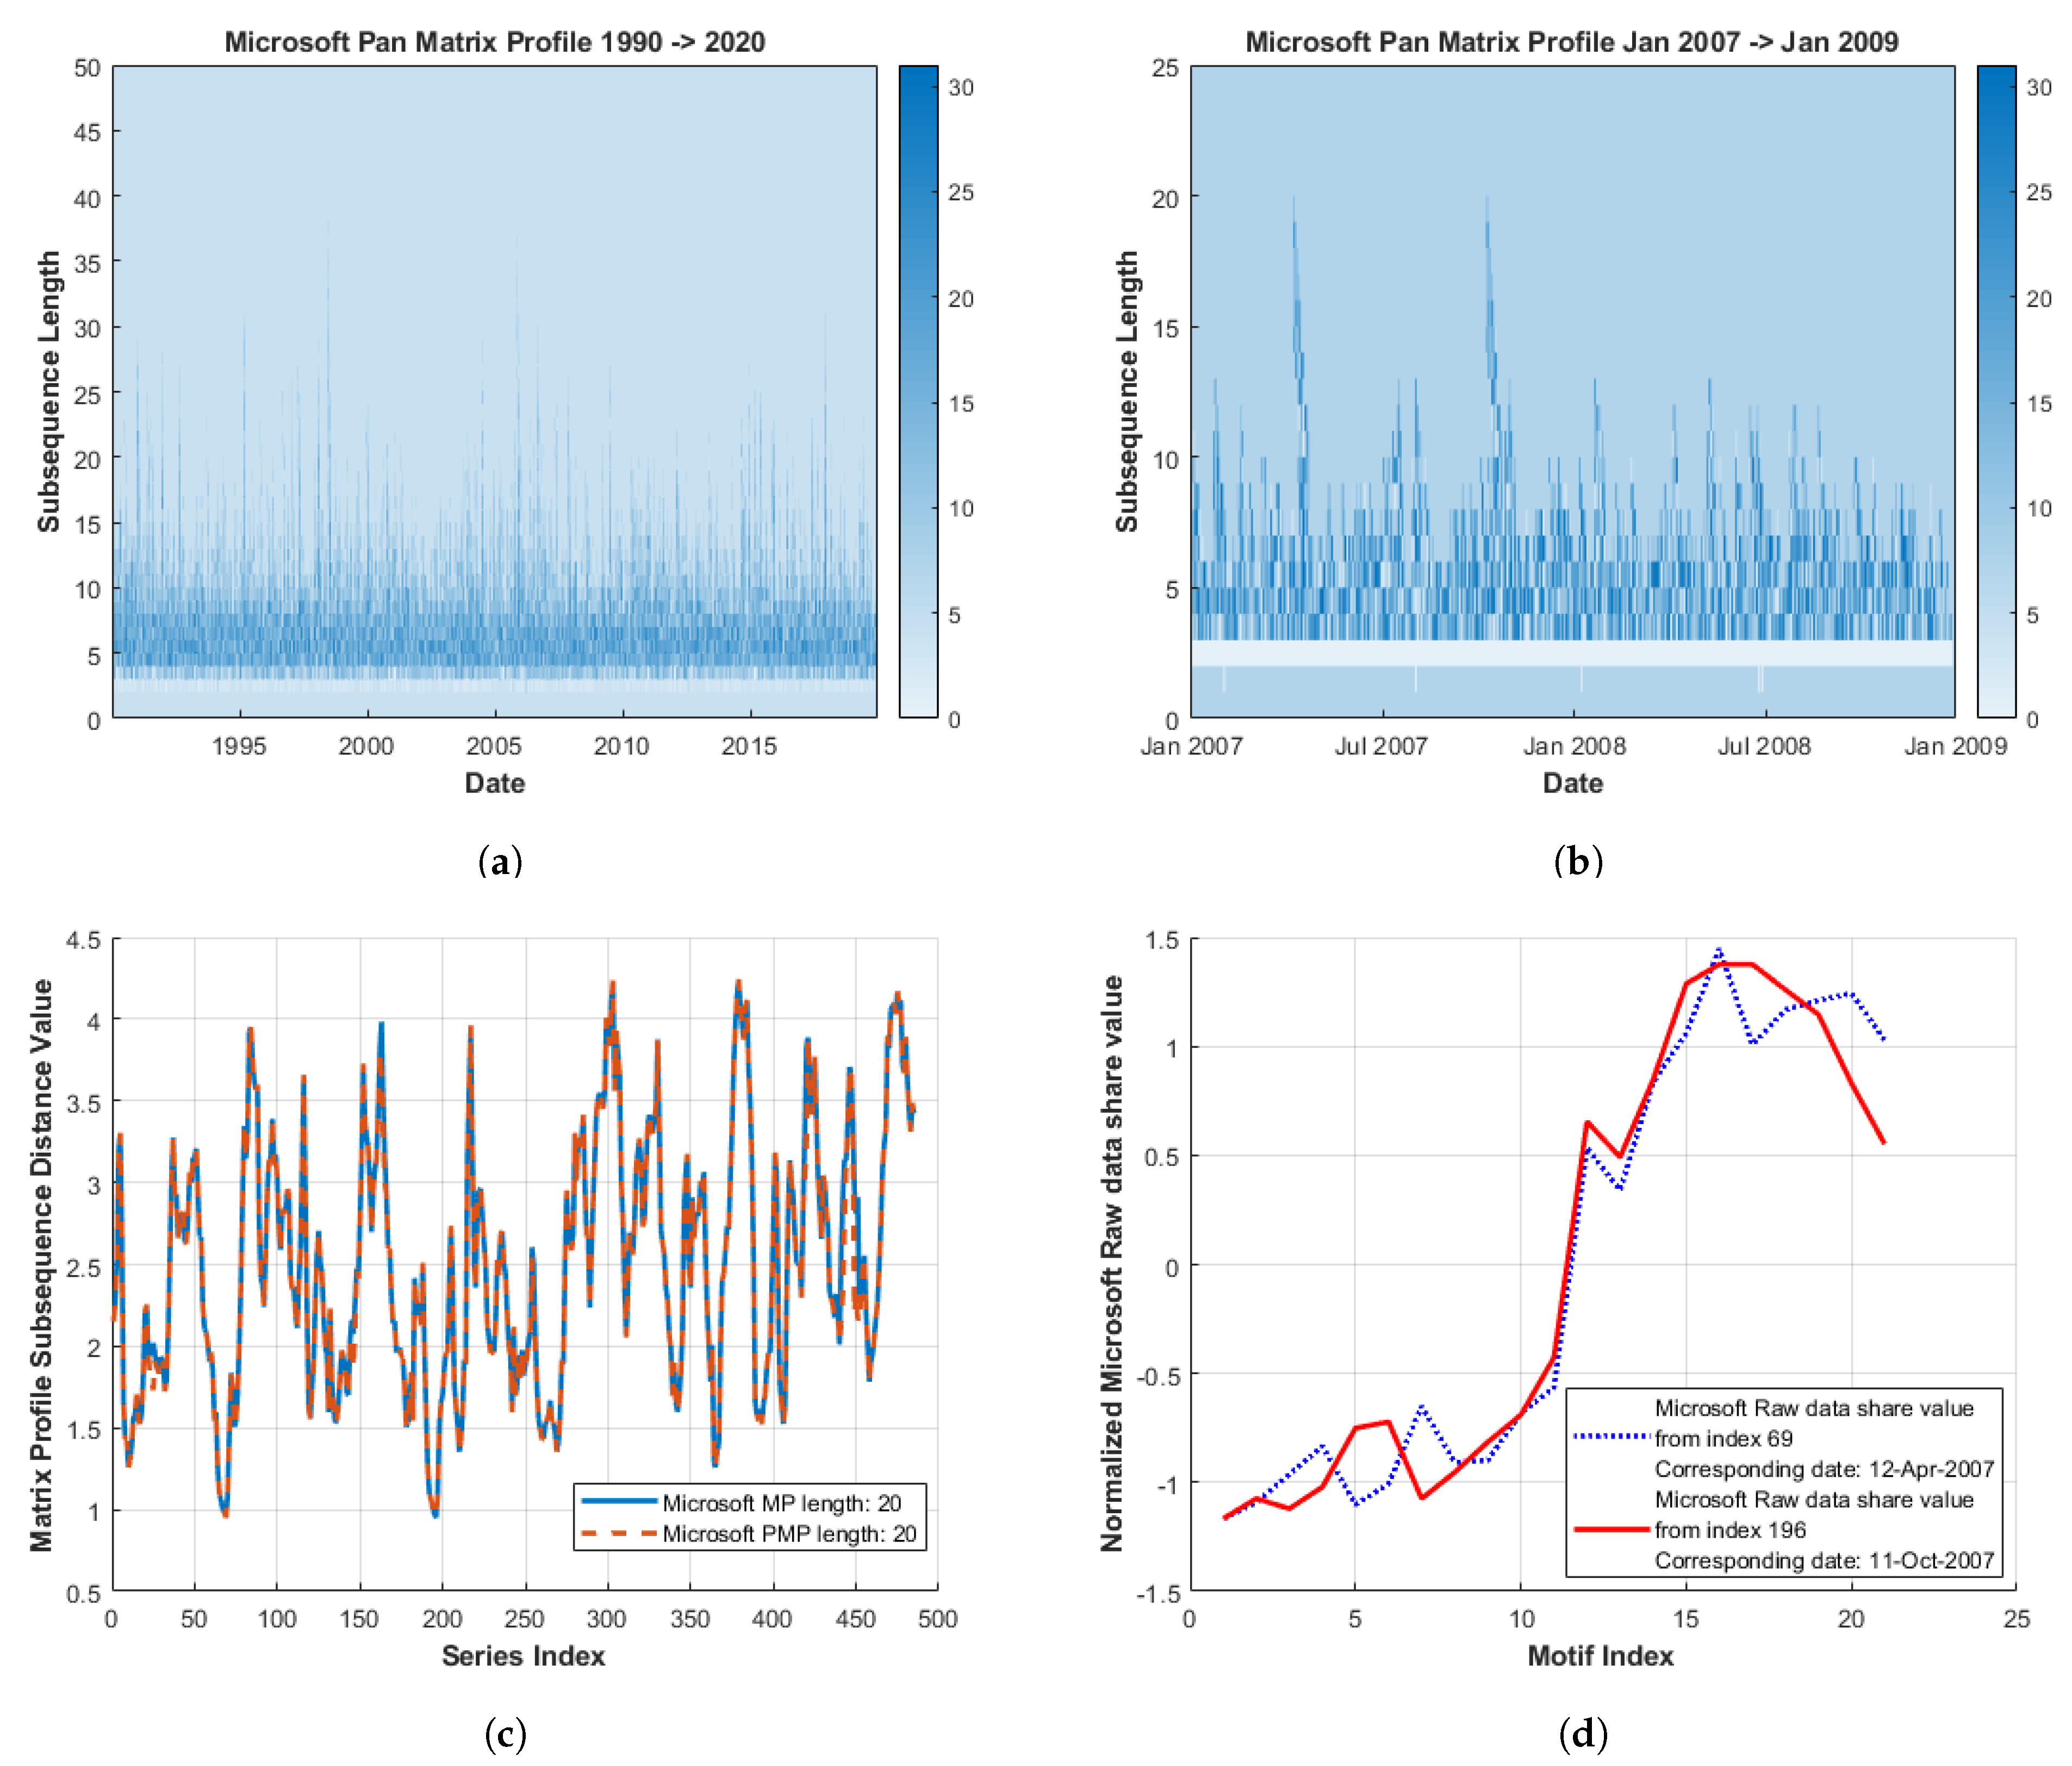
SKIMP allows the optimised generation of a set of MPs for a user-provided length range. The new structure, known as a Pan Matrix Profile (PMP), can be plotted as a heat-map indicating both the location and length of motifs in a data set, as illustrated in Figure 12a. Larger motif length locations are indicated by spikes while more frequent motif lengths correspond to areas of increased intensity. PMP plots can also provide an indication on common features of financial time-series, i.e., these may contain a large number of smaller length motifs even over a varying time window, as shown in Figure 12a,b. This suggests a shorter MP length may be more applicable for financial series analysis.
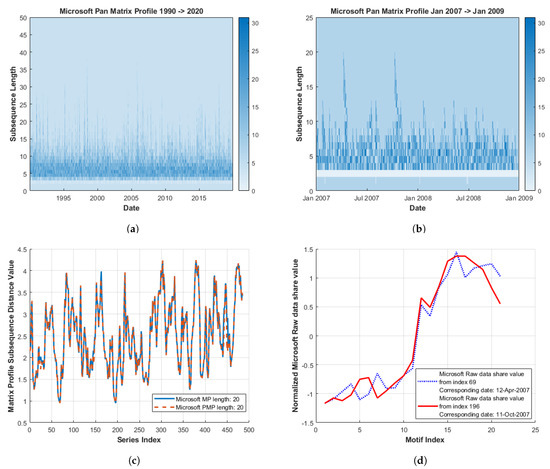
Figure 12.
Microsoft Pan Matrix Profile (PMP) and underlying motif identification. The raw data Microsoft motifs in (d) were identified by an index of peaks in the reduced Microsoft Pan Matrix Profile (b) and the corresponding index of low MP value locations in (c). For context of overall motif length and location, a longer timescale Microsoft PMP is also provided in (a).
Thus, a PMP can provide an alternative method when obtaining start locations for motif behaviour investigations over reduced timescales. This is important as MP plots can become noisy at lower sub-sequence lengths, particularly in the multi-variate case. To illustrate this (within a single series initially), a motif length of 20 was chosen from Figure 12b as a suitable length for probing underlying raw series behaviour.
A comparison between the standard MP and PMP is shown for the given sub-sequence length in Figure 12c illustrating close correlation (as anticipated). The location of peaks within the PMP plot (indicating motifs of greater sub-sequence length), are identified by the index which corresponds to localised MP minima values in Figure 12c. The underlying raw data sequences are isolated based upon these indexes and are displayed in Figure 12d. In this case, the two locations correspond to the ‘classical’ motif as the MPI indexes refer to each other.
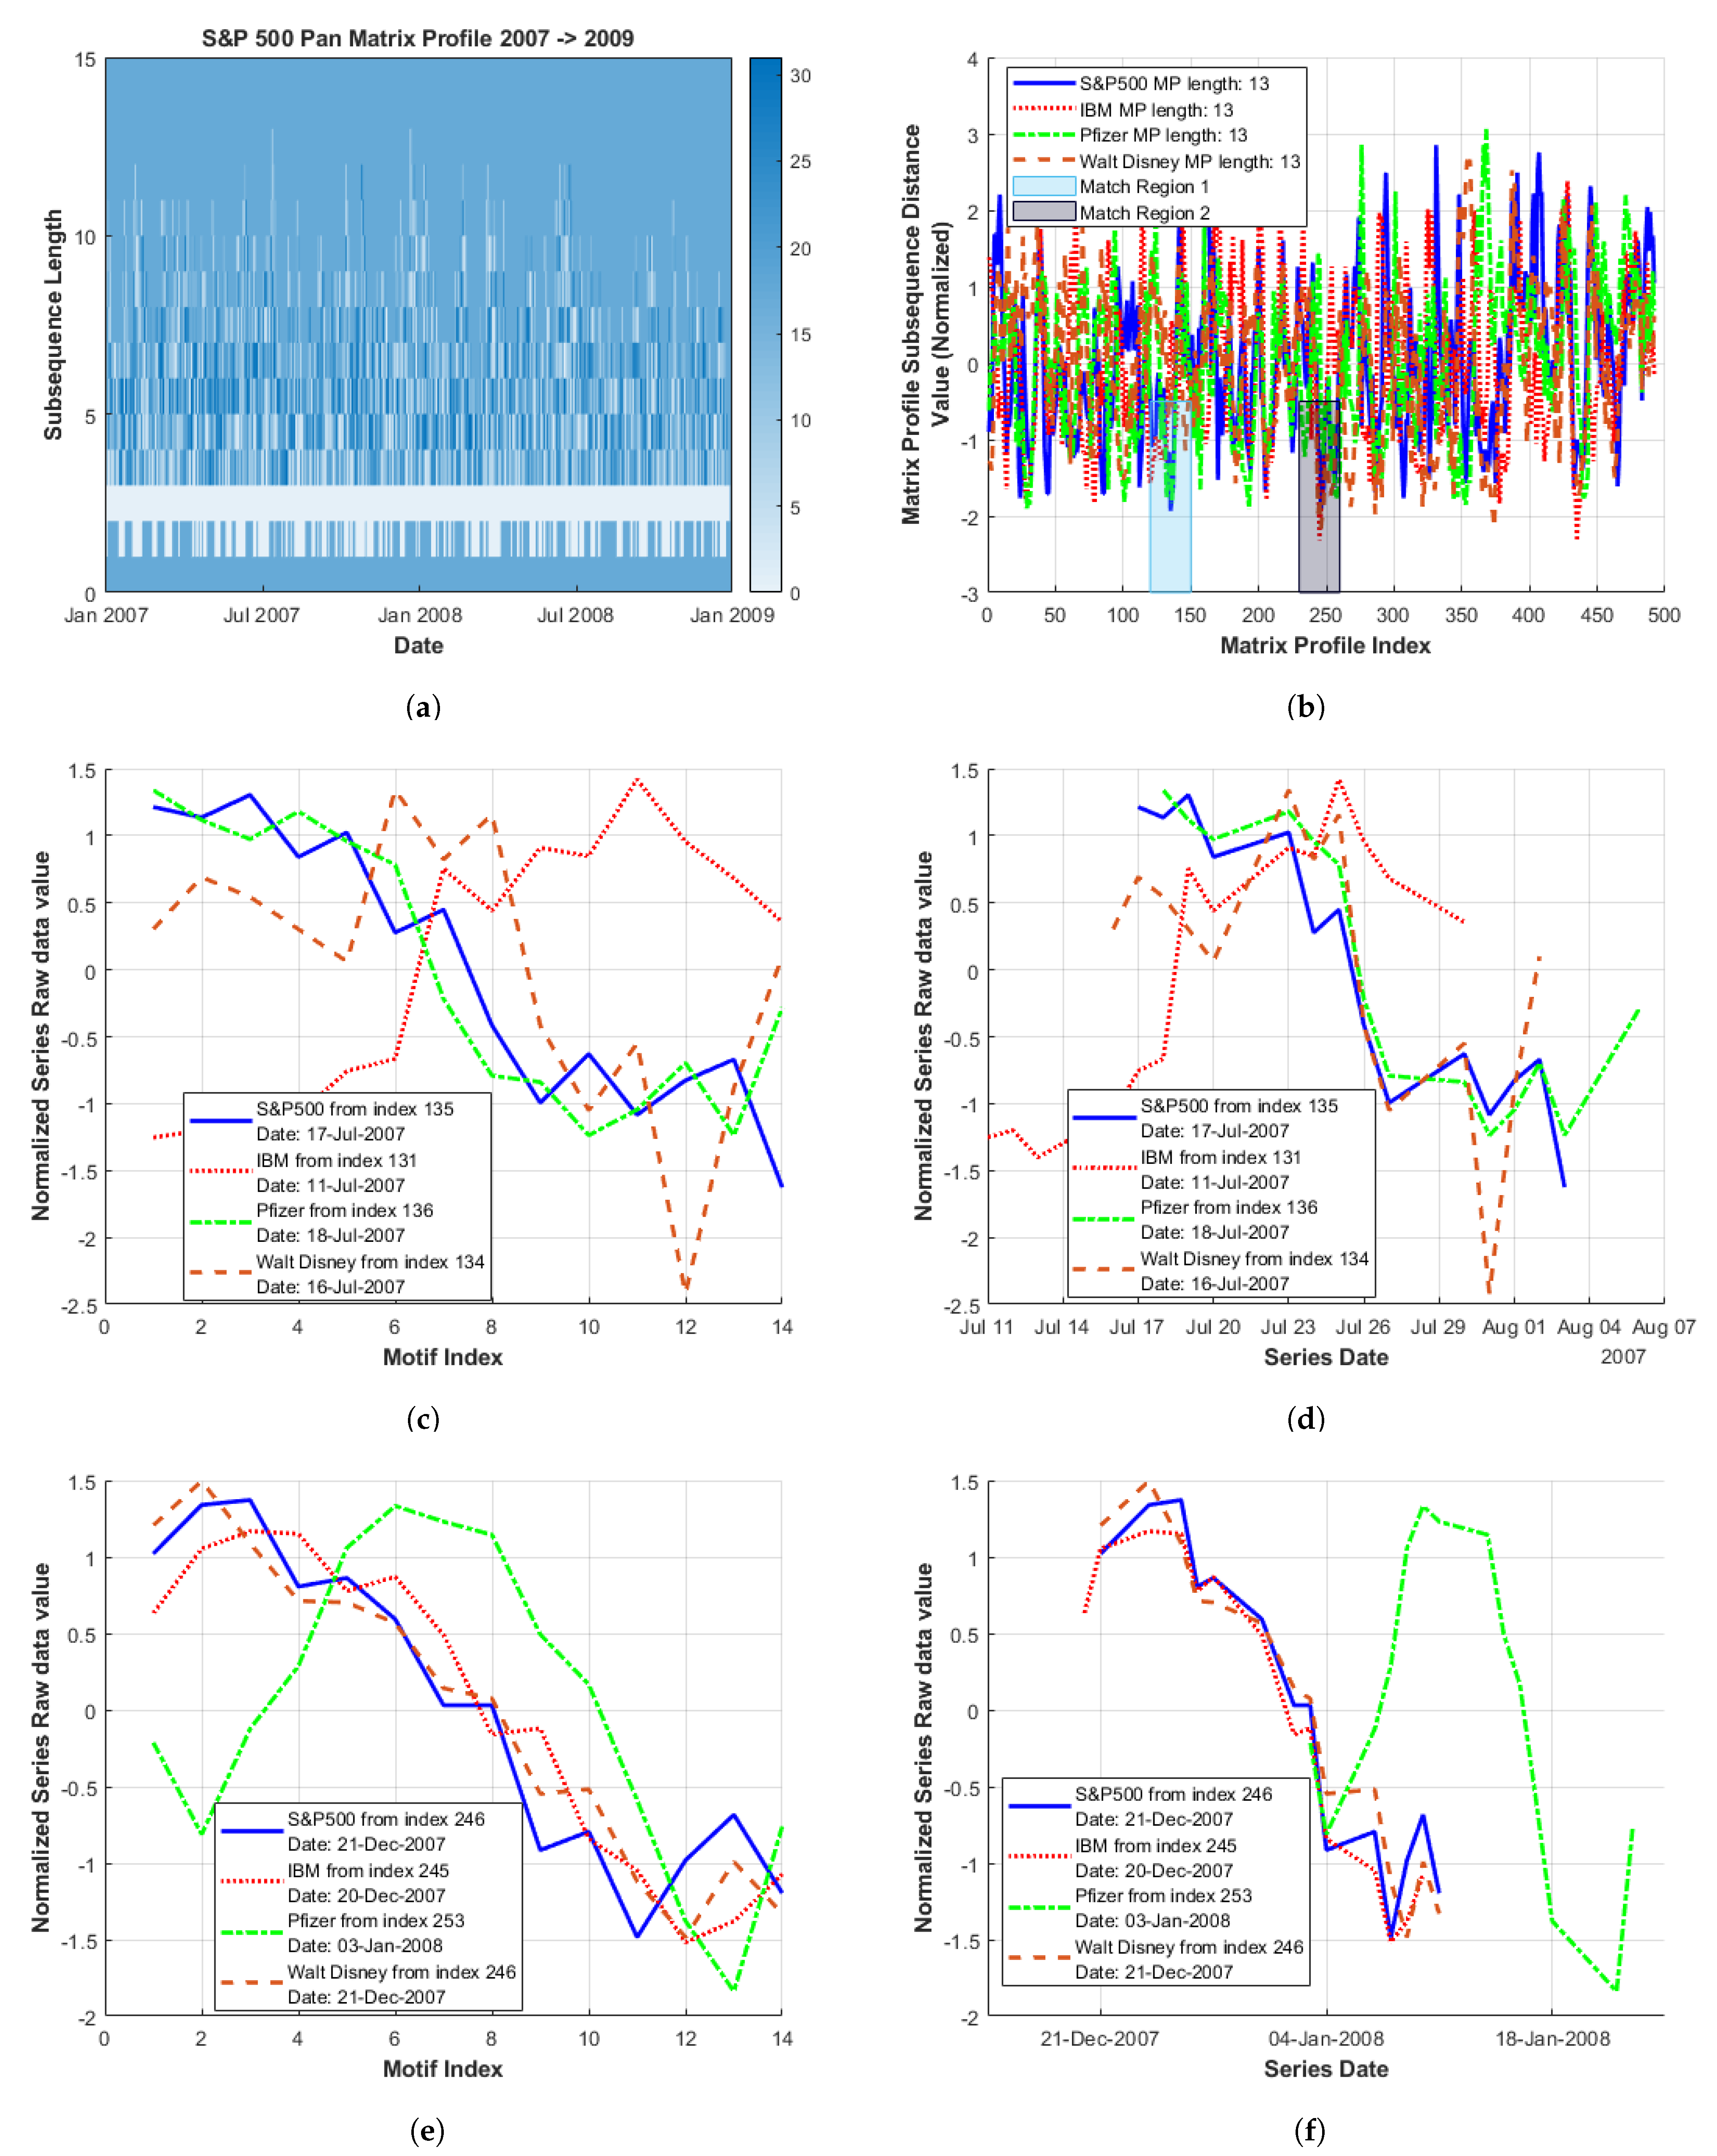
Expanding this approach for the multi-variate case, the same scenario (and individual series) of stock behaviour within an index was considered. Using an initial S&P500 Pan Matrix Profile plot (Figure 13a), a sub-sequence length of 13 was chosen for further analysis. For the S&P500, indices 134 and 246 exhibited peaks corresponding to motifs of above average length. These were taken as approximate start locations for finding MP minima within the individual Matrix Profiles (Figure 13b). The alternative of only examining Matrix Profiles for low MP minima occurrence was not adopted as they become too noisy at this low sub-sequence resolution. Thus, the indexes chosen from the PMP serve as regions previously considered as local match regions (Section 3.3) when examining the corresponding MP plots generated for this sub-sequence length.
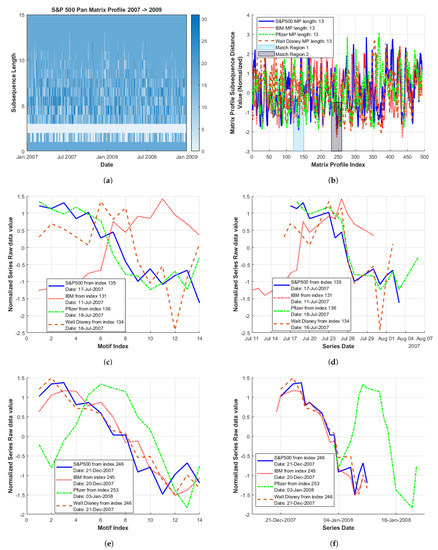
Figure 13.
Stock within an index, short-term Pan Matrix Profile (PMP) analysis from January 2007 to January 2009: (a) S&P500 Pan Matrix Profile; (b) multi-sector MP plots with highlighted match regions identified from the S&P500 Pan Matrix Profile; (c) Match Region 1 overlapping; (d) Match Region 1 by date; (e) Match Region 2 overlapping; and (f) Match Region 2 by date.
Figure 13b displays the full set of MP plots for these series (within the time window examined) with match regions centred on these indexes highlighted. Figure 13b also serves to further illustrate the noisy nature of financial MP plots at lower sub-sequence lengths, particularly for the multi-variate case as here. For clarity, identified minima indexes and corresponding dates are shown in Table 3, with sub-sequences of interest for both match regions 1 and 2 illustrated from Figure 13d,f.
For Match Region 1, when plotted according to the sub-sequence index (Figure 13c), independent raw data sub-sequences are not in particularly good agreement. However, when plotted according to date (Figure 13d), basic behaviour is similar for all series, although the sharp reduction in value from 25 to 27 July 2007 is not as pronounced for IBM.
For Match Region 2, raw data sub-sequence shapes appear to correspond quite well when plotted according to the sub-sequence index (Figure 13e). However, when plotted by date in this case (Figure 13f), the Pfizer series briefly demonstrates coherent behaviour, however, in general, it lags relative to the other series.
Figure 13f also illustrates that the MP minima location has a disproportionately greater effect at these lower resolutions, causing a larger shift (relative to motif length) as seen previously in Section 3.5 for example. Further when plotting by date, there is less likelihood of an overlap region.
4. Discussion
In this work, we explored the potential of the Matrix Profile (MP) algorithm, to offer additional insight on financial series analysis by the practical demonstration of motif identification and behaviour characterisation. Construction of MP series plots within a single series can illustrate longer-term trends around a given date (identified from low MP values), while MP series distributions reflect the percentage of motif matches and discords in the underlying series.
In multiple series analyses, the coincidence of local MP minima values can illustrate similar behaviour (i.e., motif shape) across single market sectors, as well as more generalised market behaviour (based on a set of companies spanning multiple sectors). The relationship between index data and individual stock data can also be examined using the MP. Additionally, the combination of series based upon different measures of a single company or index can be investigated using this approach, providing insight for example on whether a company is under or over valued. The relationship between local MP minima and the behaviour of the series they represent is also explored through an examination of raw data sub-sequences (based on the identified MP minima location and known MP sub-sequence length). This is demonstrated for both the single and multi-variate case.
The choice of sub-sequence length for analysis is an important consideration. The Pan Matrix Profile (PMP) algorithm (an extension of the Matrix Profile), applied to financial series, demonstrates how this decision can be informed by motif location and length in a given data set. Additionally, it can simplify the interpretation of MP plots by using a shortened sub-sequence length range to probe regions of interest. Nevertheless, a more comprehensive automated method for determining localised MP minima is clearly desirable, while the robustness of the general methods should be tested on additional time series, such as market rate curves and commodities, for example.
Moreover, while the work presented here has focused on the interpretation of independent MP plots for the multi-variate case, recent work on extending the MP algorithm, such as mSTAMP [29] and Ostinato [30], suggests that examining all underlying series simultaneously is within reach. This would facilitate the automation of a process to illustrate occasions where series are conforming with market behaviour, additionally highlighting potential hedging opportunities through the identification of series (within the set examined) that do not exhibit this behaviour.
Author Contributions
Conceptualisation, methodology, software, formal analysis, investigation, visualisation and writing—original draft, E.C.; writing—review and editing, validation, M.C. and H.J.R. All authors have read and agreed to the published version of the manuscript.
Funding
This research received no external funding.
Institutional Review Board Statement
Not applicable.
Informed Consent Statement
Not applicable.
Data Availability Statement
Financial Time Series data available at: https://finance.yahoo.com/lookup (accessed on 29 June 2021), Matrix Profile code available at: https://www.cs.ucr.edu/~eamonn/MatrixProfile.html (accessed on 29 June 2021).
Conflicts of Interest
The authors declare no conflict of interest.
Abbreviations
The following abbreviations are used in this manuscript:
| MP | Matrix Profile |
| SKIMP | Scalable Kinetoscopic Matrix Profile |
| mSTAMP | Multidimensional Scalable Time Series Anytime Matrix Profile |
| PMP | Pan Matrix Profile |
| MPI | Matrix Profile Index |
| PAA | Piecewise Aggregate Approximation |
| WTI | West Texas Intermediate |
| FED | Federal Reserve System |
| IMF | International Monetary Fund |
| S&P500 | Standard and Poor’s 500 |
References
- Mueen, A.; Keogh, E.; Zhu, Q.; Cash, S.; Westover, B. Exact Discovery of Time Series Motifs. In Proceedings of the SIAM International Conference on Data Mining, Sparks, NV, USA, 30 April–2 May 2009; pp. 35–53, 473–484. [Google Scholar] [CrossRef]
- Castro, N.; Azevedo, P. Significant motifs in time series. Stat. Anal. Data Min. 2012, 5, 35–53. [Google Scholar] [CrossRef] [Green Version]
- Silva, D.F.; Yeh, C.M.; Zhu, Y.; Batista, G.; Keogh, E. Fast Similarity Matrix Profile for Music Analysis and Exploration. IEEE Trans. Multimed. 2019, 21, 29–38. [Google Scholar] [CrossRef]
- Senobari, N.S.; Funning, G.; Zimmerman, Z.; Zhu, Y.; Keogh, E. Using the similarity Matrix Profile to investigate foreshock behavior of the 2004 Parkfield earthquake. In Proceedings of the American Geophysical Union Fall Meeting, Washington, DC, USA, 10–14 December 2018; p. S51B-03. [Google Scholar]
- Ferreira, P.; Azevedo, P.; Silva, G.; Brito, M. Mining Approximate Motifs in Time Series. In Discovery Science; Springer: Berlin/Heidelberg, Germany, 2006; pp. 89–101. ISBN 978-3-540-46493-8. [Google Scholar]
- Wilson, W.; Birkin, P.; Aickelin, U. The motif tracking algorithm. Int. J. Autom. Comput. 2008, 32–44. [Google Scholar] [CrossRef] [Green Version]
- Xiaoxi, D.; Ruoming, J.; Liang, D.; Lee, V.E.; Thornton, J.H. Migration Motif A Spatial Temporal Pattern Mining Approach for Financial Markets. In Proceedings of the 15th ACM SIGKDD International Conference on Knowledge Discovery and Data Mining, Paris, France, 28 June–1 July 2009; pp. 1135–1144. [Google Scholar] [CrossRef]
- Cartwright, E.; Crane, M.; Ruskin, H.J. Abstract: Motif Discovery & Evaluation Focus on Finance. In Proceedings of the Econophysics Colloquium 2018, Palermo, Italy, Online. 2018; Available online: https://sites.google.com/view/econophysics-colloquium-2018 (accessed on 29 June 2021).
- Cartwright, E.; Crane, M.; Ruskin, H.J. Financial Time Series: Motif Discovery and Analysis Using VALMOD. In Proceedings of the International Conference on Computational Science, Faro, Portugal, 12–14 June 2019; pp. 771–778. [Google Scholar] [CrossRef] [Green Version]
- Yeh, C.M.; Zhu, Y.; Ulanova, L.; Begum, N.; Ding, Y.; Dau, H.; Silva, D.F.; Mueen, A.; Keogh, E. Matrix profile I: All pairs similarity joins for time series a unifying view that includes motifs discords and shapelets. IEEE ICDM 2016, 1, 1317–1322. [Google Scholar] [CrossRef]
- Keogh, E. The UCR Matrix Profile Homepage. 2020. Available online: https://www.cs.ucr.edu/~eamonn/MatrixProfile.html (accessed on 29 June 2021).
- Gao, X.; An, H.; Fang, W.; Huang, X.; Li, H.; Zhong, W. Characteristics of the transmission of autoregressive sub-patterns in financial time series. Sci. Rep. 2014, 4, 2045–2322. [Google Scholar] [CrossRef] [PubMed] [Green Version]
- Investopedia Common Chart Pattern Definitions. Available online: https://www.investopedia.com/articles/technical/112601.asp (accessed on 29 June 2021).
- Investopedia Pennant Chart Pattern Definition. Available online: https://www.investopedia.com/terms/p/pennant.asp (accessed on 29 June 2021).
- Investopedia Triple Bottom Chart Pattern Definition. Available online: https://www.investopedia.com/terms/t/triplebottom.asp (accessed on 29 June 2021).
- Teall, J. Financial Trading and Investing, 2nd ed.; Academic Press: Cambridge, MA, USA, 2018; pp. 145–167. ISBN 9780128111161. [Google Scholar]
- Yahoo Finance Historical S&P Index. Available online: https://finance.yahoo.com/quote/%5EGSPC?p=%5EGSPC (accessed on 29 June 2021).
- Meegan, A.; Corbet, S.; Larkin, C. Financial market spillovers during the quantitative easing programmes of the global financial crisis (2007–2009) and the European debt crisis. J. Int. Financ. Mark. Instit. Money 2018, 56, 128–148. [Google Scholar] [CrossRef]
- Bracke, T.; Michael, F. The macro-financial factors behind the crisis: Global liquidity glut or global savings glut? N. Am. J. Econ. Financ. 2012, 23, 185–202. [Google Scholar] [CrossRef]
- Yahoo Finance Historical Microsoft Data. Available online: https://finance.yahoo.com/quote/MSFT (accessed on 29 June 2021).
- Investopedia Website Technology Companies List. Available online: https://www.investopedia.com/articles/markets/030816/worlds-top-10-technology-companies-aapl-googl.asp (accessed on 29 June 2021).
- Investopedia Website Pharmaceutical Stocks List. Available online: https://www.investopedia.com/investing/pharmaceutical-stocks/ (accessed on 29 June 2021).
- Investopedia Website Finance Stocks List. Available online: https://www.investopedia.com/terms/f/financial_sector.asp (accessed on 29 June 2021).
- OECD Financial Markets Highlights November. Financ. Mark. Trends 2007, 93, 11–25. Available online: http://www.oecd.org/finance/financial-markets/39654572.pdf (accessed on 29 June 2021).
- Bernanke, B.S. The Recent Financial Turmoil and its Economic and Policy Consequences. Available online: https://www.federalreserve.gov/newsevents/speech/bernanke20071015a.htm (accessed on 29 June 2021).
- Yahoo Finance Historical Dow Jones Index 26th October 2004 to 8th October 2008. Available online: https://finance.yahoo.com/quote/%5EDJI/history?period1=1098748800&period2=1223424000&interval=1d&filter=history&frequency=1d&includeAdjustedClose=true (accessed on 29 June 2021).
- Britannica Financial Crisis of 2007–08 Summary. Available online: https://www.britannica.com/event/financial-crisis-of-2007-2008/Key-events-of-the-crisis (accessed on 29 June 2021).
- Madrid, F.; Imani, S.; Mercer, R.; Zimmerman, Z.; Shakibay, N.; Mueen, A.; Keogh, E. Matrix Profile XX: Finding and Visualizing Time Series Motifs of All Lengths using the Matrix Profile. ICBK 2019, 1, 175–182. [Google Scholar] [CrossRef]
- Yeh, C.-M.; Kavantzas, N.; Keogh, E. Matrix Profile VI: Meaningful Multidimensional Motif Discovery. IEEE ICDM 2017, 1, 565–574. [Google Scholar] [CrossRef]
- Kamgar, K.; Gharghabi, S.; Keogh, E. Matrix Profile XV: Exploiting Time Series Consensus Motifs to Find Structure in Time Series Sets. IEEE ICDM 2019, 1, 1156–1161. [Google Scholar] [CrossRef]


Publisher’s Note: MDPI stays neutral with regard to jurisdictional claims in published maps and institutional affiliations. |
© 2021 by the authors. Licensee MDPI, Basel, Switzerland. This article is an open access article distributed under the terms and conditions of the Creative Commons Attribution (CC BY) license (https://creativecommons.org/licenses/by/4.0/).