Abstract
This article presents the implementation and the evaluation of a transmission–reception system for Physical Downlink Control Channel (PDCCH) within the context of fifth-generation cellular networks (5G/NR). The research focuses on characterizing the behavior of the PDCCH channel concerning different User Equipment (UE) positions through simulations conducted in MATLAB. Two scenarios are considered: a lossless system and a system with losses, where the outcomes are presented in terms of Bit Error Rate (BER) vs. Signal to Noise Ratio (SNR) and BER vs. Transmit Power, respectively. One contribution of the paper is the explanation transmission–reception system for PDCCH in MATLAB, while the second contribution is the presentation of simulation results. From results, it was deduced that higher UE height corresponds to improved channel performance, greater UE elevation angle leads to enhanced channel performance, and increased carrier frequency results in reduced performance of the physical control PDCCH channel.
1. Introduction
Presently, the widely used fourth-generation (4G) mobile network, known as long term evolution (LTE), is gradually giving way to the anticipated adoption of the fifth-generation (5G) mobile network, known as new radio (NR). The 3GPP technical report 38.913 [1] outlines three primary 5G usage scenarios: enhanced mobile broadband (eMBB), ultra-reliable and low-latency communications (URLLC), and massive machine type communications (mMTC). These scenarios promise significant enhancements, including higher transmission speeds (up to 10 Gbps) and ultra-low latency (as low as 1 ms) [1]. These advancements are set to revolutionize mobile communication services and enable innovative applications [1].
Building on lessons from operational networks like LTE, mobile operators have encountered user grievances related to signal degradation due to coverage issues or channel fading [2]. Thus, a thorough analysis of control channels across various positions of user equipment (UE) within base station coverage areas becomes crucial in devising strategies to mitigate communication losses. Such insights can optimize 5G base station deployment, improving coverage and user services.
The mobility of UEs within coverage areas introduces dynamic changes in channel conditions, influenced by device movement and the stochastic nature of wireless channels [3]. Consequently, assessing the behavior of control channels, crucial for communication control, as UE positions change, becomes pivotal.
With these motivations, this study employs MATLAB simulations to evaluate the performance of the physical downlink control channel (PDCCH) in the new 5G cellular communication network. The paper is structured as follows: Section 2 provides a concise overview of the 5G/NR architecture, followed by Section 3 describing the MATLAB system implementation. Simulation results are presented in Section 4, and finally, Section 5 outlines the conclusions.
2. 5G/NR Network Architecture Overview
The 5G system, along with its predecessors, comprises three main components: user equipment, the 5G core network (5GC), and next generation radio access (NG-RA) [4,5]. User equipment connects to the 5G NR network, while the 5GC manages authentication, configuration loading, and mobility. NG-RA handles radio connections in the telecommunications system [4,5].
In the physical-layer architecture of 5G, there are significant changes compared to 4G. The focus is on data and control channels managed by NG-RA. The transmitter and receiver involve processes like power control, cyclic redundancy check (CRC), 5G polar coding/encoding, modulation/demodulation, and multiple-input multiple-output (MIMO) techniques [4,5].
A channel is the transmission medium through which information travels from a transmitter to a receiver. In 5G/NR there are logical, transport, and physical channels (upstream and downstream) [4,5]. Also, there are channels for user data and control information. The physical layer controls the mapping of transport channels to physical channels [4,5]. One of the most important channels for the control of information is the physical downlink control channel (PDCCH).
The PDCCH channel was designed in Release 15 [4]. The PDCCH finds applications in scheduling both uplink (UL) and downlink (DL) data channels. It has a variety of specialized functions such as uplink power control, slot format indication, and preemptive scheduling [6,7]. Information carried on the PDCCH is called downlink control information (DCI) [6,7]. To receive DCI via the PDCCH, the UE observes a collection of PDCCH candidates during one or more configured monitoring instances within designated control resource sets (CORESETs) according to specified search space set (SS-Set) configurations [6].
The PDCCH employs polar coding with a predefined payload size, rate matching, and QPSK modulation [4,5]. In the context of PDCCH monitoring, NR employs a similar blind decoding approach to the PDCCH, where the UE performs cyclic redundancy checks (CRC). In this process, the CRC bits are concealed using an identifier (RNTI) recognized by the user [4,5,6].
3. System Implementation in MATLAB
The transmission–reception system of the PDCCH channel is constructed based on the fundamental principles outlined in 3GPP Release 15 [4] and Release 16 [5]. This study comprises two distinct scenarios. Firstly, a transmission–reception system for the PDCCH is implemented to assess the bit error rate (BER) against the signal-to-noise ratio (SNR). This scenario operates within an environment devoid of losses generated by the wireless channel, referred to as the “Lossless System” henceforth in this section. Secondly, for the evaluation of BER against the transmit power, the study transitions to an environment marked by losses in the wireless channel. This setting is situated within a rural macrocell (RMa) scenario, this case is referred to as the “Lossy System”.
The implementation and coding of the transmission–reception system for both scenarios are carried out using MATLAB 2021b software [8], with the utilization of functions provided by the 5G Toolbox [8]. In a general sense, the two scenarios consist of the following blocks (Table 1) [4,5]:

Table 1.
Block diagram of transmission–reception implemented system [4,5].
3.1. Lossless System
The process of transmitting information for the lossless PDCCH initiates on the transmitter side with the transmission of 140 bits of information [4,5]. The following processes are then executed: DCI encoding, PDCCH encoding, mapping, and the OFDM transmission technique [4,5]. The information is transmitted through the additive white Gaussian noise (AWGN) channel. On the receiver side, the inverse processes are carried out: OFDM transmission technique, demapping, PDCCH decoding, and DCI decoding [4,5]. These processes lead to the retrieval of the transmitted 140 bits, which are then used for BER calculation.
3.2. Lossy System
This section provides a brief description of the implementation of the PDCCH with path losses, considering the position of the user equipment (UE) (height and elevation angle) in relation to the 5G NR base station (gNB). The process of transmitting information for the PDCCH also initiates on the transmitter side with the transmission of 140 bits of information [4,5].
The following processes are then executed: DCI encoding, PDCCH encoding, and the OFDM transmission technique with a single-input single-output (SISO) antenna transmission system. The information is transmitted through the channel, incorporating losses generated by the path. On the receiver side, the following processes are carried out: the OFDM transmission technique, PDCCH decoding, and DCI decoding, leading to the retrieval of the transmitted 140 bits. For this scenario, losses generated by the path between the gNB, the UE, and the effect of noise are considered.
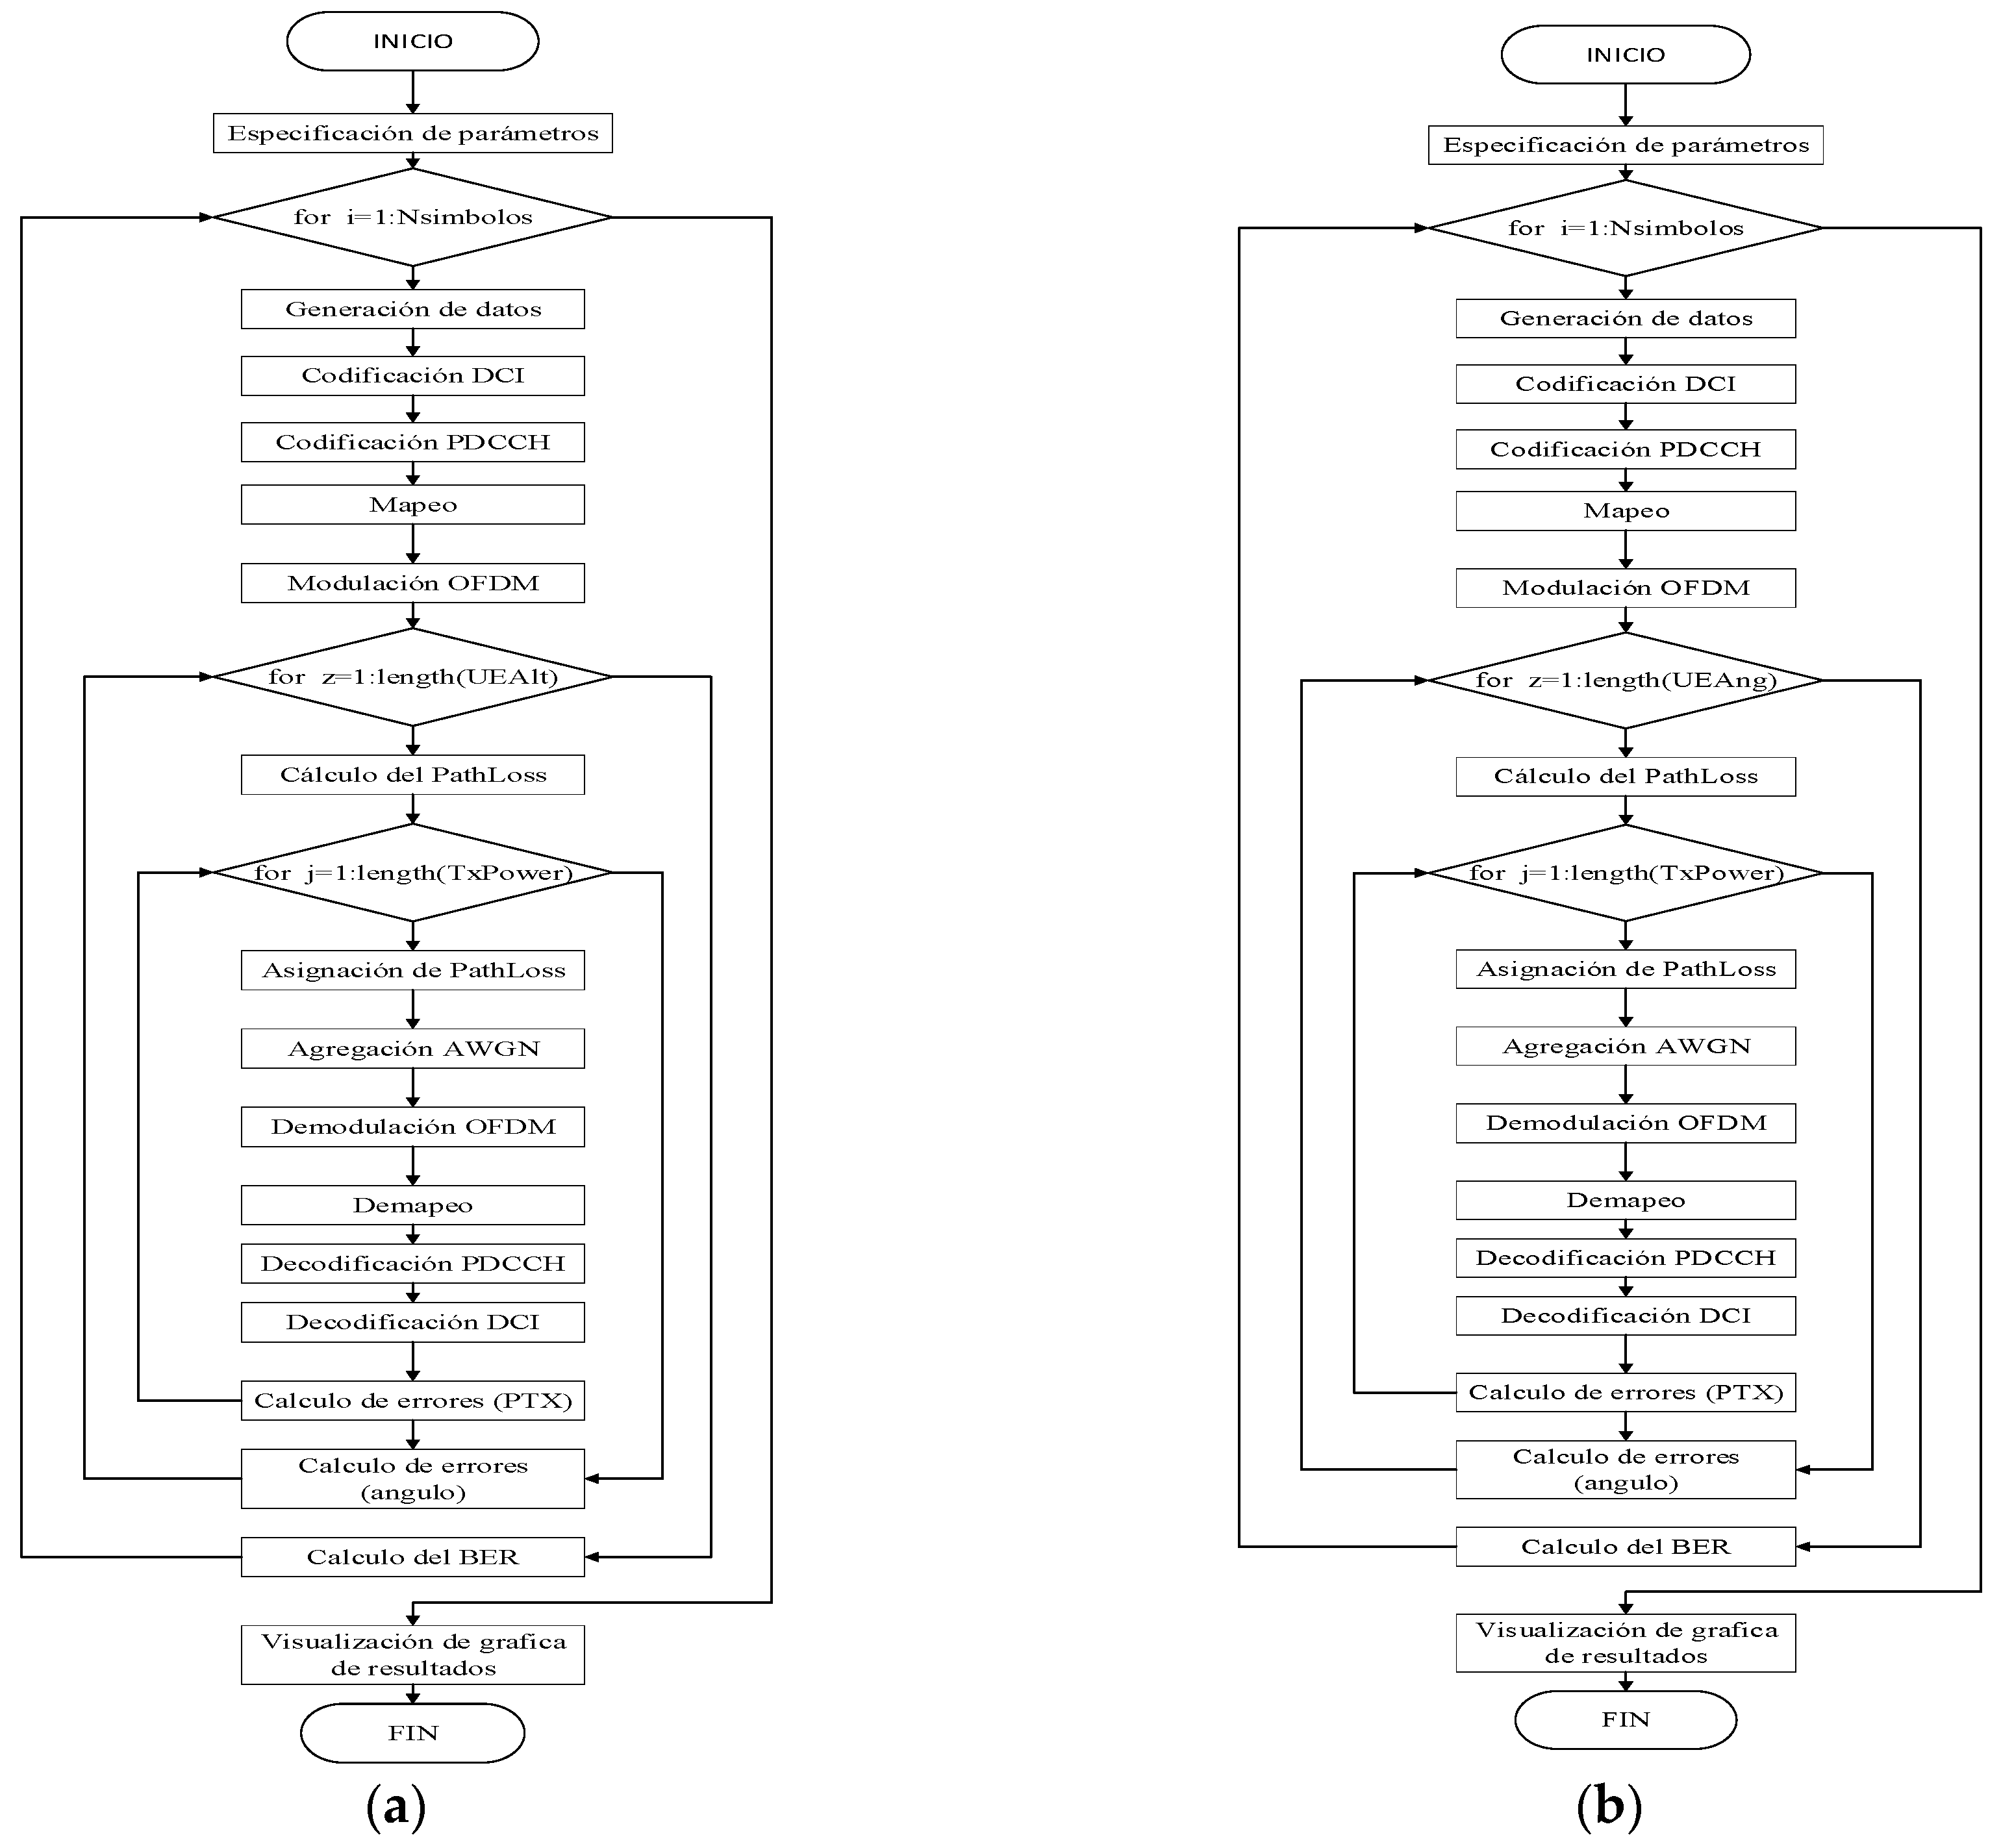
Figure 1 depicts the flowcharts of the two implemented scenarios. The main distinction between the two scenarios primarily lies in the channel model and the parameters being evaluated in each scenario. For the first scenario (the lossless system), the outcomes are illustrated in terms of BER vs. SNR. Conversely, for the second scenario (the lossy system), the results are presented in terms of BER vs. transmit power (PTx), which is evaluated at varying UE heights and UE angles.
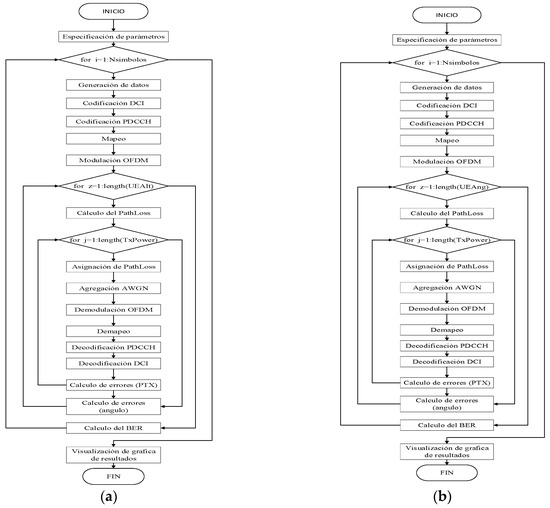
Figure 1.
The PDCCH system implemented in MATLAB. (a) Lossless System and (b) Lossy System.
It is worth noting that the calculations of distances, heights, and angles between the gNB and the UE are conducted using rectangular coordinates. This approach enables the formation of a right triangle that aids us in determining the losses. The angle is determined using the tangent function of the right triangle, as illustrated in Figure 2. The parameters of the right loss triangle are listed below:
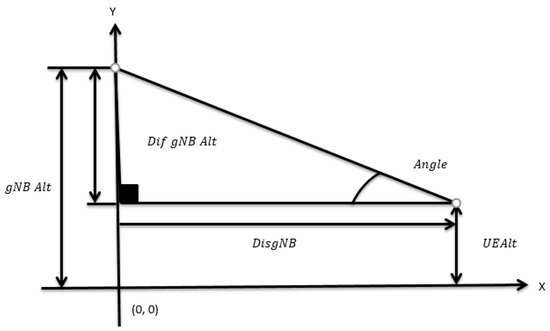
Figure 2.
Downlink loss calculation triangle.
- : The height of the gNB, which varies between 10 and 150 m;
- : The height of the UE, can take values from 1 to 10 m. This takes a value of 1.5 m for the system with angle variation losses;
- : The difference between the height of the gNB and the height of the UE;
- : The distance that separates the gNB from the UE. The gNB is located at , therefore, the value of the distance represents the position of the UE. Having: ‘RMA’ scenario and no line of sight. So;
- Angle: The angle of elevation (rad)] formed between the UE and the gNB. This value is calculated with the tangent function or can be assumed. The angle value is /3 [rad] for the PDCCH channel with height variation losses.
All elements relate to the tangent trigonometric function, as shown in Equation (1).
To have the position of the UE on the x-axis of (1), solve for the value of . The determination of the ranges of allowed angles works with m, while the limits are: and .
4. Results and Discussion
Below are the results obtained from simulations of the two scenarios. The lossless systems are presented in terms of BER vs. SNR, and, for the lossy system, in terms of BER vs. transmit power (PTx). The BER vs. SNR behavior is analyzed considering parameters of bandwidth (BW), subcarrier space (SCS), and number of resource blocks (NRB). Then, BER vs. transmit power (PTx) in the lossy system is analyzed, taking into account the variation of parameters such as the angle elevation of the UE (angUE), heights of the UE (hUE), and the frequency range FR1.
4.1. Losslesss System
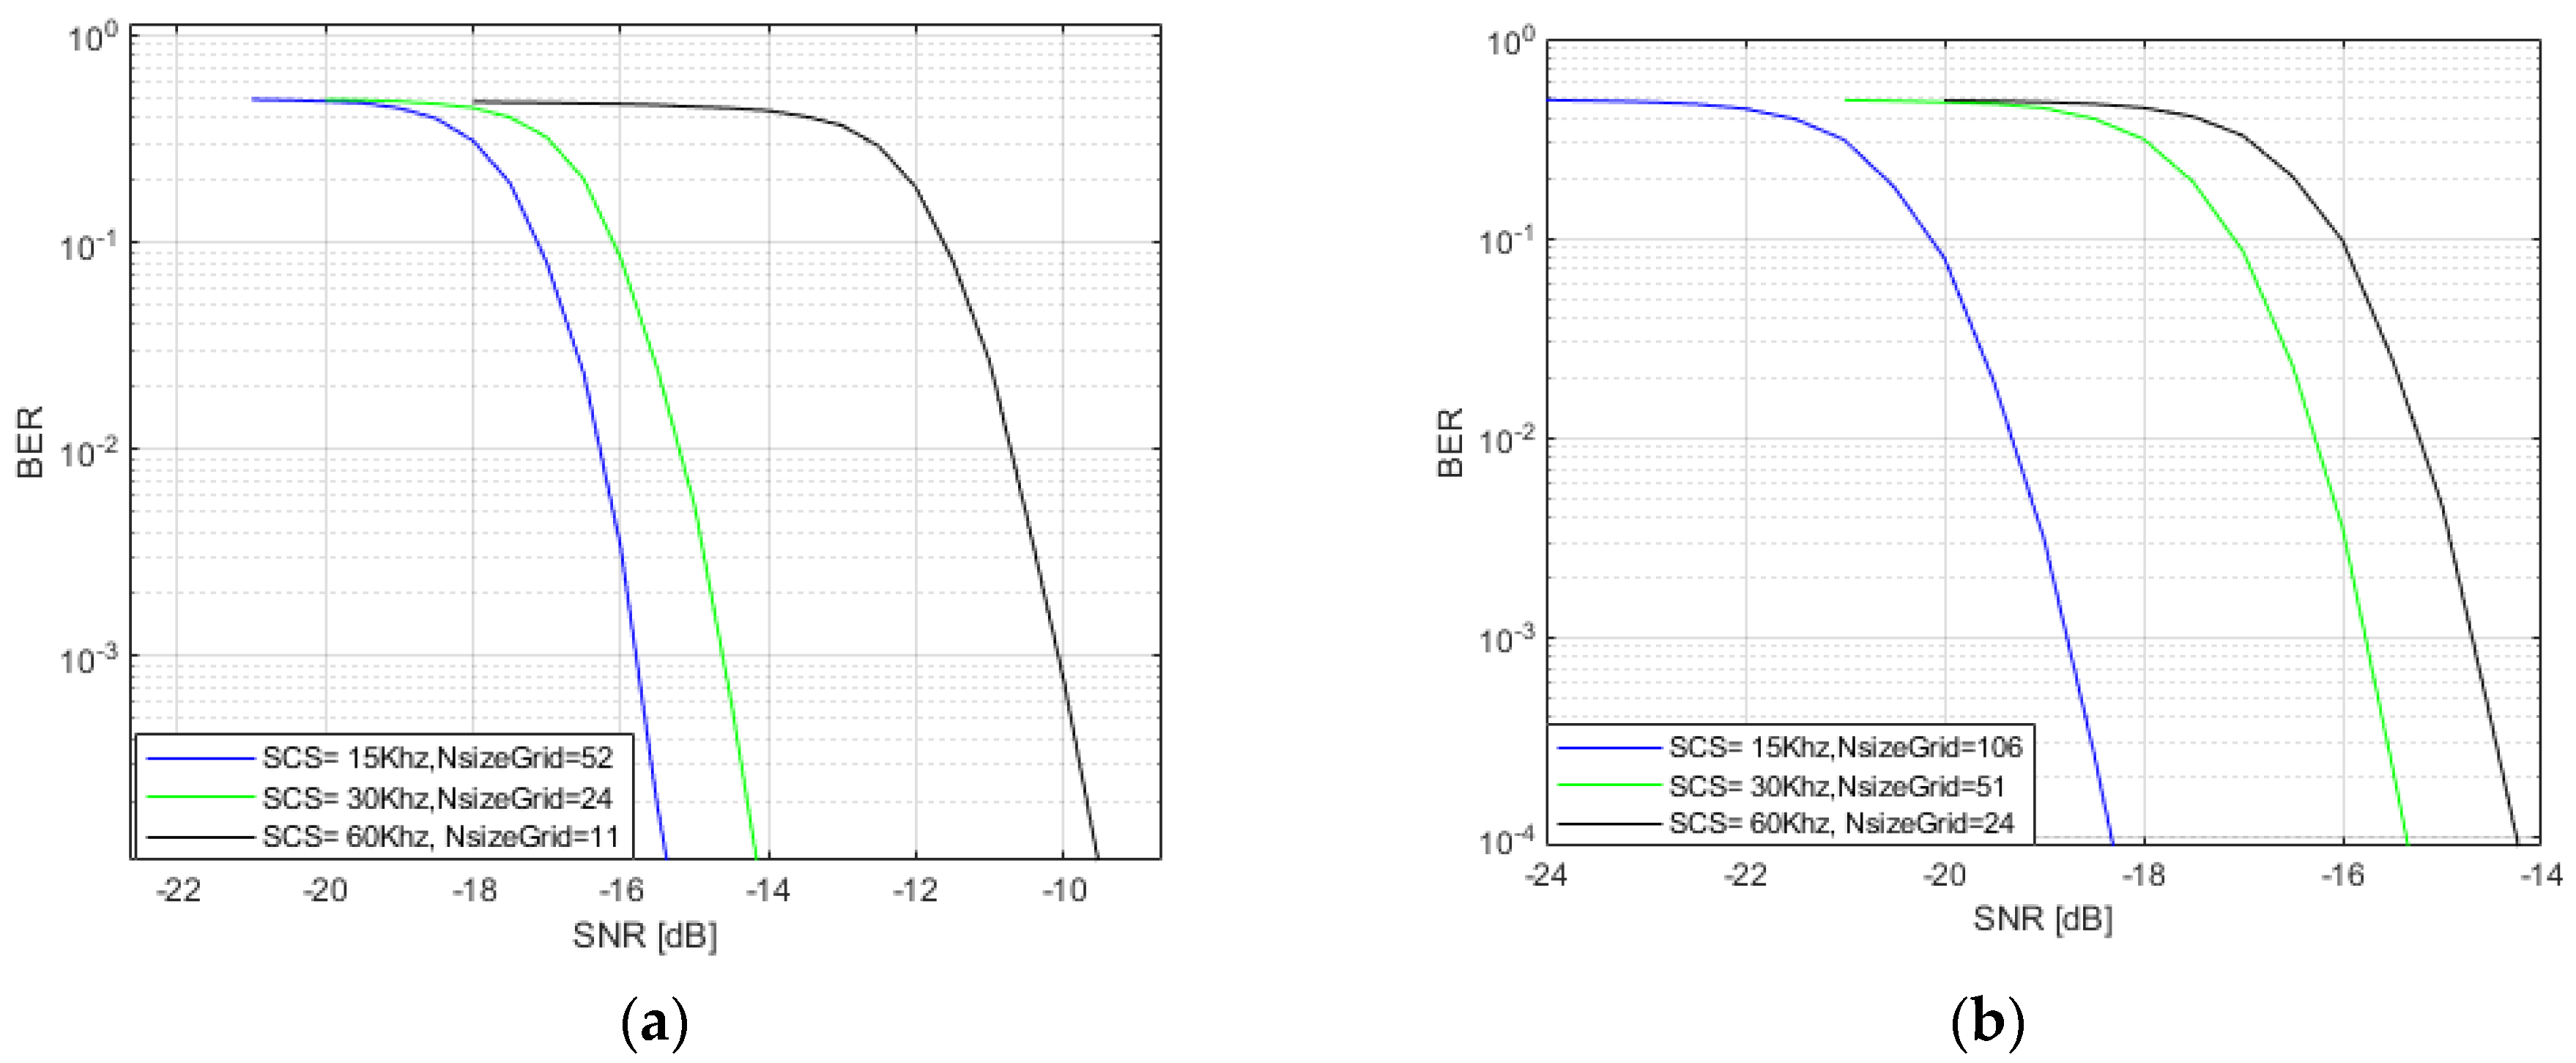
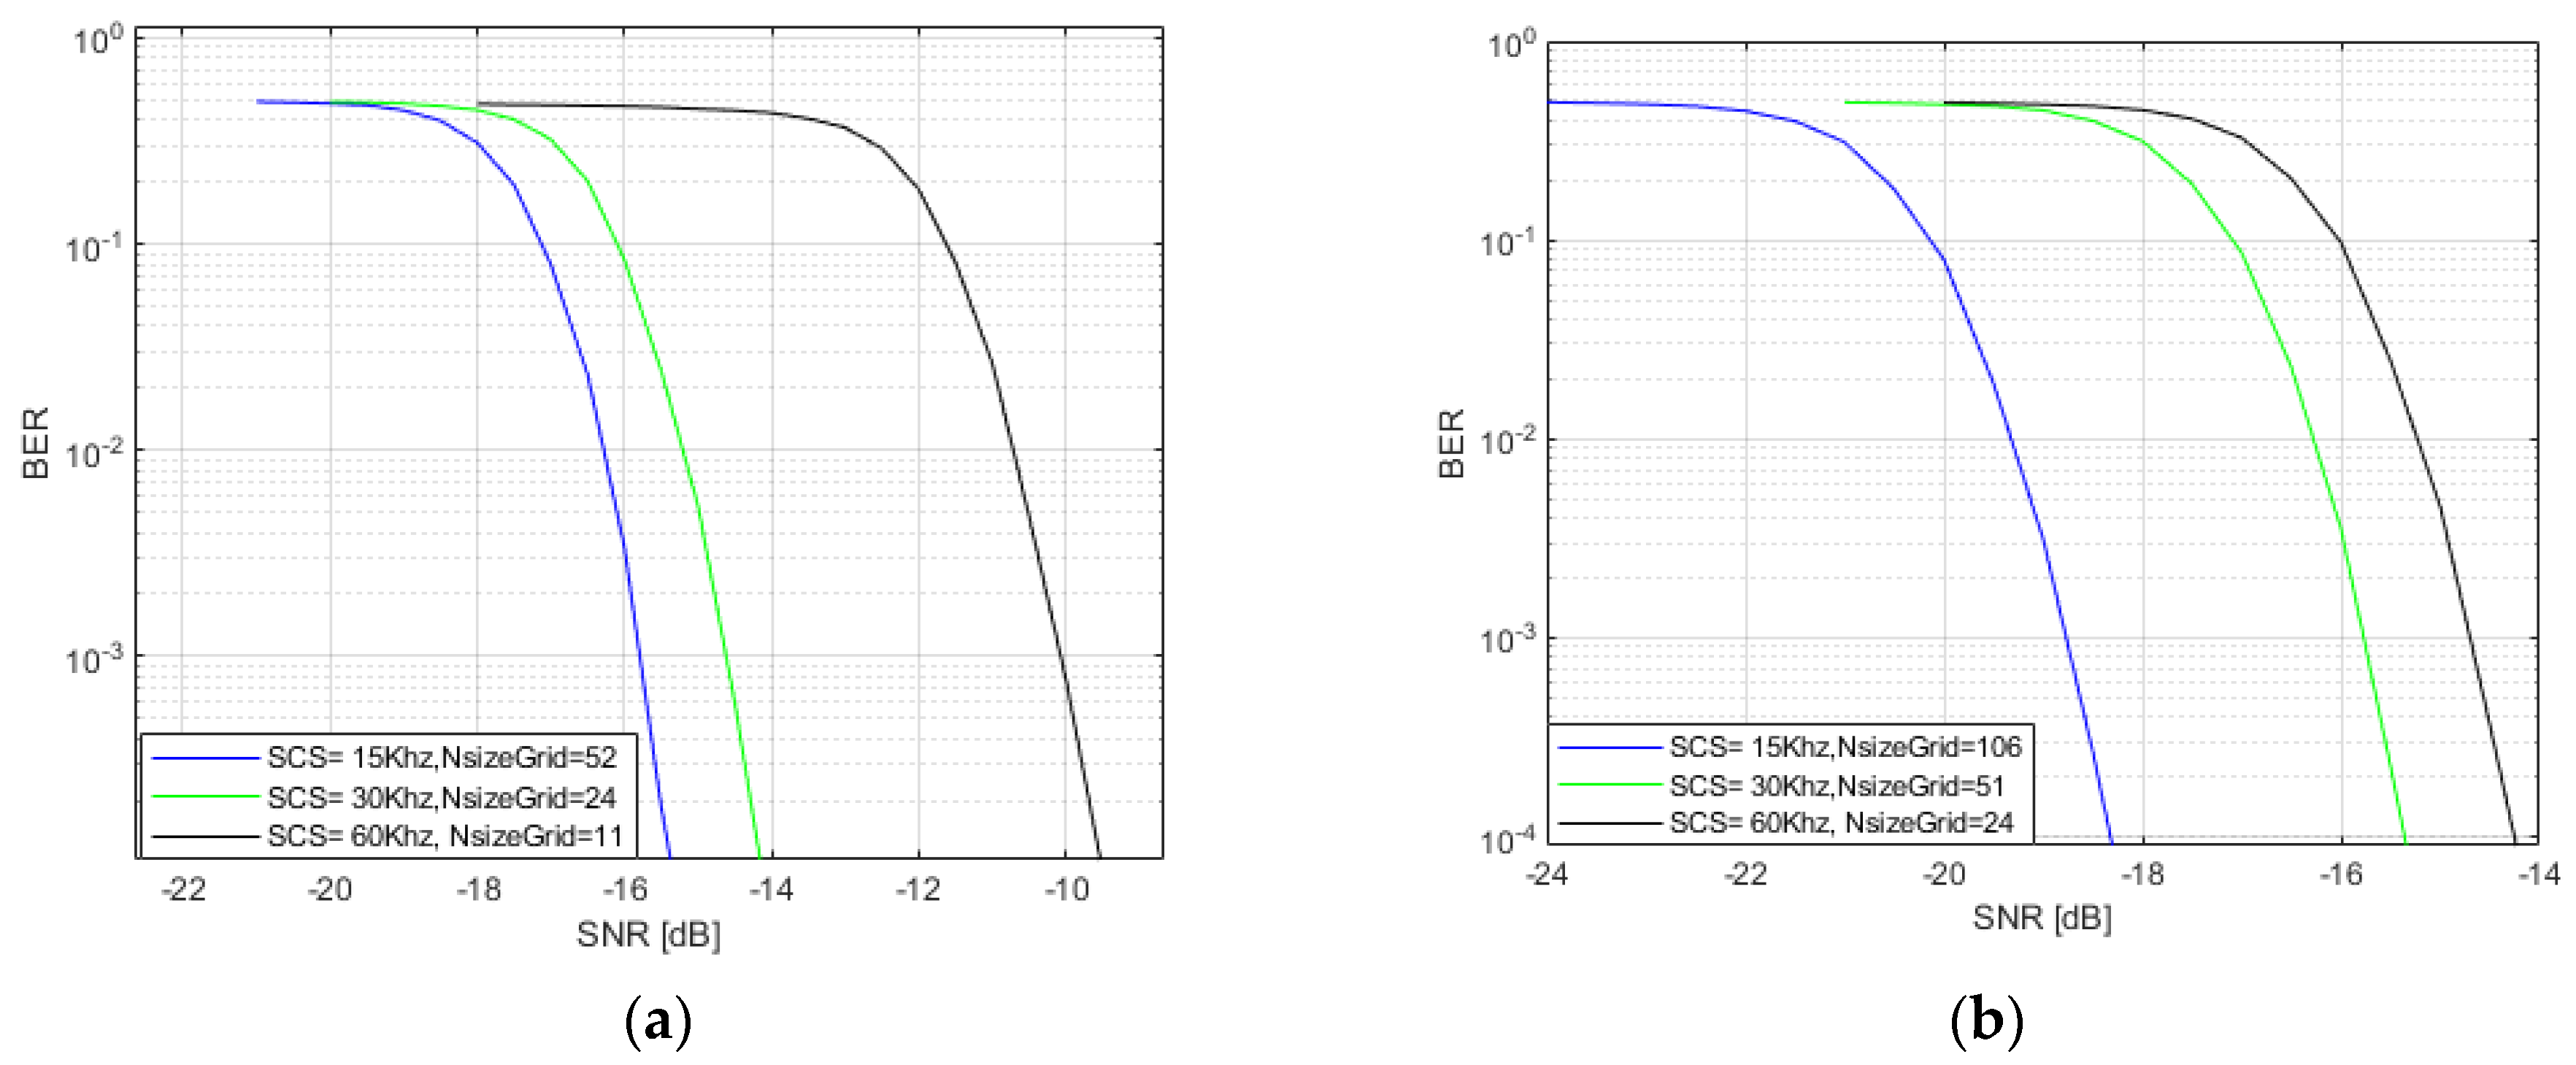
Figure 3 depicts the BER vs. SNR curves, where various values of SCS, NRB, and BW are considered. In Figure 3a, a BW of 10 MHz, SCS values of {15, 30, 60} kHz, and NRB values of {52, 24, 11} are taken into account. Upon analyzing the outcomes, it is evident that at a probability of error of 10−3, the SNR value for SCS = 15 kHz is −15.79 dB, for SCS = 30 kHz it is −14.62 dB, and for the SCS = 60 kHz curve, it is −10.07 dB. In Figure 3b, the outcomes are presented for a BW of 20 MHz, SCS values of {15, 30, 60} kHz, and NRB values of {106, 51, 24}. For a probability of 10−3, the SNR value for SCS = 15 kHz is −18.85 dB, for SCS = 30 kHz it is −15.76 dB, and for SCS = 60 kHz it is −14.69 dB. Consequently, the curve that exhibits the best performance for a BW of 20 MHz is with SCS = 15 kHz and NRB = 10. It is evident that, with a larger BW there is a greater NRB, which translates to higher performance of the PDCCH channel.
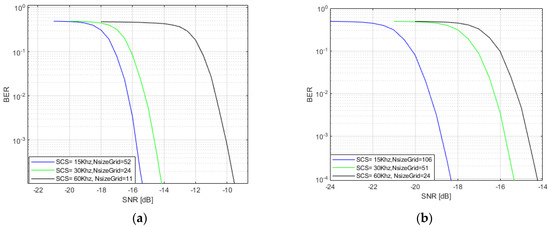
Figure 3.
BER vs. SNR for BW = {10, 20} MHz and several values of SCS and NRB. (a) MHz and (b) MHz.
Figure 4 shows the BER vs. SNR curves for various values of BW, SCS, and NRB. In Figure 4a, a fixed SCS of 15 kHz is considered, with BW values of {5, 10, 20, 30} MHz and NRB values of {25, 52, 106, 160}. Upon analyzing the results, it is evident that, for a probability of error of 10−3, the SNR value for BW = 5 MHz is −14.72 dB, for BW = 10 MHz it is −15.79 dB, for BW = 20 MHz it is −18.85 dB, and for BW = 30 MHz it is −21.73 dB. In Figure 4b, a fixed NRB value of 51 is considered, with BW values of {15, 30, 50} MHz and SCS values of {15, 30, 60} kHz. Upon analyzing the results, it is evident that, at a probability of error of 10−3, the SNR value for the curve with BW = 15 MHz and SCS = 15 kHz is −15.73 dB, for the curve with BW = 30 MHz and SCS = 30 kHz it is −15.76 dB, and for the curve with BW = 50 MHz and SCS = 60 kHz it is −15.78 dB.
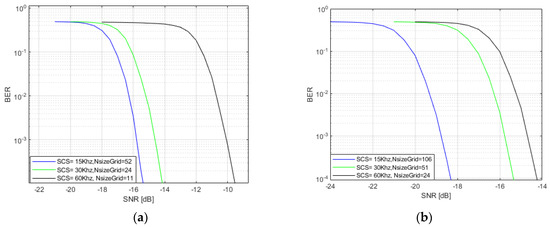
Figure 4.
BER vs. SNR for different values of BW, SCS and NBR. (a) SCS of 15 kHz, BW = {5, 10, 20, 30} MHz and NRB = {25, 52, 106, 160}. (b) NRB = 51, BW = {15, 30, 50} MHz and SCS = {15, 30, 60} kHz.
4.2. Lossy System
Figure 5 shows the curves of BER as a function of PTx for the lossy channel are shown. It considers an angle of the UE (hUE) of 60°, heights of the UE (hUE) = [1, 1.5, 4, 5, 8, 9, 10] m and a frequency range FR1. Upon analyzing the results, it is evident that at a probability of error of , the PTx value for the hUE1 curve is 0.4199 dBm, for the hUE2 curve it is 0.3975 dBm, for the hUE3 curve it is 0.1918 dBm, and for the hUE curve it is 0.1322 dBm.
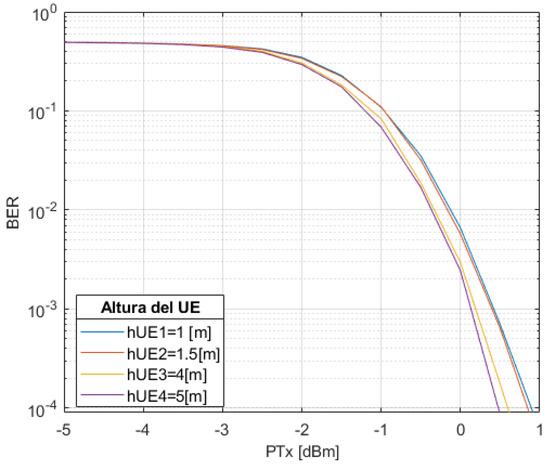
Figure 5.
BER vs. PTx curves with angUE = 60°, hUE = [1, 1.5, 4, 5] m.
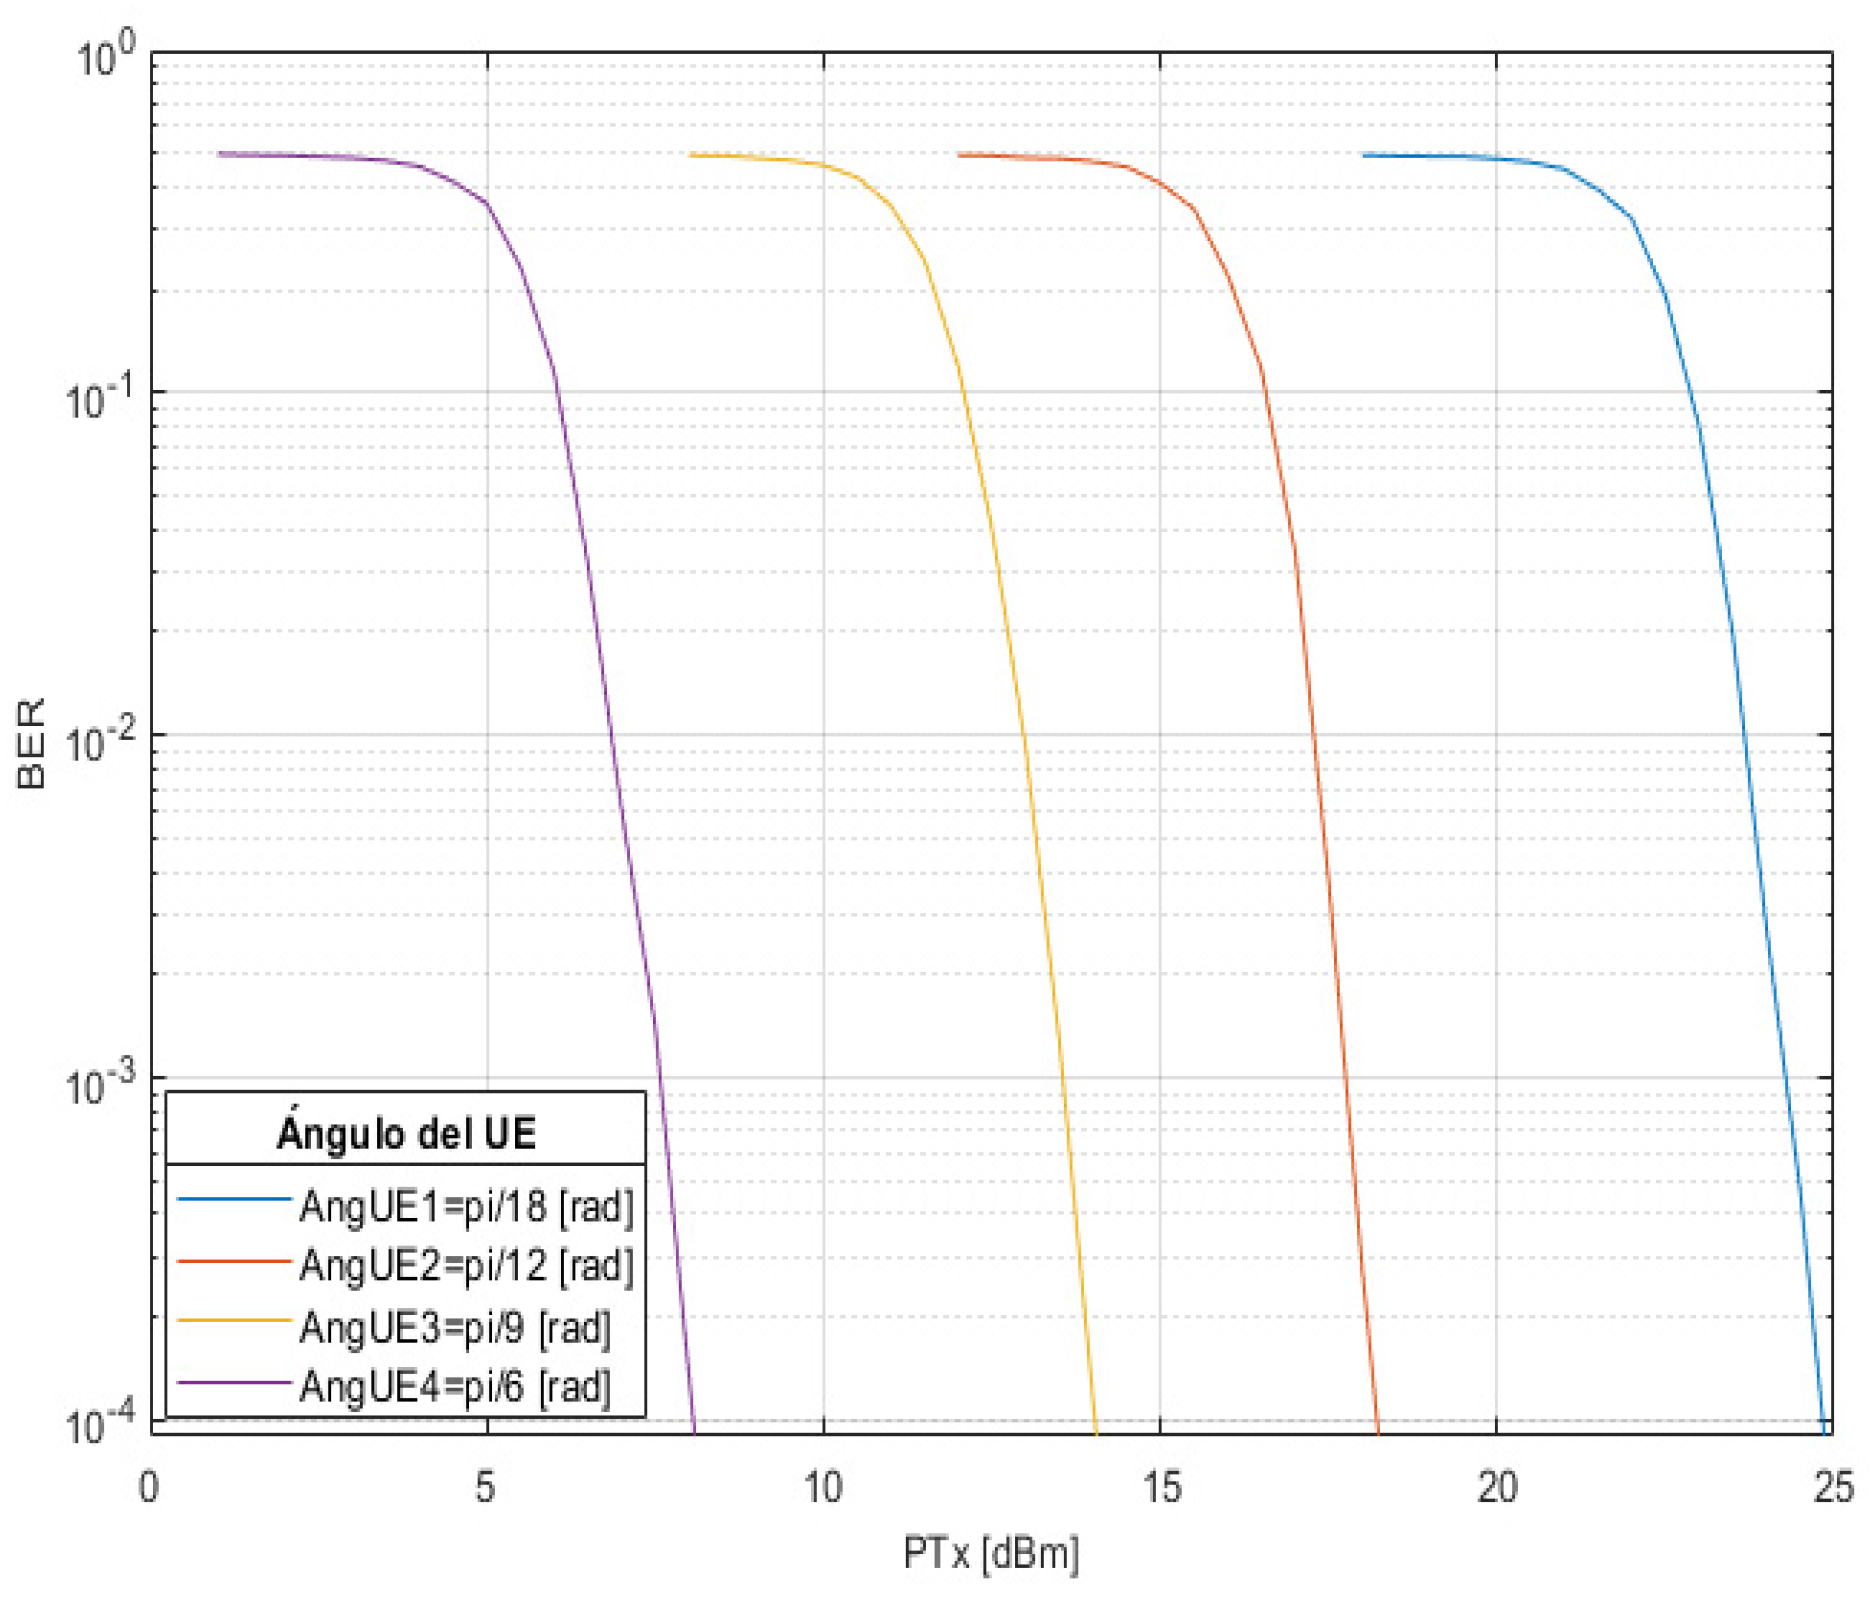
Figure 6 shows the BER vs. PTx curves for the constant hUE = 1.5 m, angUE = {π/18, π/12, π/19, π/6} rad for the FR1 frequency range. Upon analyzing the results, it is observed that, at a 10−3 error probability, the PTx value for the AngUE1 curve is 24.28 dBm, for AngUE2 it is 17.75 dBm, for AngUE3 it is 13.55 dBm, and for AngUE4 it is 7.57 dBm. At a , error probability, the PTx value for the AngUE1 curve is 23.67 dBm, for AngUE2 it is 17.28 dBm, for AngUE3 it is 12.97 dBm, and for AngUE4 it is 6.85 dBm.
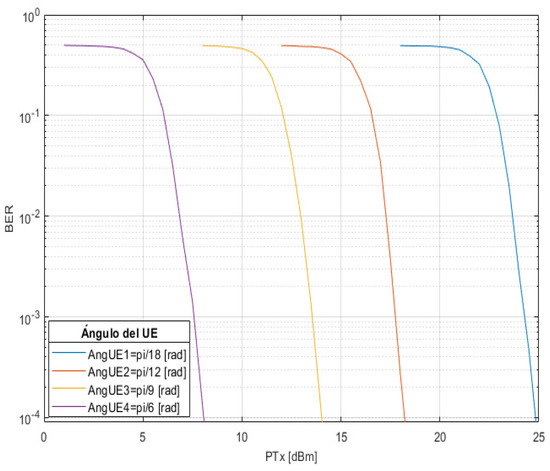
Figure 6.
BER vs. PTx for hUE = 1.5 m, angUE = {π/18, π/12, π/19, π/6} rad.
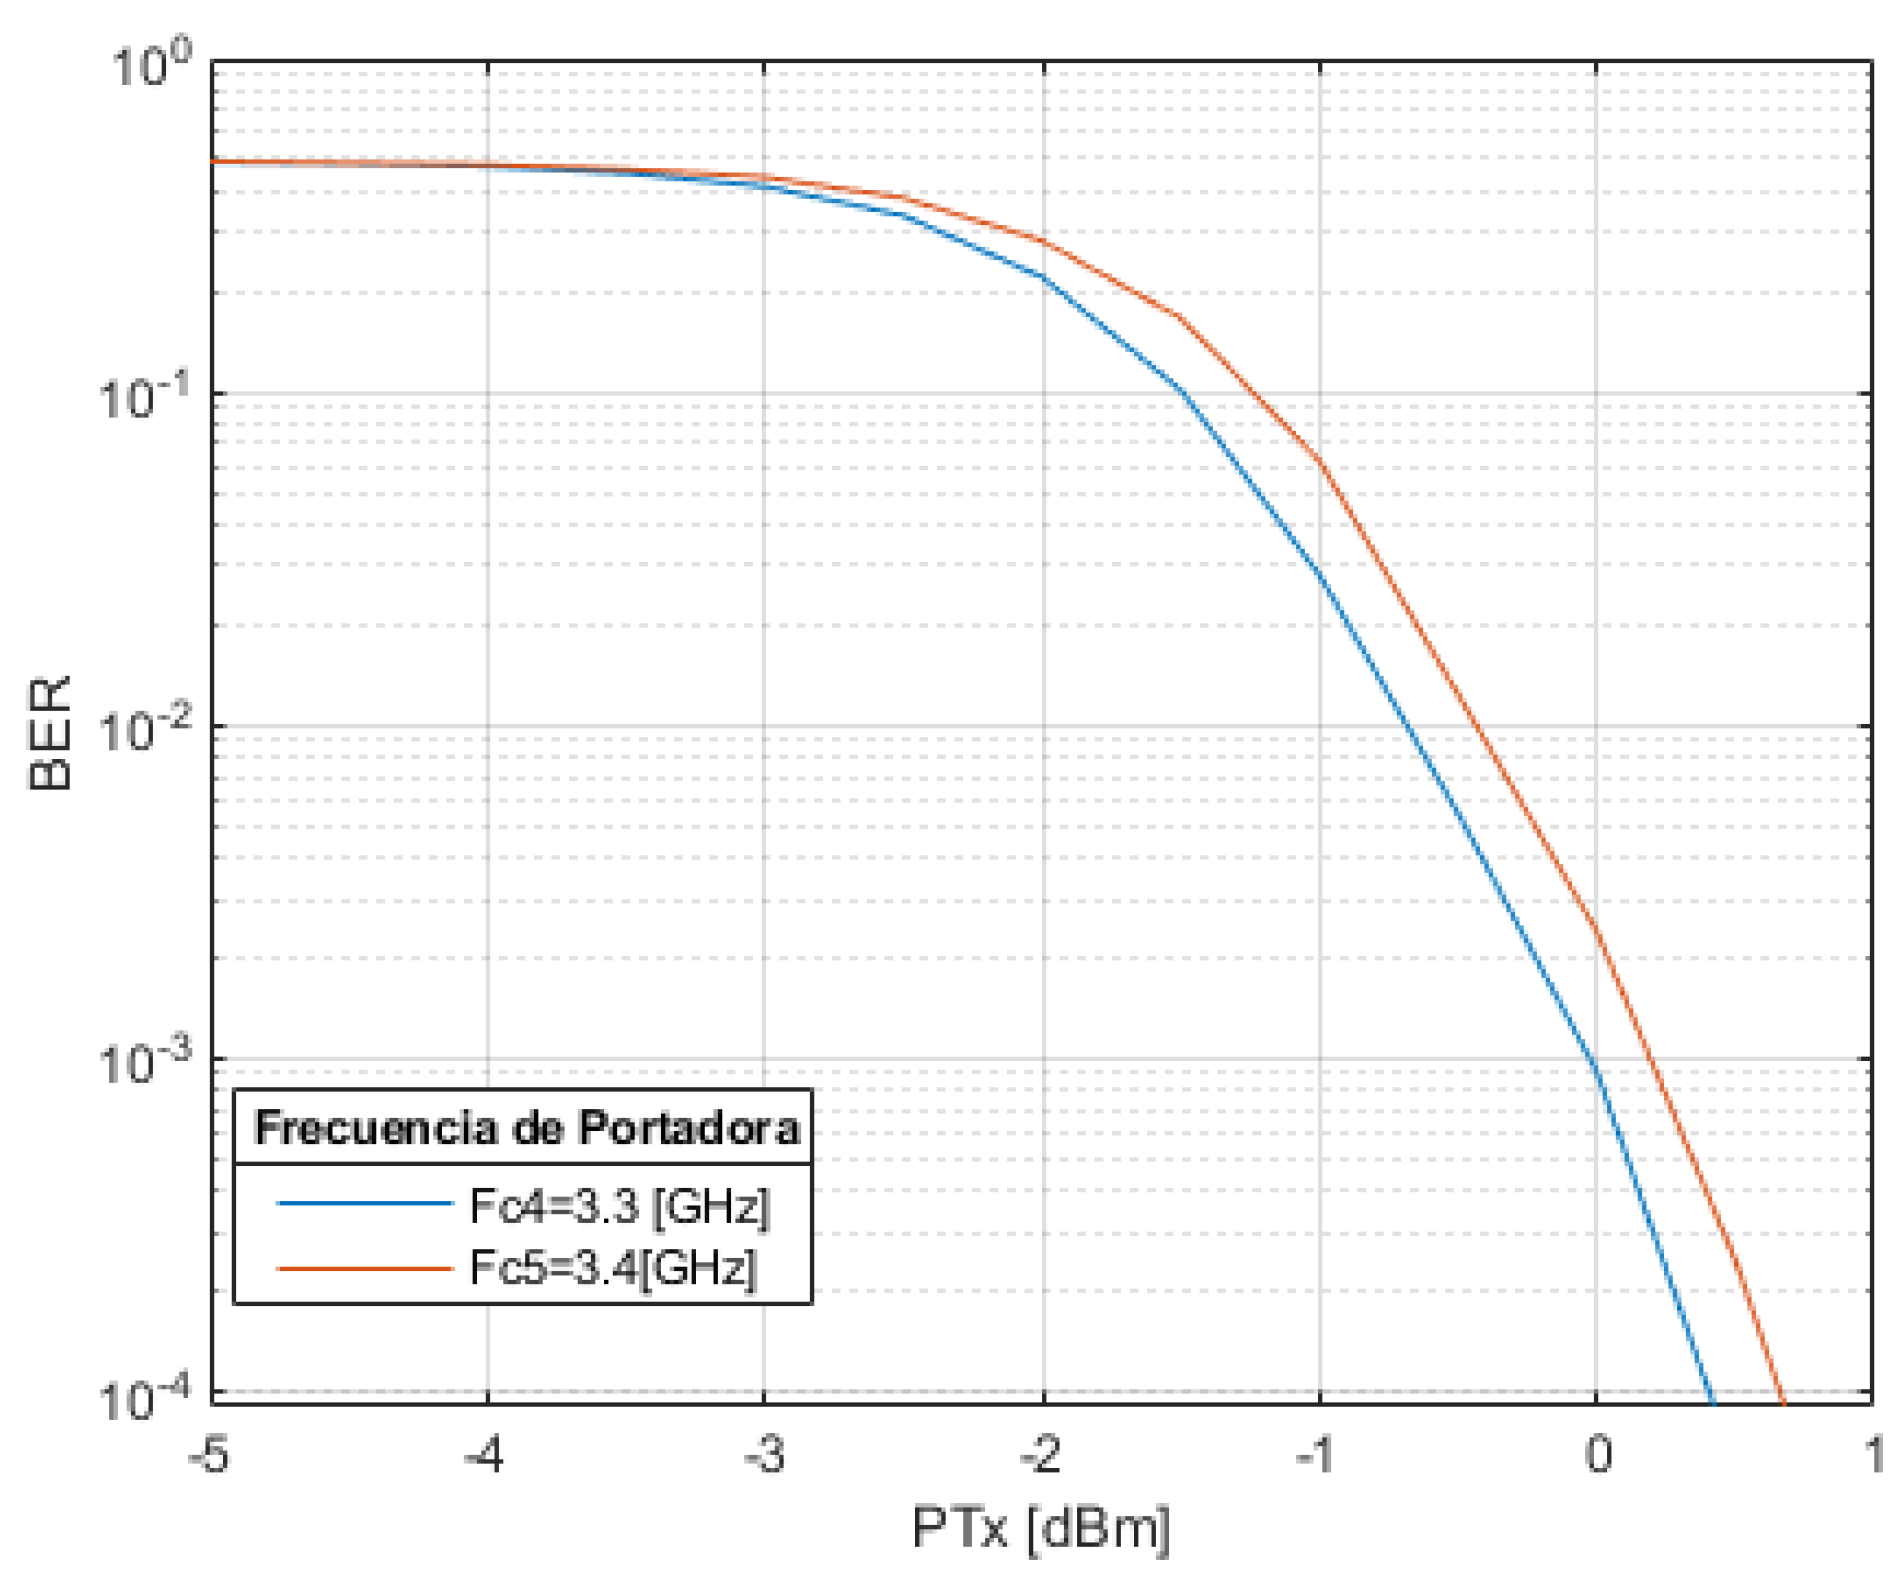
Figure 7 illustrates the results obtained when considering a hUE = 1.5 m, hUE = 60°, and different frequencies (Fc) = [3.5, 6, 24.5] GHz. It can be observed that, at a error probability, the PTx value for the Fc1 curve is 0.304 dBm, for the Fc2 curve it is 5.152 dBm, and for the Fc3 curve it is 17.272 dB.
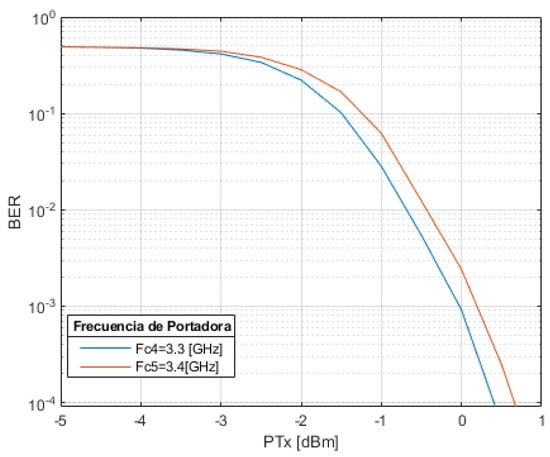
Figure 7.
BER vs. PTx for hUE = 1.5 m, hUE = 60°, and Fc = [3.5, 6, 24.5] GHz.
5. Conclusions
In conclusion, this study has addressed the performance evaluation of the physical downlink control channel (PDCCH) in two different scenarios: one without losses and another with losses generated by the path. Through the implementation of a transmission–reception system in MATLAB R2021b and the analysis of BER vs. SNR and BER vs. transmit power curves, valuable insights have been gained into how key parameters impact channel performance. In the first scenario, where a lossless channel was considered, the significance of the number of resource blocks (NRB) in enhancing PDCCH performance was highlighted. As the number of NRB increases, a reduction in the probability of bit errors was observed, indicating a more reliable transmission. The second scenario, incorporating channel losses, revealed the positive influence of user equipment (UE) height and elevation angle on attenuation loss reduction. By increasing the UE’s height or elevation angle, the link distance decreased, leading to improved BER performance and ultimately enhancing the system’s efficiency. Furthermore, the analysis of carrier frequency variation demonstrated that higher carrier frequencies result in higher bit error rates, underscoring the importance of carefully considering frequency selection in system design.
Author Contributions
Conceptualization, M.C.P.-P.; methodology, P.B.-C., F.G.-G. and M.C.P.-P.; software, P.B.-C.; validation, P.B.-C., F.G.-G. and M.C.P.-P.; formal analysis, P.B.-C., F.G.-G. and M.C.P.-P.; investigation, P.B.-C.; resources, F.G.-G.; data curation, P.B.-C.; writing—original draft preparation, P.B.-C.; writing—review and editing, F.G.-G. and M.C.P.-P.; visualization, P.B.-C. and F.G.-G.; supervision, M.C.P.-P.; project administration, M.C.P.-P.; funding acquisition, F.G.-G. All authors have read and agreed to the published version of the manuscript.
Funding
This research was funded by Escuela Politécnica Nacional.
Institutional Review Board Statement
Not applicable.
Informed Consent Statement
Not applicable.
Data Availability Statement
Data are contained within the article.
Conflicts of Interest
The authors declare no conflict of interest.
References
- 3GPP. Study on Scenarios and Requirements for Next Generation Access Technologies; 3GPP TR 38.913; 3GPP: Sophia Antipolis, France, 2017. [Google Scholar]
- Sudhamani, C.; Roslee, M.; Tiang, J.J.; Rehman, A.U. A Survey on 5G Coverage Improvement Techniques: Issues and Future Challenges. Sensors 2023, 23, 2356. [Google Scholar] [CrossRef] [PubMed]
- Audhya, G.K.; Sinha, K.; Ghosh, S.C.; Sinha, B.P. A survey on the channel assignment problem in wireless networks. Wirel. Commun. Mob. Comput. 2011, 11, 583–609. [Google Scholar] [CrossRef]
- 3GPP. Study on New Radio (NR) Access Technology (Release 15); 3GPP TS 39.912 Tech. Rep. V15.2.0; 3GPP: Sophia Antipolis, France, 2018. [Google Scholar]
- 3GPP. Services Provided by the Physical Layer (Release 16); 3GPP TS 38. 212 Tech. Rep V16.1.0; 3GPP: Sophia Antipolis, France, 2020. [Google Scholar]
- Braun, V.; Schober, K.; Tiirola, E. 5G NR physical downlink control channel: Design, performance and enhancements. In Proceedings of the 2019 IEEE Wireless Communications and Networking Conference (WCNC), Marrakesh, Morocco, 15–18 April 2019; pp. 1–6. [Google Scholar]
- Mozaffari, M.; Wang, Y.P.E.; Kittichokechai, K. Blocking Probability Analysis for 5G New Radio (NR) Physical Downlink Control Channel. In Proceedings of the ICC 2021—IEEE International Conference on Communications, Montreal, QC, Canada, 14–23 June 2021; pp. 1–6. [Google Scholar] [CrossRef]
- MATLAB and Statistics Toolbox Release 2021b; The MathWorks, Inc.: Natick, MA, USA, 2021.


Disclaimer/Publisher’s Note: The statements, opinions and data contained in all publications are solely those of the individual author(s) and contributor(s) and not of MDPI and/or the editor(s). MDPI and/or the editor(s) disclaim responsibility for any injury to people or property resulting from any ideas, methods, instructions or products referred to in the content. |
© 2023 by the authors. Licensee MDPI, Basel, Switzerland. This article is an open access article distributed under the terms and conditions of the Creative Commons Attribution (CC BY) license (https://creativecommons.org/licenses/by/4.0/).