1. Introduction
Liquid nitrogen is a cryogenic fluid as its temperature is below −150 °C (123 K), i.e., −196 °C (77 K). It should be managed with caution as it could result in extreme frost bites and other health hazards. It finds its application in multiple industries, for example, in space exploration for rocket propulsion, in metal working to shrink-fit components, in the food industry to preserve food products and so on.
In 2009, Sun et al. [
1] experimentally investigated the effect of different spacer gases over a wide range of temperature (77 K–300 K) and pressure (10
−3 Pa–10
5 Pa) and concluded that Ar has the least apparent thermal conductivity among all the gases assessed. Similarly, Wei et al. [
2] experimentally investigated heat transfer across a Perforated Multi-Layer Insulation Blanket (PMLIB) and inferred that the shape and structure of a PMLIB play a significant role in the accuracy of its performance test. Bapat et al. [
3] also predicted the performance of MLI incorporating aluminized mylar (12 µm) and glass fabric (76.2 µm). The effective thermal conductivity of MLI seems to increase with the increase in the number of layers due to gas conduction. Later, Johnson et al. [
4] experimentally evaluated several specimens of MLI in order to calculate their optimal layer density. Then, Funke et al. [
5] conducted a comparative study between multiple insulations, taking liquid hydrogen and liquified natural gas (LNG) as the process fluid. They found that the heat flux (q) and effective thermal conductivity (k
e) were the lowest for the MLI systems under consideration. In another study, Fesmire et al. [
6] conducted extensive experimentation on six different MLI configurations.
In the current study, a super-insulated pipe incorporating Multi-Layer Insulation (MLI) and vacuum was designed and numerically analyzed on ANSYS to observe its thermal behavior at multiple flow rates, i.e., 250, 500 and 1000 LPH. The aim of this study is to determine heat flow through temperature distribution. The results obtained were then validated through Experimental Fluid Dynamics (EFD) data compiled by Lim et al. [
7].
2. Materials and Methods
MLI is most effective for extremely large temperature gradients as considered in this study. MLI consists of aluminized mylar (0.08 mm) and dacron netting (0.02 mm) due to its lower heat transfer rates. Aluminized mylar acts as a reflector for radiation while dacron netting minimizes the thermal contact area between adjacent aluminized mylar layers. SS 304 L-grade pipes were used owing to their better strength at extremely low temperatures. Argon was introduced as vacuum due to its inert nature. A high-density polyethylene (HDPE) spacer was used due to its lower thermal conductivity and high strength. A single layer comprises a combination of one aluminized mylar layer and one dacron netting layer.
The flow was turbulent in this study. The total thermal resistance is determined by the following:
Here,
and
are convective and conductive heat transfer coefficients,
is the length of the pipe and
r refers to the radius of either the pipe or insulation.
Aop and
Aip is outer and inner pipe surface area respectively. The convective heat transfer coefficient is calculated using the Nusselt number (Nu) [
8].
3. Modelling and Simulation
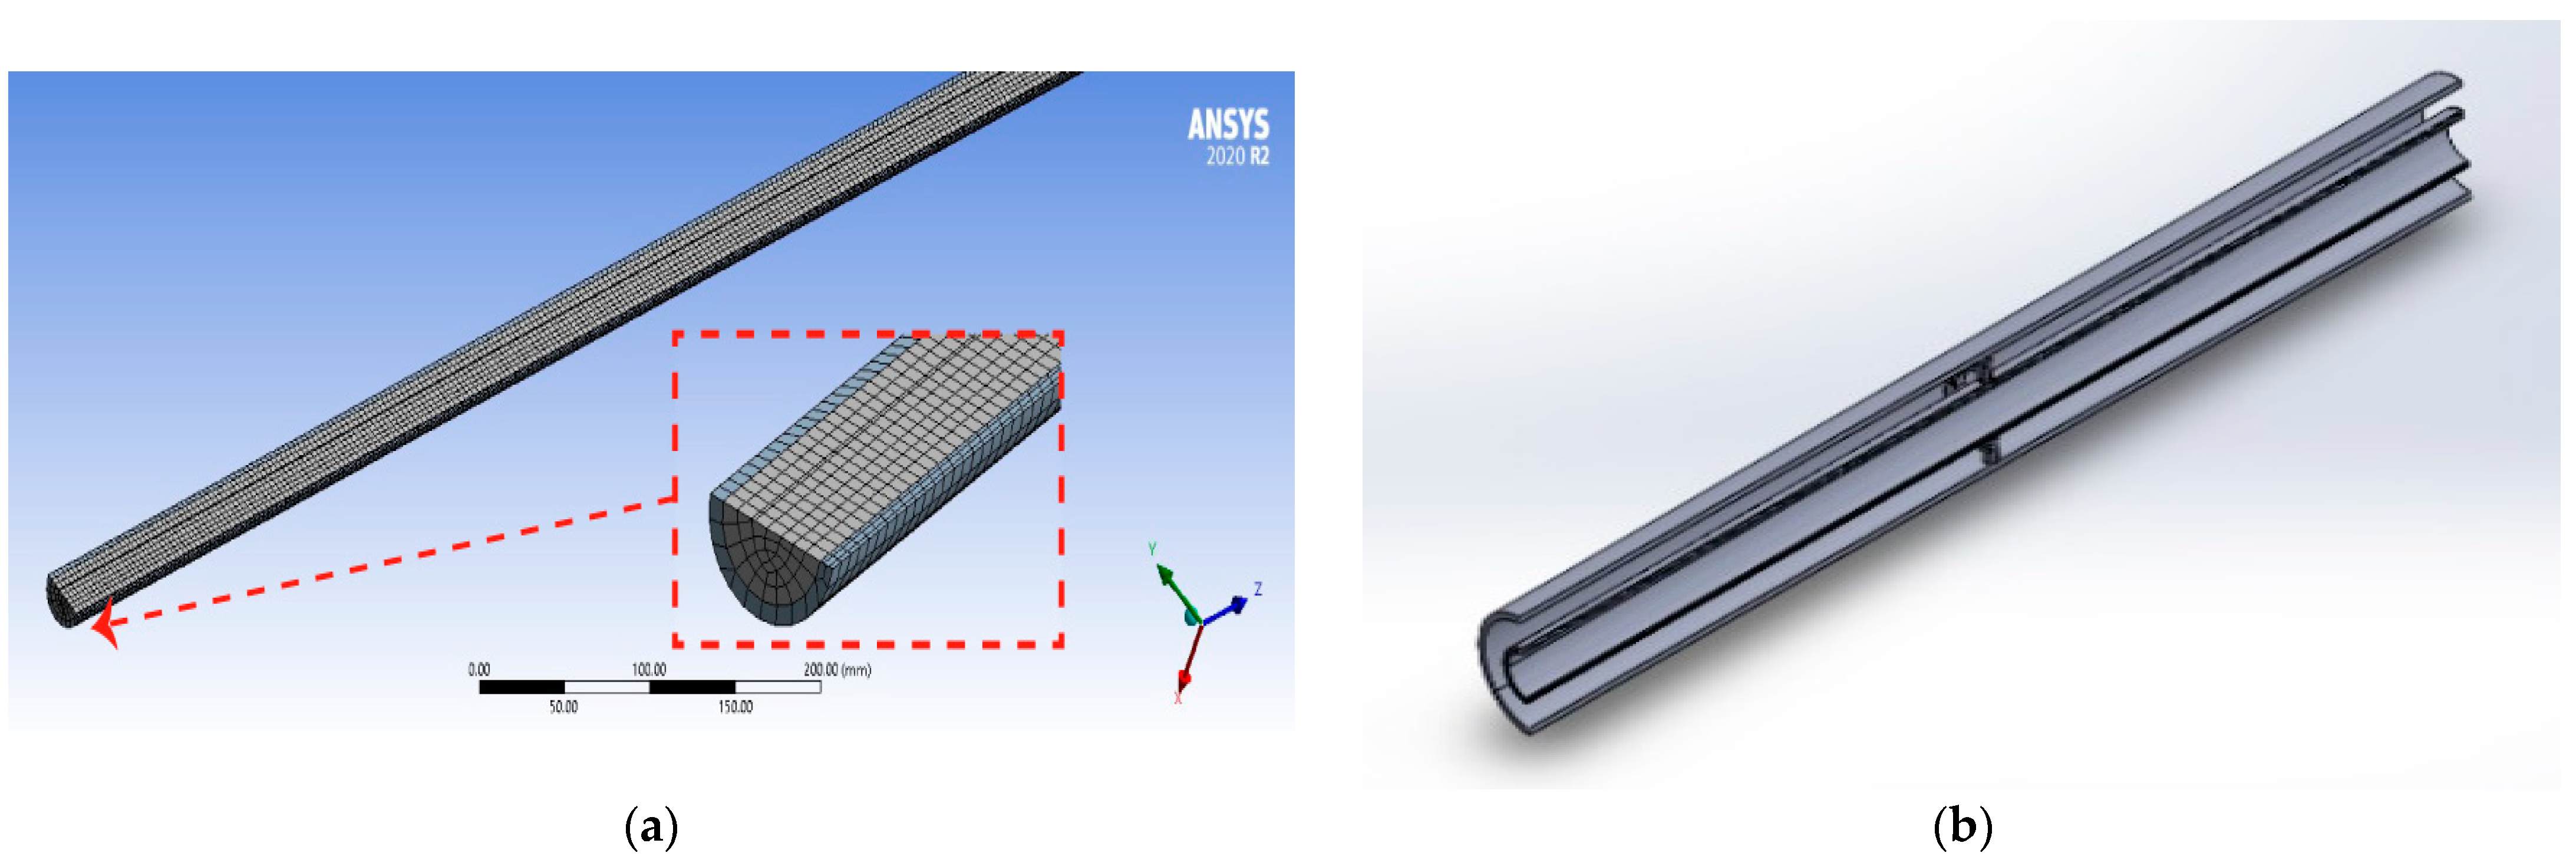
The insulated pipe model was developed in SOLIDWORKS. The length of the pipe is 1 m and its inner diameter is 25.4 mm. The surface contact area of the spacer is kept to a minimum to reduce the heat conduction between layers and the outer jacketed pipe.
The mesh size in
Figure 1a was kept to 10 mm.
Figure 1b shows sectional view of the super insulated pipe developed for numerical analysis. The SOLIDWORKS model was imported into ANSYS for thermal analysis. k-epsilon turbulence model and SIMPLE (Semi-Implicit technique for Pressure Linked Equations) method was implemented. The solution was converged after 85 iterations (
Table 1).
4. Results
The following results were obtained after the completion of analysis (
Table 2).
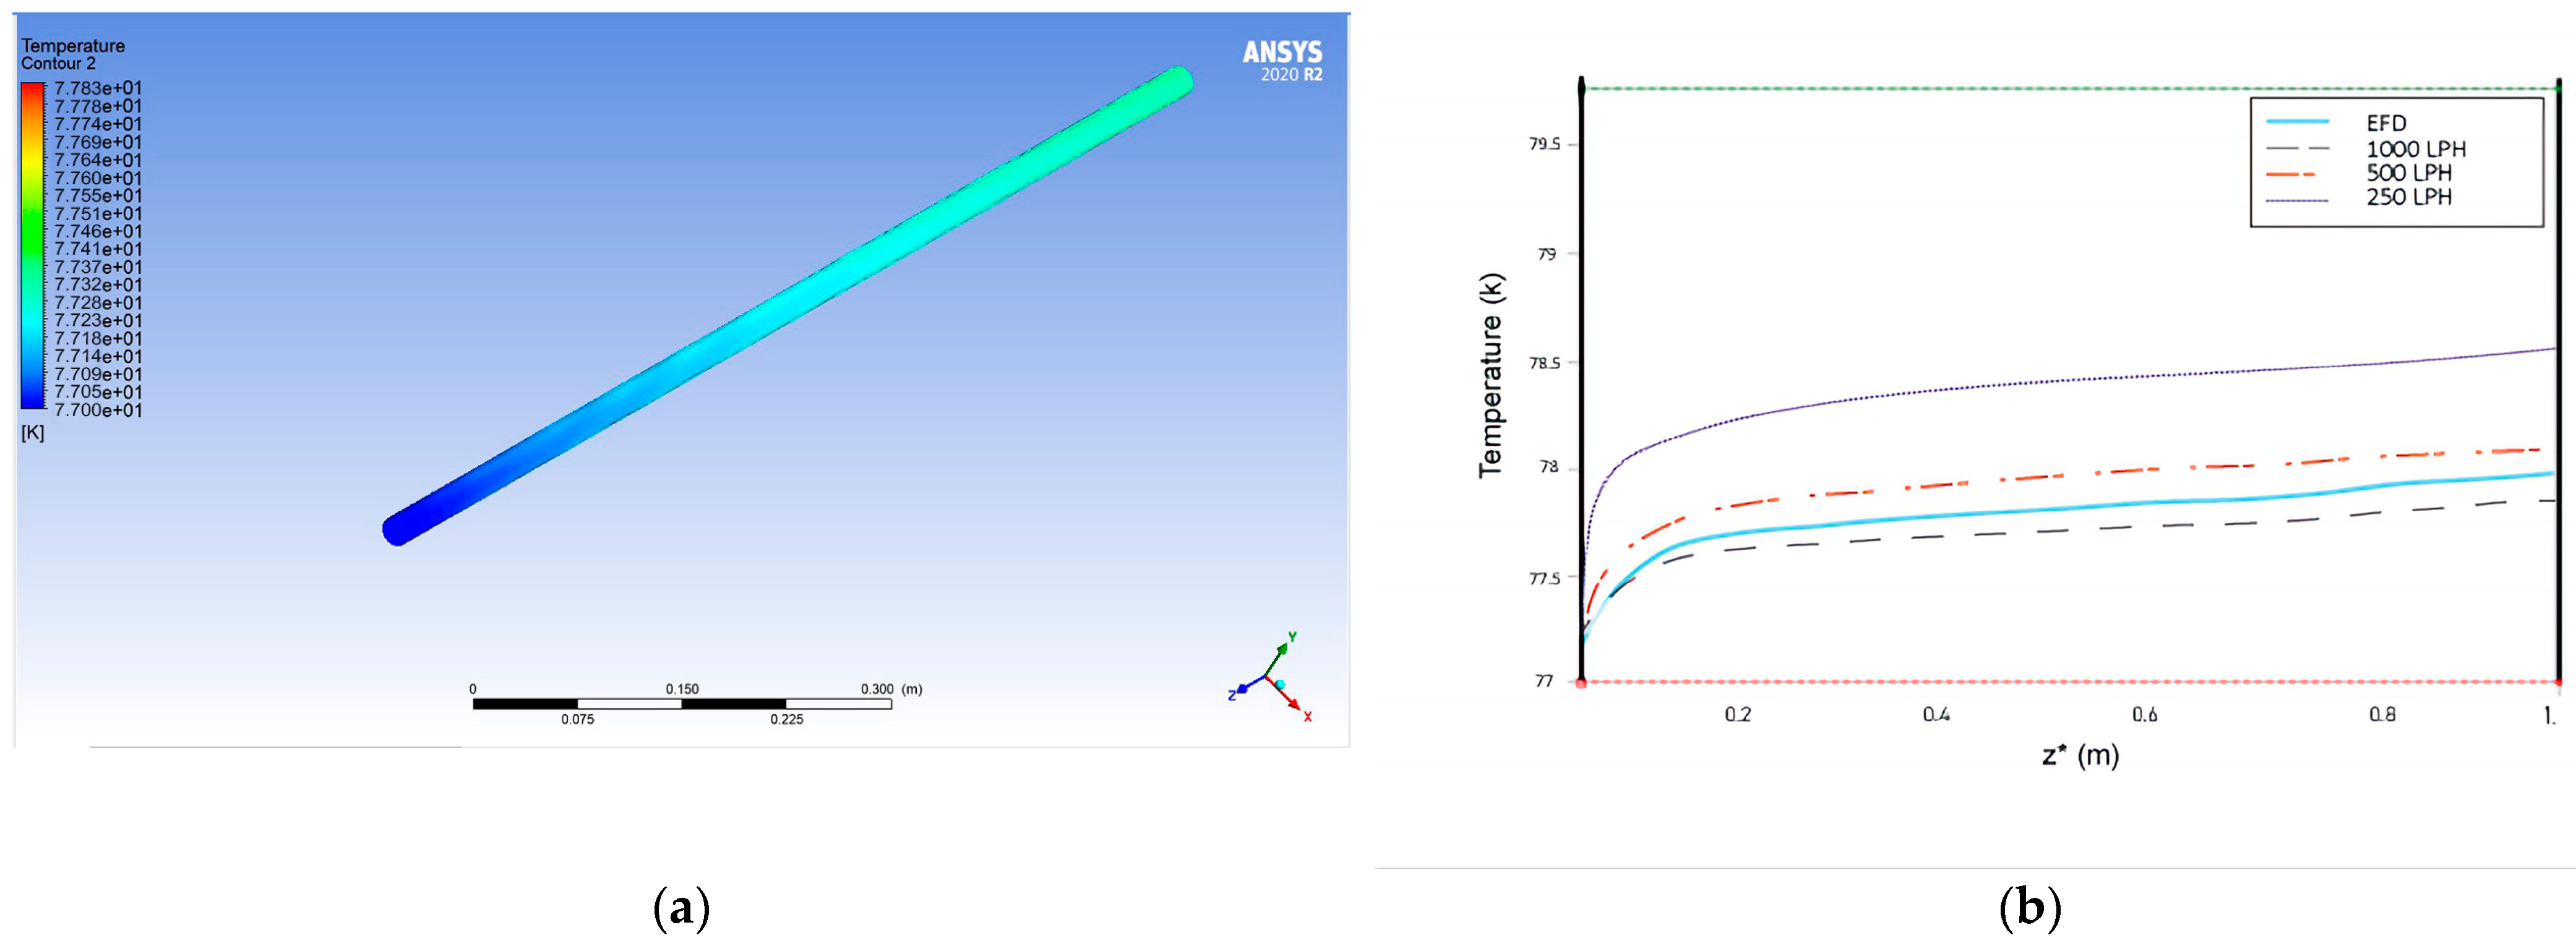
Figure 2a shows that the temperature of LN
2 increases along the direction of flow. The temperature contour is set between 77 K to 77.8 K to compensate minor deviation in temperature. This rise is quite abrupt in the beginning due to the large temperature gradient, while this rise in temperature becomes gradual along the length as the temperature gradient becomes small. Moreover, it can be seen that the boundary wall experiences a higher temperature than the asymmetric line due to frictional effect as it delays flow along the boundary.
Figure 2b shows a comparison between current analysis with the EFD trend for 1000 LPH developed in previous studies [
7]. There is a minor deviation (i.e., less than 5%) in the analysis results from the Experimental Fluid Dynamics (EFD) trend. The lower flow rates seem to follow the same trend but with a slightly higher temperature gradient. This proves that lower flow rates are more prone to temperature variations than higher flow rates. Lower flow rates increase interaction time between boundary wall and the LN
2 resulting in higher temperature variations. As the temperature gradient between ambient (i.e., 300 K) and LN
2 (i.e., 77 K) is quite high.
5. Conclusions
It has been concluded from this study that the temperature gradient along the flow reduces with the increase in the flow rate. Moreover, the boundary wall experiences a higher temperature than the asymmetric line. Temperature distributions are within the range of 77 K to 79 K for inlet volume flow rates of 250 LPH, 500 LPH and 1000 LPH. The temperature profile follows a hyperbolic trend for the LN2 flow inside the super-insulated pipe.
Author Contributions
D.B.N. conceived the idea and developed the model. D.B.N. and M.A. (Maaz Ahmed) conducted numerical analysis and drafted the manuscript. H.S.M. provided the necessary guidance on numerical analysis. A.M.H. conducted analytical calculations. M.A. (Muzaffar Ali) reviewed the analysis results and supervised the project. All authors have read and agreed to the published version of the manuscript.
Funding
This research received no external funding.
Institutional Review Board Statement
Not applicable.
Informed Consent Statement
Not applicable.
Data Availability Statement
The data is not available online to avoid any misuse of data.
Conflicts of Interest
The authors declare no conflict of interest.
References
- Sun, P.J.; Wu, J.Y.; Zhang, P.; Xu, L.; Jiang, M.L. Experimental study of the influences of degraded vacuum on multilayer insulation blankets. Cryogenics 2009, 49, 719–726. [Google Scholar] [CrossRef]
- Wei, W.; Li, X.; Wang, R.; Li, Y. Effects of structure and shape on thermal performance of Perforated Multi-Layer Insulation Blankets. Appl. Therm. Eng. 2009, 29, 1264–1266. [Google Scholar] [CrossRef]
- Bapat, S.L.; Narayankhedkar, K.G.; Lukose, T.P. Performance prediction of multilayer insulation. Cryogenics 1990, 30, 700–710. [Google Scholar] [CrossRef]
- Johnson, W.L. Thermal analysis of low layer density multilayer insulation test results. In Proceedings of the ADVANCES IN CRYOGENIC ENGINEERING: Transactions of the Cryogenic Engineering Conference–CEC, Spokane, WA, USA, 13–17 June 2011; pp. 1519–1526. [Google Scholar] [CrossRef]
- Funke, T.; Haberstroh, C. A calorimeter for measurements of multilayer insulation at variable cold temperature. Phys. Procedia 2015, 67, 1062–1067. [Google Scholar] [CrossRef]
- Fesmire, J.E.; Johnson, W.L. Cylindrical cryogenic calorimeter testing of six types of multilayer insulation systems. Cryogenics 2018, 89, 58–75. [Google Scholar] [CrossRef]
- Lim, C.L.; Adam, N.M.; Ahmad, K.A. Cryogenic pipe flow simulation for liquid nitrogen with vacuum insulated pipe (VIP) and Polyurethane (PU) foam insulation under steady-state conditions. Therm. Sci. Eng. Prog. 2018, 7, 302–310. [Google Scholar] [CrossRef]
- Cengel, Y.A.; Ghajar, A.J. “Fundamentals of Convection.” Heat and Mass Transfer: A Practical Approach; McGraw-Hill Education: New York, NY, USA, 2019; pp. 333–358. [Google Scholar]
| Disclaimer/Publisher’s Note: The statements, opinions and data contained in all publications are solely those of the individual author(s) and contributor(s) and not of MDPI and/or the editor(s). MDPI and/or the editor(s) disclaim responsibility for any injury to people or property resulting from any ideas, methods, instructions or products referred to in the content. |
© 2023 by the authors. Licensee MDPI, Basel, Switzerland. This article is an open access article distributed under the terms and conditions of the Creative Commons Attribution (CC BY) license (https://creativecommons.org/licenses/by/4.0/).


