Proceeding Paper

Mechanical Properties of Resistance-Spot-Welded Joints of Aluminum Castings and Wrought Alloys †

1
Department of Mechanical Engineering, Faculty of Engineering, Osaka Institute of Technology, Osaka 535-8585, Japan
2
Nissan Motor Co., Ltd., Yokohama-shi 220-8686, Japan
*
Author to whom correspondence should be addressed.
Presented at the 15th International Aluminium Conference, Québec, QC, Canada, 11–13 October 2023.
Eng. Proc. 2023, 43(1), 52; https://doi.org/10.3390/engproc2023043052
Published: 8 October 2023
(This article belongs to the Proceedings of The 15th International Aluminium Conference)

Abstract

:
Joint strength was measured as a mechanical property of spot-welded joints of casting and wrought aluminum alloys. It was confirmed that the joints of casting alloys, wrought alloys and combinations of casting and wrought alloys exhibited different joint strengths. In addition, hardness measurements and microstructural observations of the melting zone revealed that the melt properties affected the joint strength of spot-welded joints.

1. Introduction

In recent years, automobiles have been required to have lighter bodies in order to reduce CO2 emissions and increase cruising range due to electrification. The application of aluminum alloys, which are lighter than the steel plates that have been widely applied in the past, is expanding, and aluminum alloys in expanded, extruded and cast materials are increasingly being applied to car body structural members [1].
Although mechanical fastening such as SPR (Self-Piercing Riveting) is used to join aluminum alloys, resistance spot welding can also be used to join aluminum alloys, in which case rivets and other additional materials are not required and the weight reduction effect of aluminum alloy application can be maximized [2].
However, aluminum alloys are more difficult materials to use in resistance spot welding than steels due to their high conductivity and oxide layer on the surface [3]. Casting alloys are more difficult to join with resistance spot welding than wrought alloys because they have lower melting temperatures due to higher amounts of added elements, more defects such as porosities and inconsistent thicknesses compared to wrought alloys.
In this study, the characteristics of resistance spot welds of aluminum castings and wrought alloys were clarified using the nugget shape, hardness distribution and microstructure results. In addition, strength properties such as tensile shear strength and cross-tension strength were evaluated to clarify the relationship between the characteristics and the strength.

2. Materials and Methods
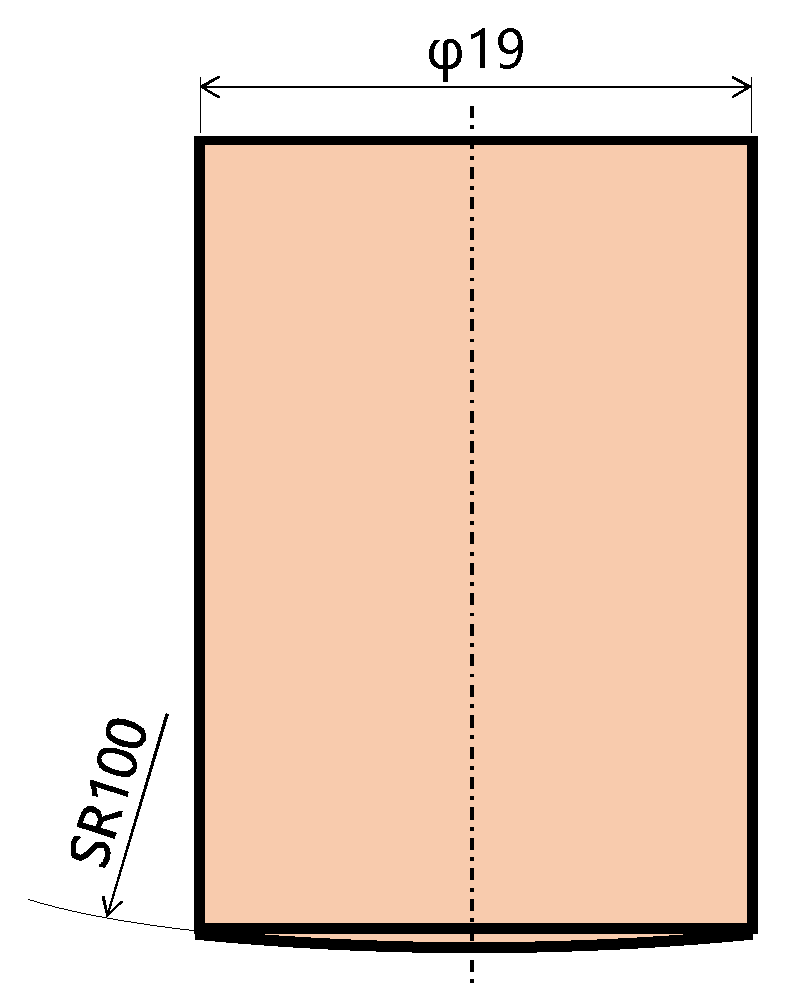
2.1. Materials

In this study, 3.0 mm Al-Si-Mg cast, 2.4 mm 6061-T6 wrought and 1.1 mm 6016-T wrought aluminum alloys were used as test materials. The nominal chemical composition and mechanical properties of each aluminum alloy are shown in Table 1. In experiments such as joint strength measurements and cross-sectional macro-observations, the combinations as shown in Table 2 were selected.

2.2. Equipment

Spot-welding equipment with a DC inverter-type power supply control system was used for joining in this experiment. This equipment has a maximum short-circuit current of 50 kA and a maximum electrode force of 8 kN. Radius electrodes with a tip curvature of 100 mm and diameter of φ19 mm as shown in Figure 1 were applied to both movable sides. The composition of the electrode was Cu-Cr alloy.

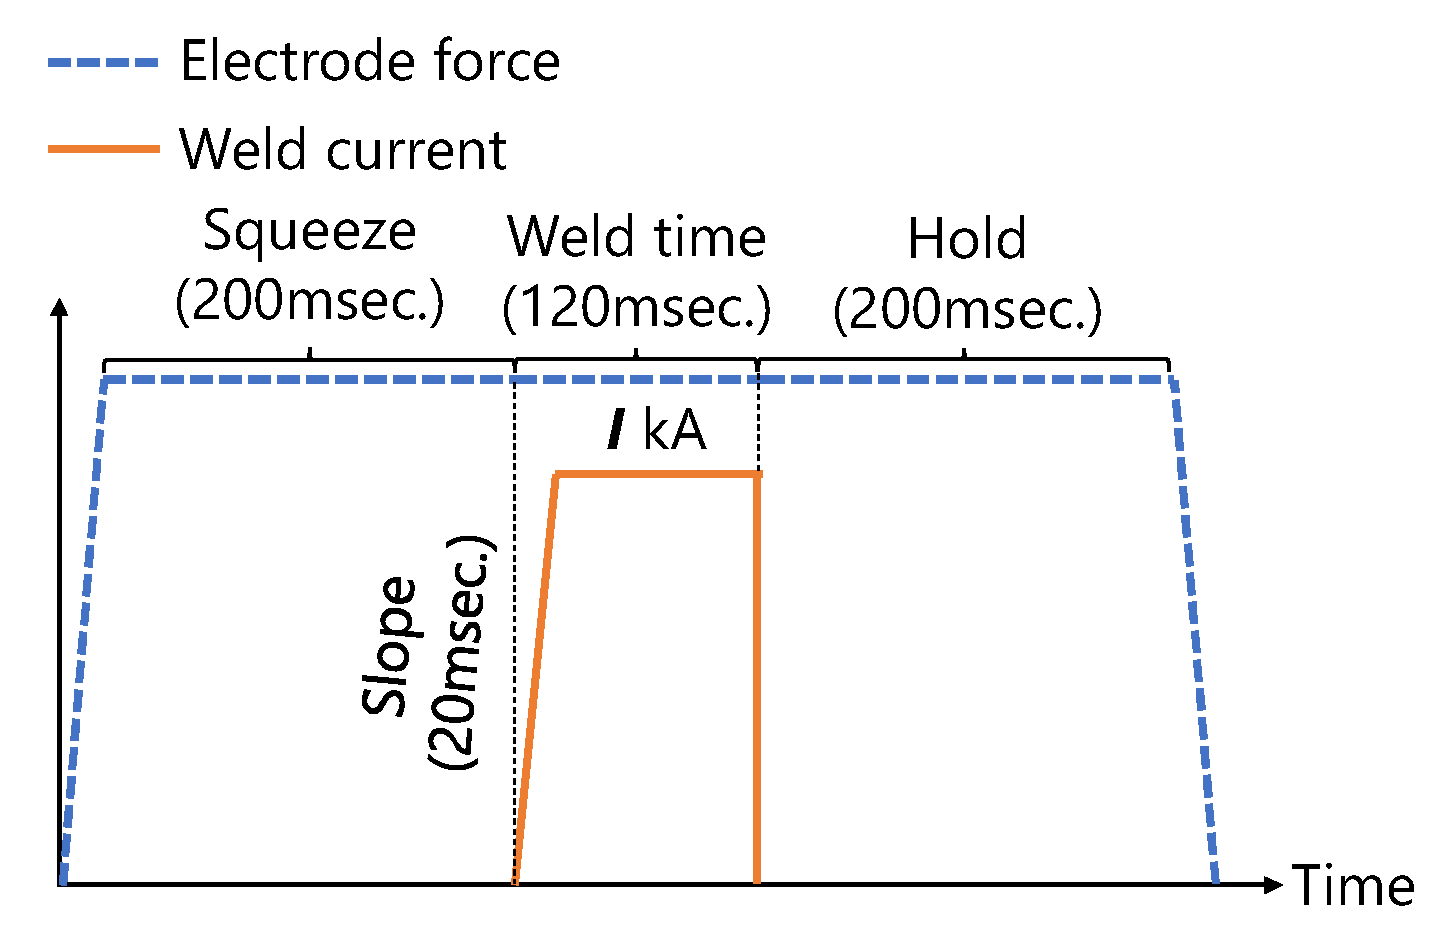
2.3. Welding Conditions
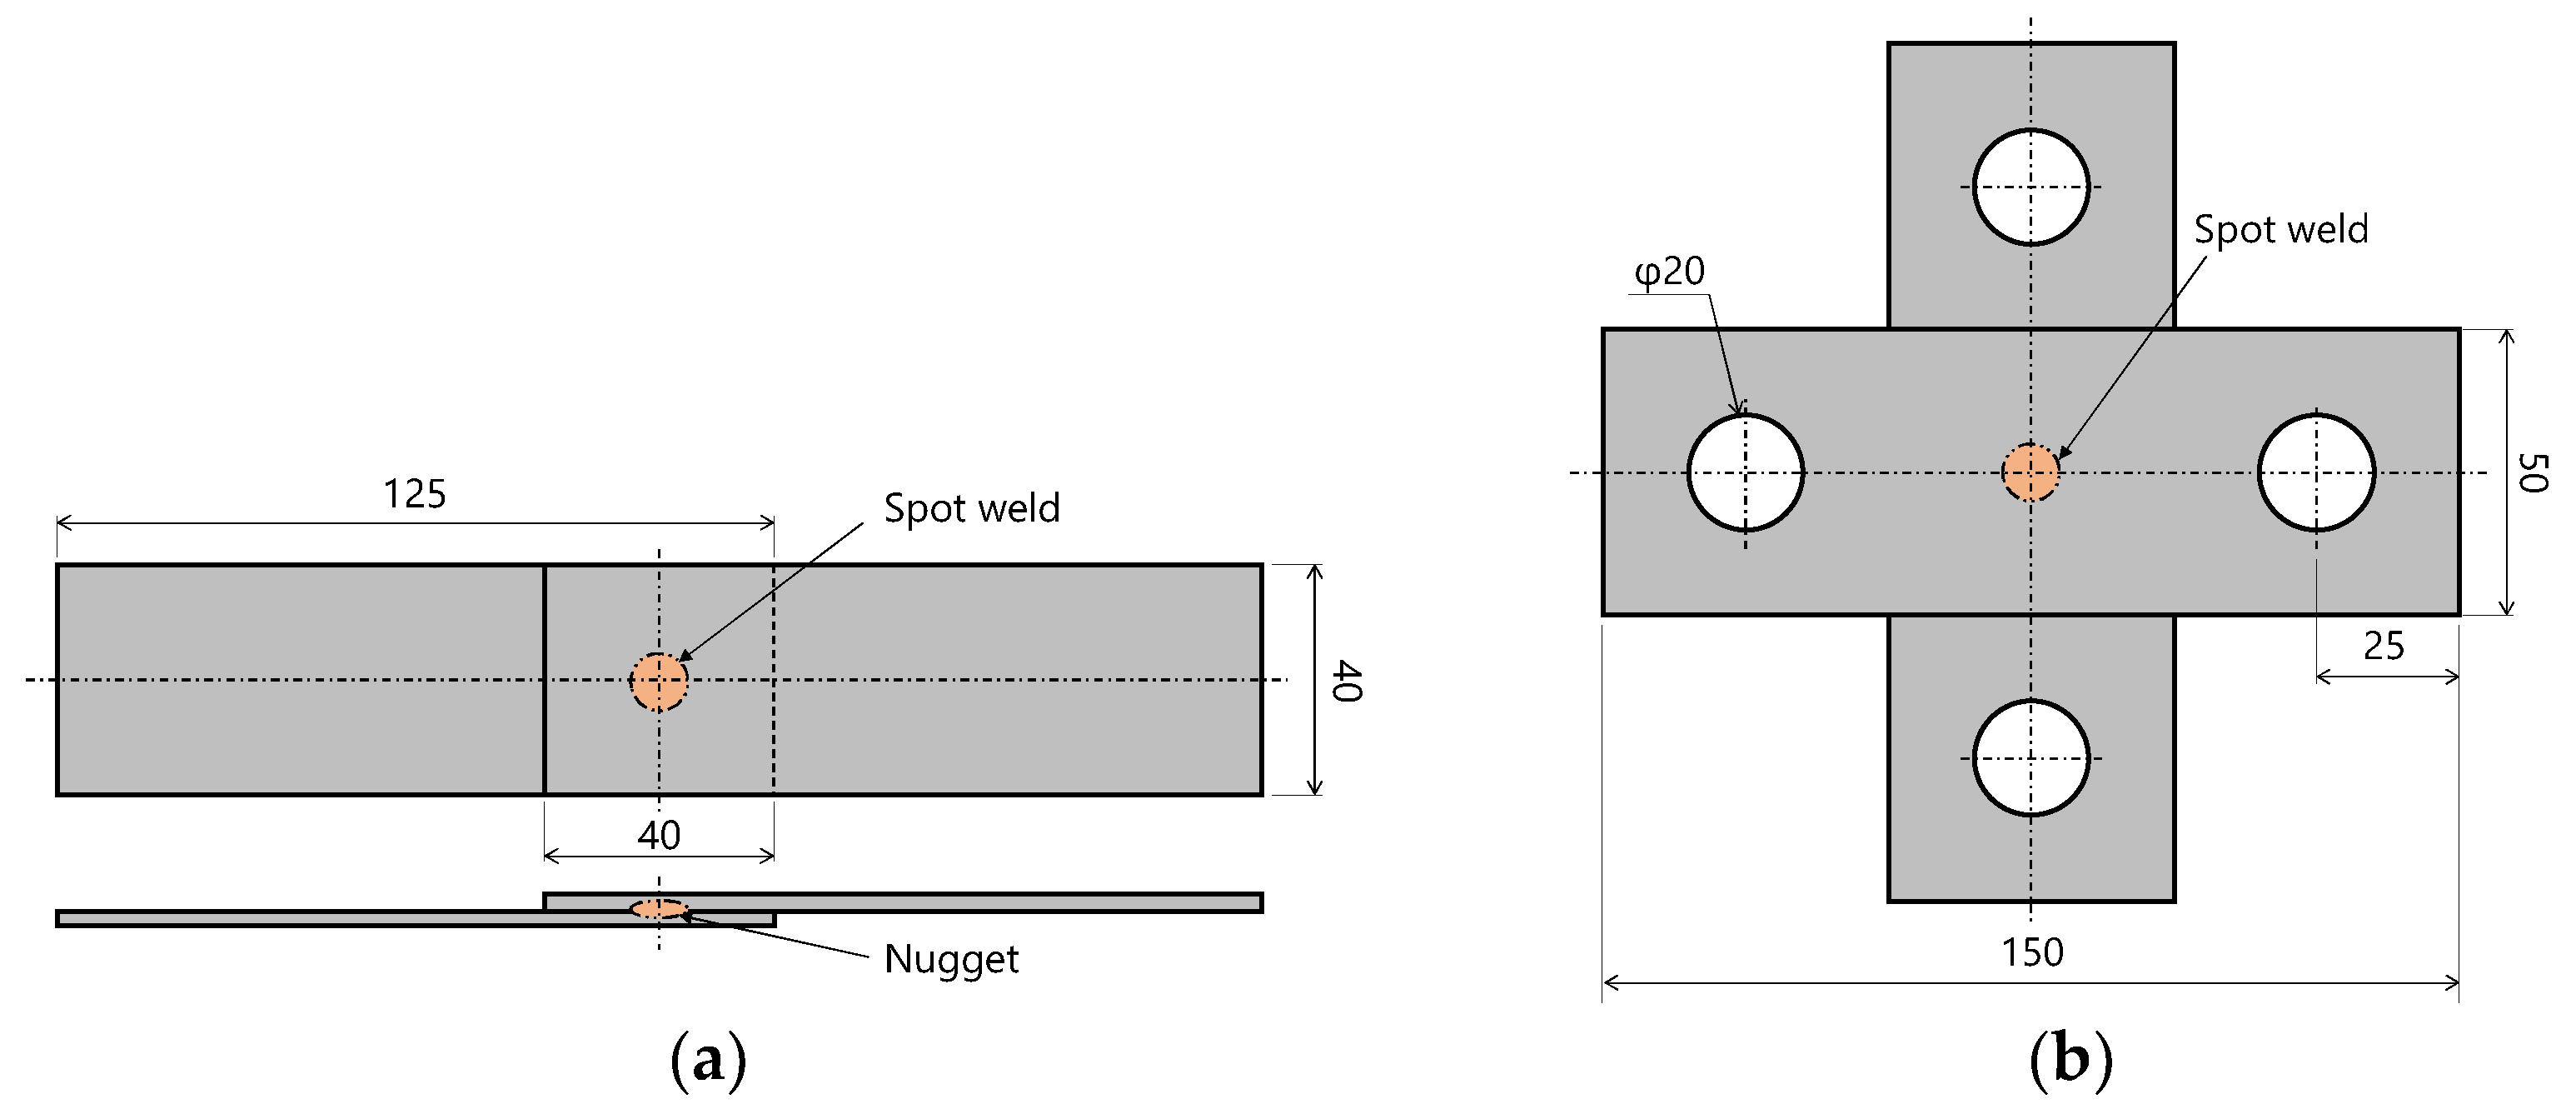
As shown in Figure 2, the welding sequences of stable force and single current were applied. The welding current, welding time and electrode force were derived from a preliminary welding test to obtain a nugget diameter of about 5√t (“t” means a thinner thickness in stack combination). Squeeze and hold times were 200 ms. Table 3 shows the welding conditions for each stack combination.

2.4. Tensile Tests

Tensile shear and cross-tension specimens were prepared to measure the joint strength of resistance spot welds. Tensile shear specimens were prepared by overlapping 40 mm × 125 mm workpieces with a 40 mm lap and welding at the center of the overlap, as shown in Figure 3a. Cross-tension specimens were prepared by overlapping 50 mm × 150 mm workpieces with 20 mm holes crosswise and welding at the center of the overlap, as shown in Figure 3b. Ten sets of tensile shear and cross-tension test specimens were prepared for each stack combination.
In both the tensile shear and cross-tension tests, the crosshead speed was 10 mm/min and tensile load was applied until fracture.
In addition, after fracture, the fracture surface or plug was measured with calipers in two directions, and the average of these were defined as the weld diameter or plug diameter, as shown in Figure 4.

2.5. Cross-Section and Hardness Map

The cross-sectional specimens were made by cutting the welded joint at the center of the electrode indentation. The specimens were used for cross-sectional observation and measurement of the two-dimensional Vickers hardness distribution in the thickness direction and interface direction.

3. Results and Discussion

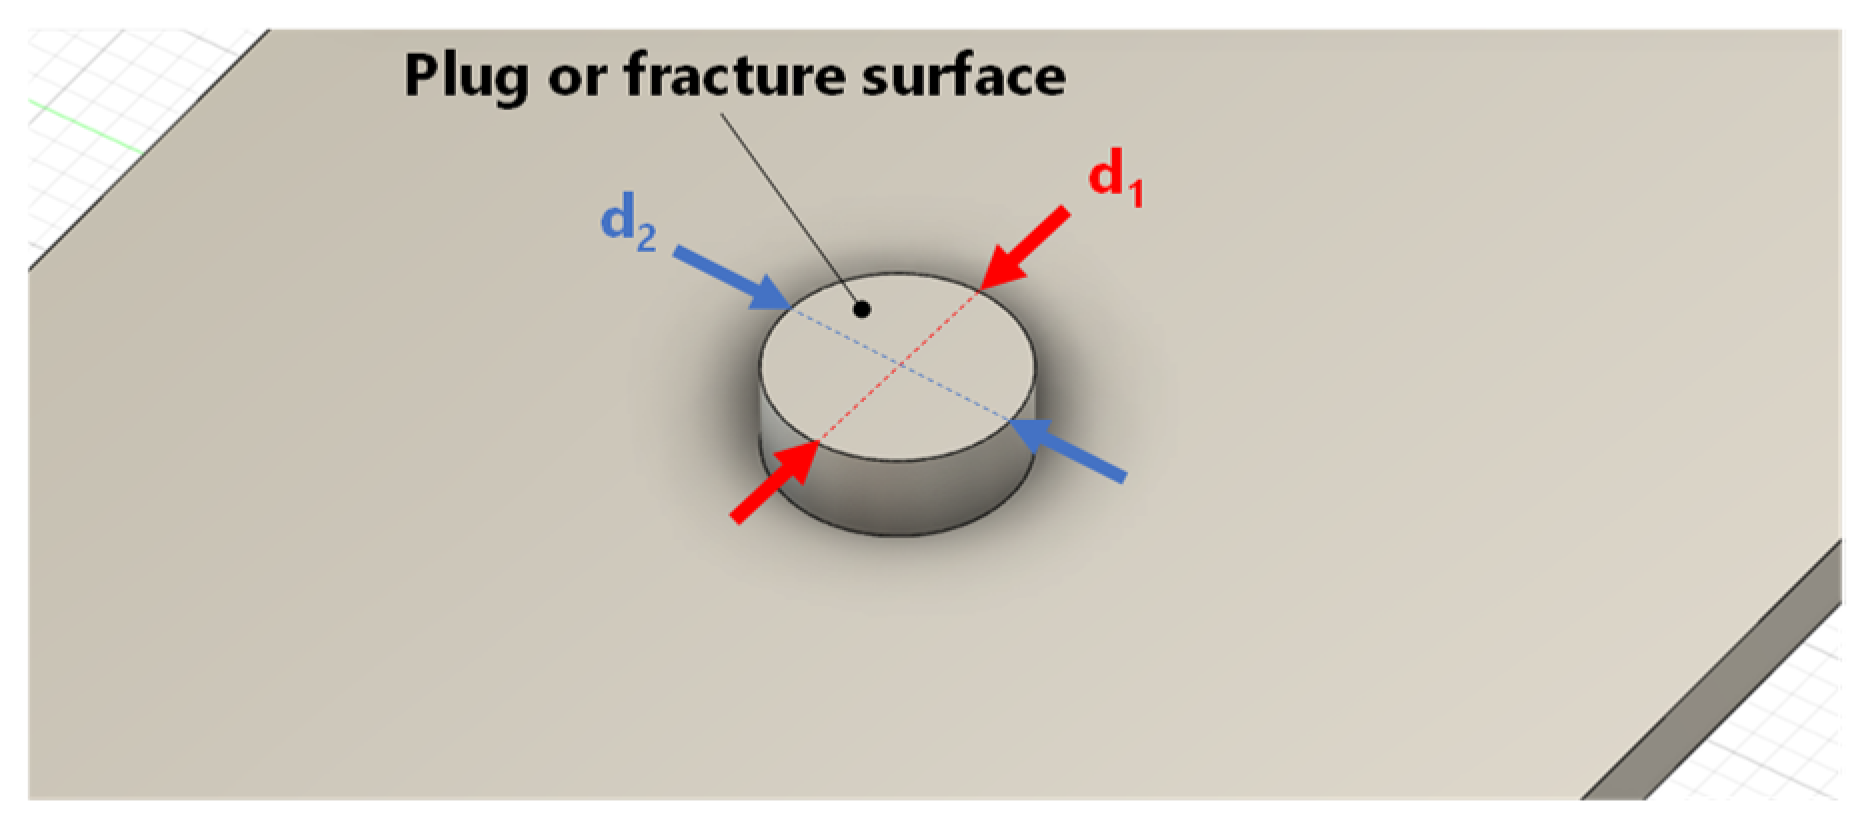
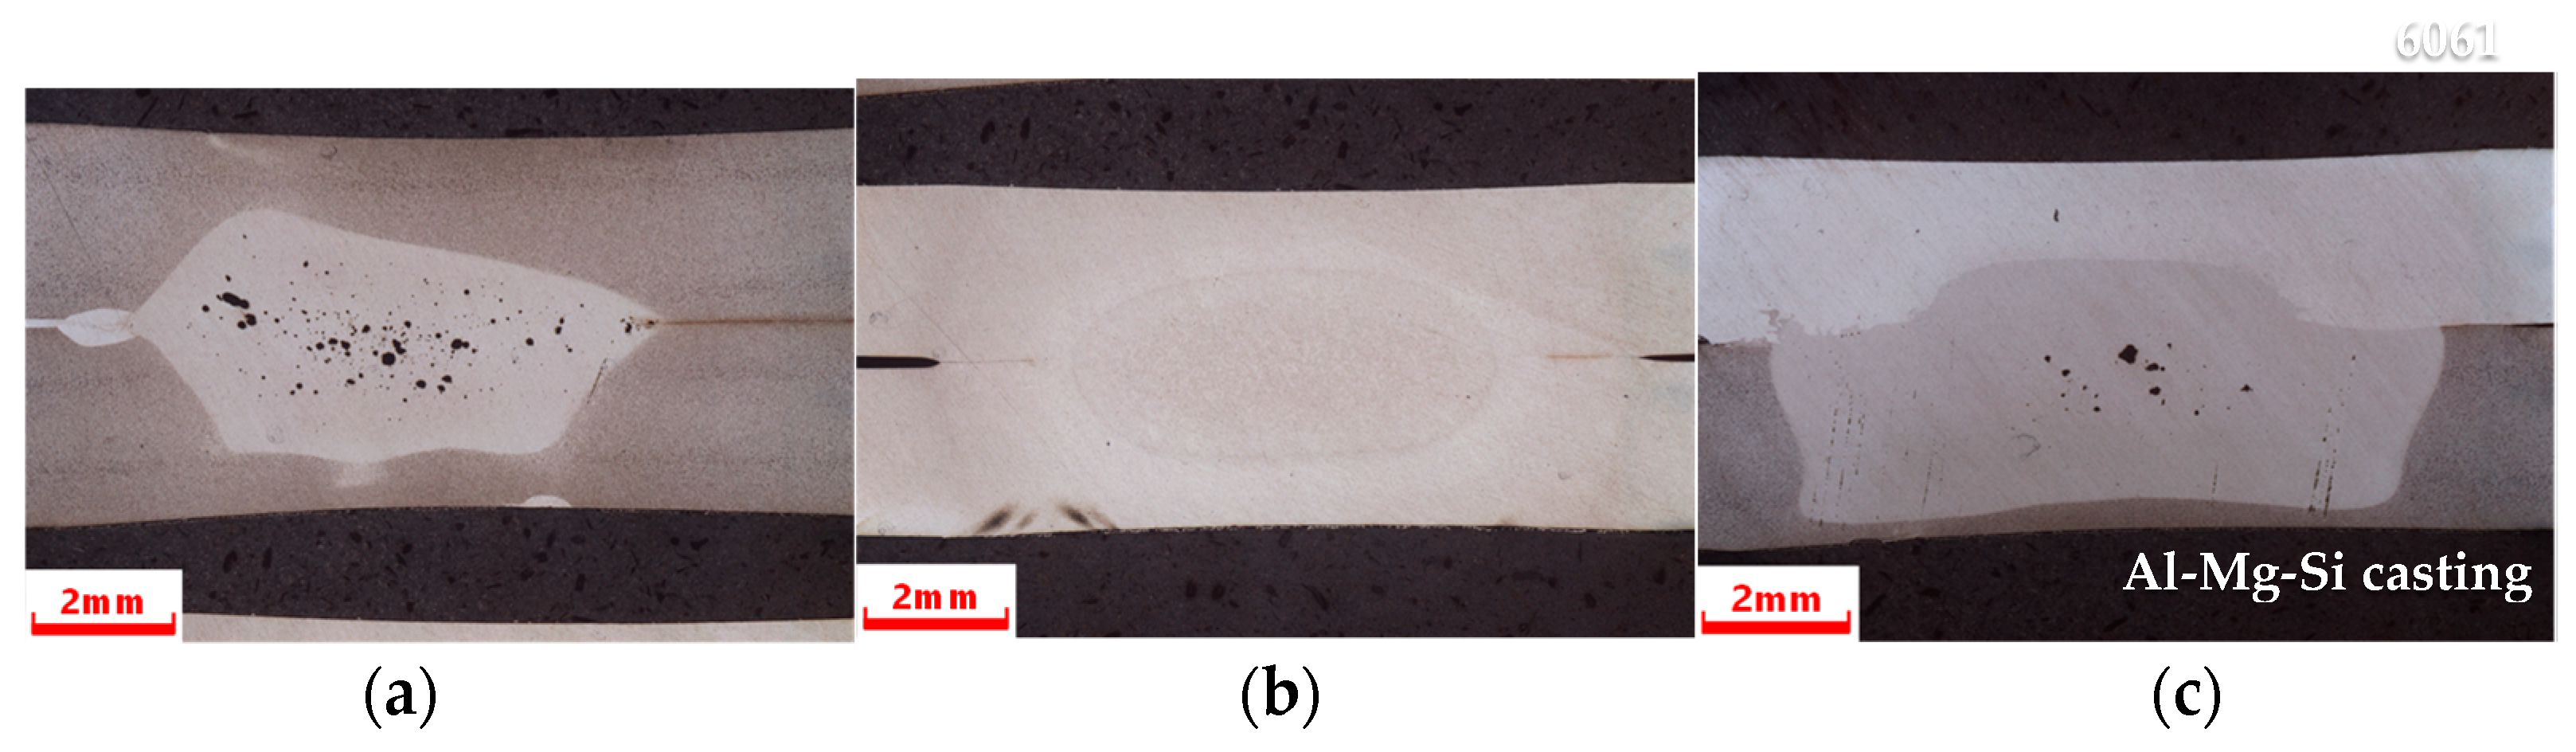
3.1. Weld Morphology

Figure 5 shows cross-sectional views of the Al-Mg-Si castings joint (Stack (a)), 6061-T6 joint (Stack (b)) and a dissimilar joint between the casting and wrought alloys (Stack (c)). In Stack (a), the penetration from the interface was uneven and the nugget had an irregular shape. In addition, internal defects that appeared to be due to porosity were observed. This is thought to be because the contact resistance at the weld interface and the volume resistance of the casting alloy were non-uniform compared to wrought alloys due to variations in the segregation of additives inside the casting, resulting in less uniform melting due to Joule heating and a non-uniform amount of melting from the melting starting point. On the other hand, the melting zone of Stack (b) was typically ellipsoidal. Compared to casting alloy, the composition and material properties were more uniform, which is thought to have resulted in more uniform growth of the melting zone. In the case of Stack (c), the melt into the 6061 side was elliptical, while the casting side was rectangular and deeply melted, resulting in an asymmetric nugget shape.

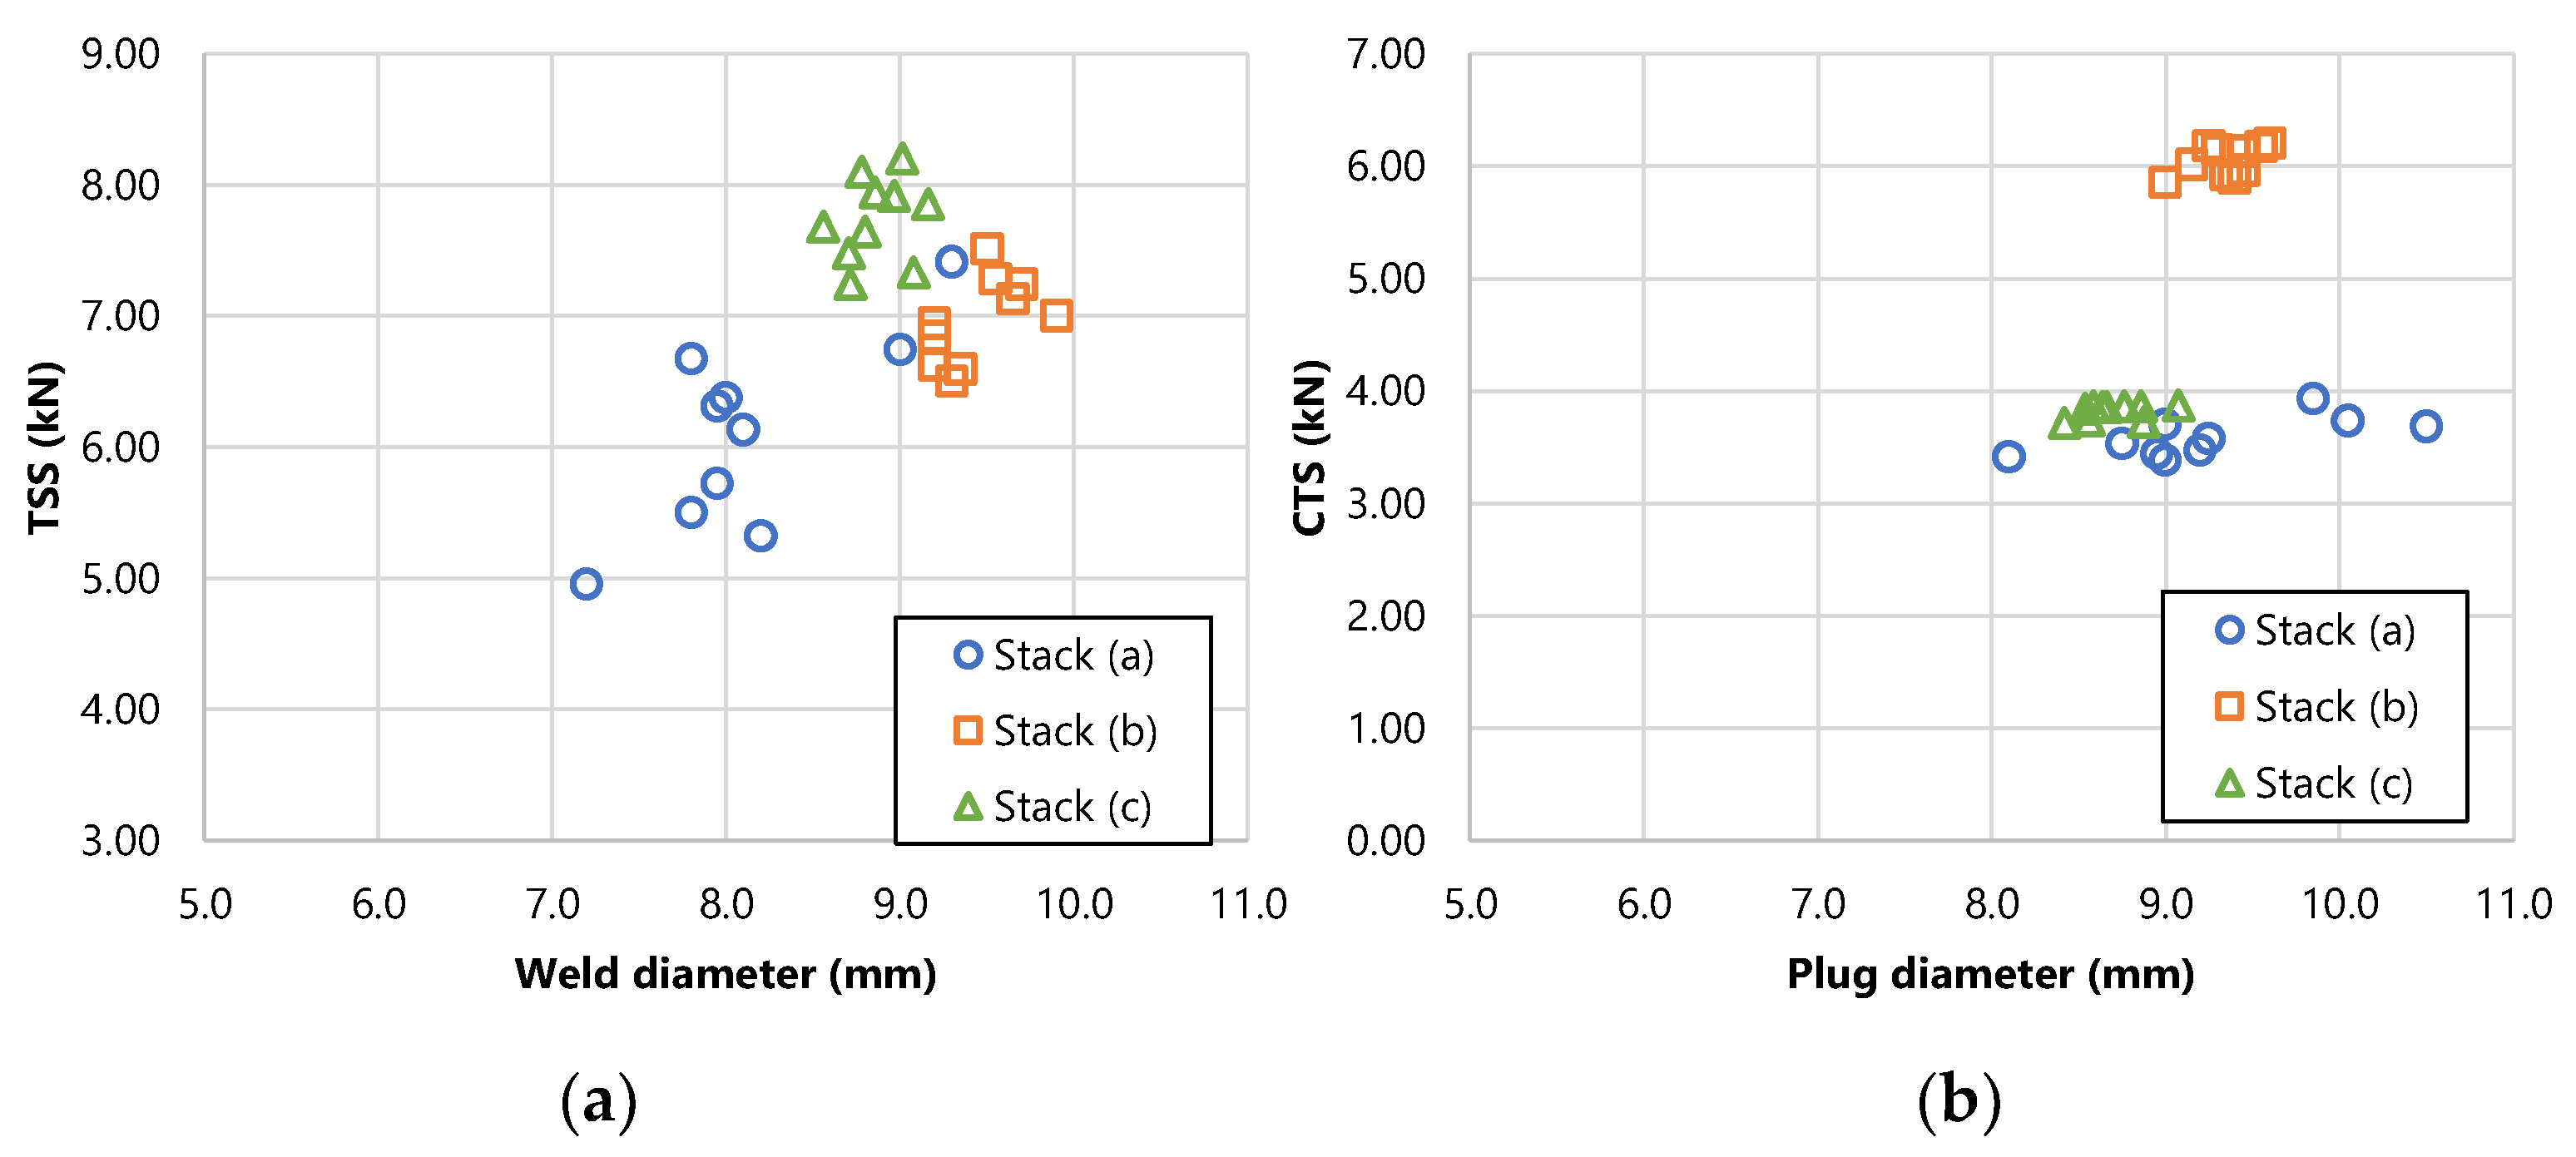
3.2. Joining Strength

The relationship between weld diameter and tensile share strength (TSS) and the relationship between plug diameter and cross tension strength (CTS) are shown in Figure 6. In TSS, Stack (c) (dissimilar joint between casting and wrought alloys) had the highest strength, while Stack (b) (6061-T6 joint) had the lowest strength. The TSS of Stack (a) (Al-Mg-Si casting alloy joint) varied by about ±1 kN even when weld diameters were comparable. In CTS, Stack (b) had the highest strength, and Stack (a) and Stack (c) were equivalent. Stack (a) had the highest variation in plug diameter.

3.3. Mechanical Properties

Figure 7 shows the load–displacement curves obtained for each stack during the tensile shear test and cross-tension test, where the weld or plug diameters were equivalent among each stack. In the tensile shear test, the displacement of Stack (b) increased at low loads. The displacements of Stack (a) and Stack (c) increased at similar loads, but Stack (a) fractured at smaller displacements. In the cross-tension test, Stack (a) and Stack (c) had similar curves, but Stack (b) fractured at large displacement and high loads.

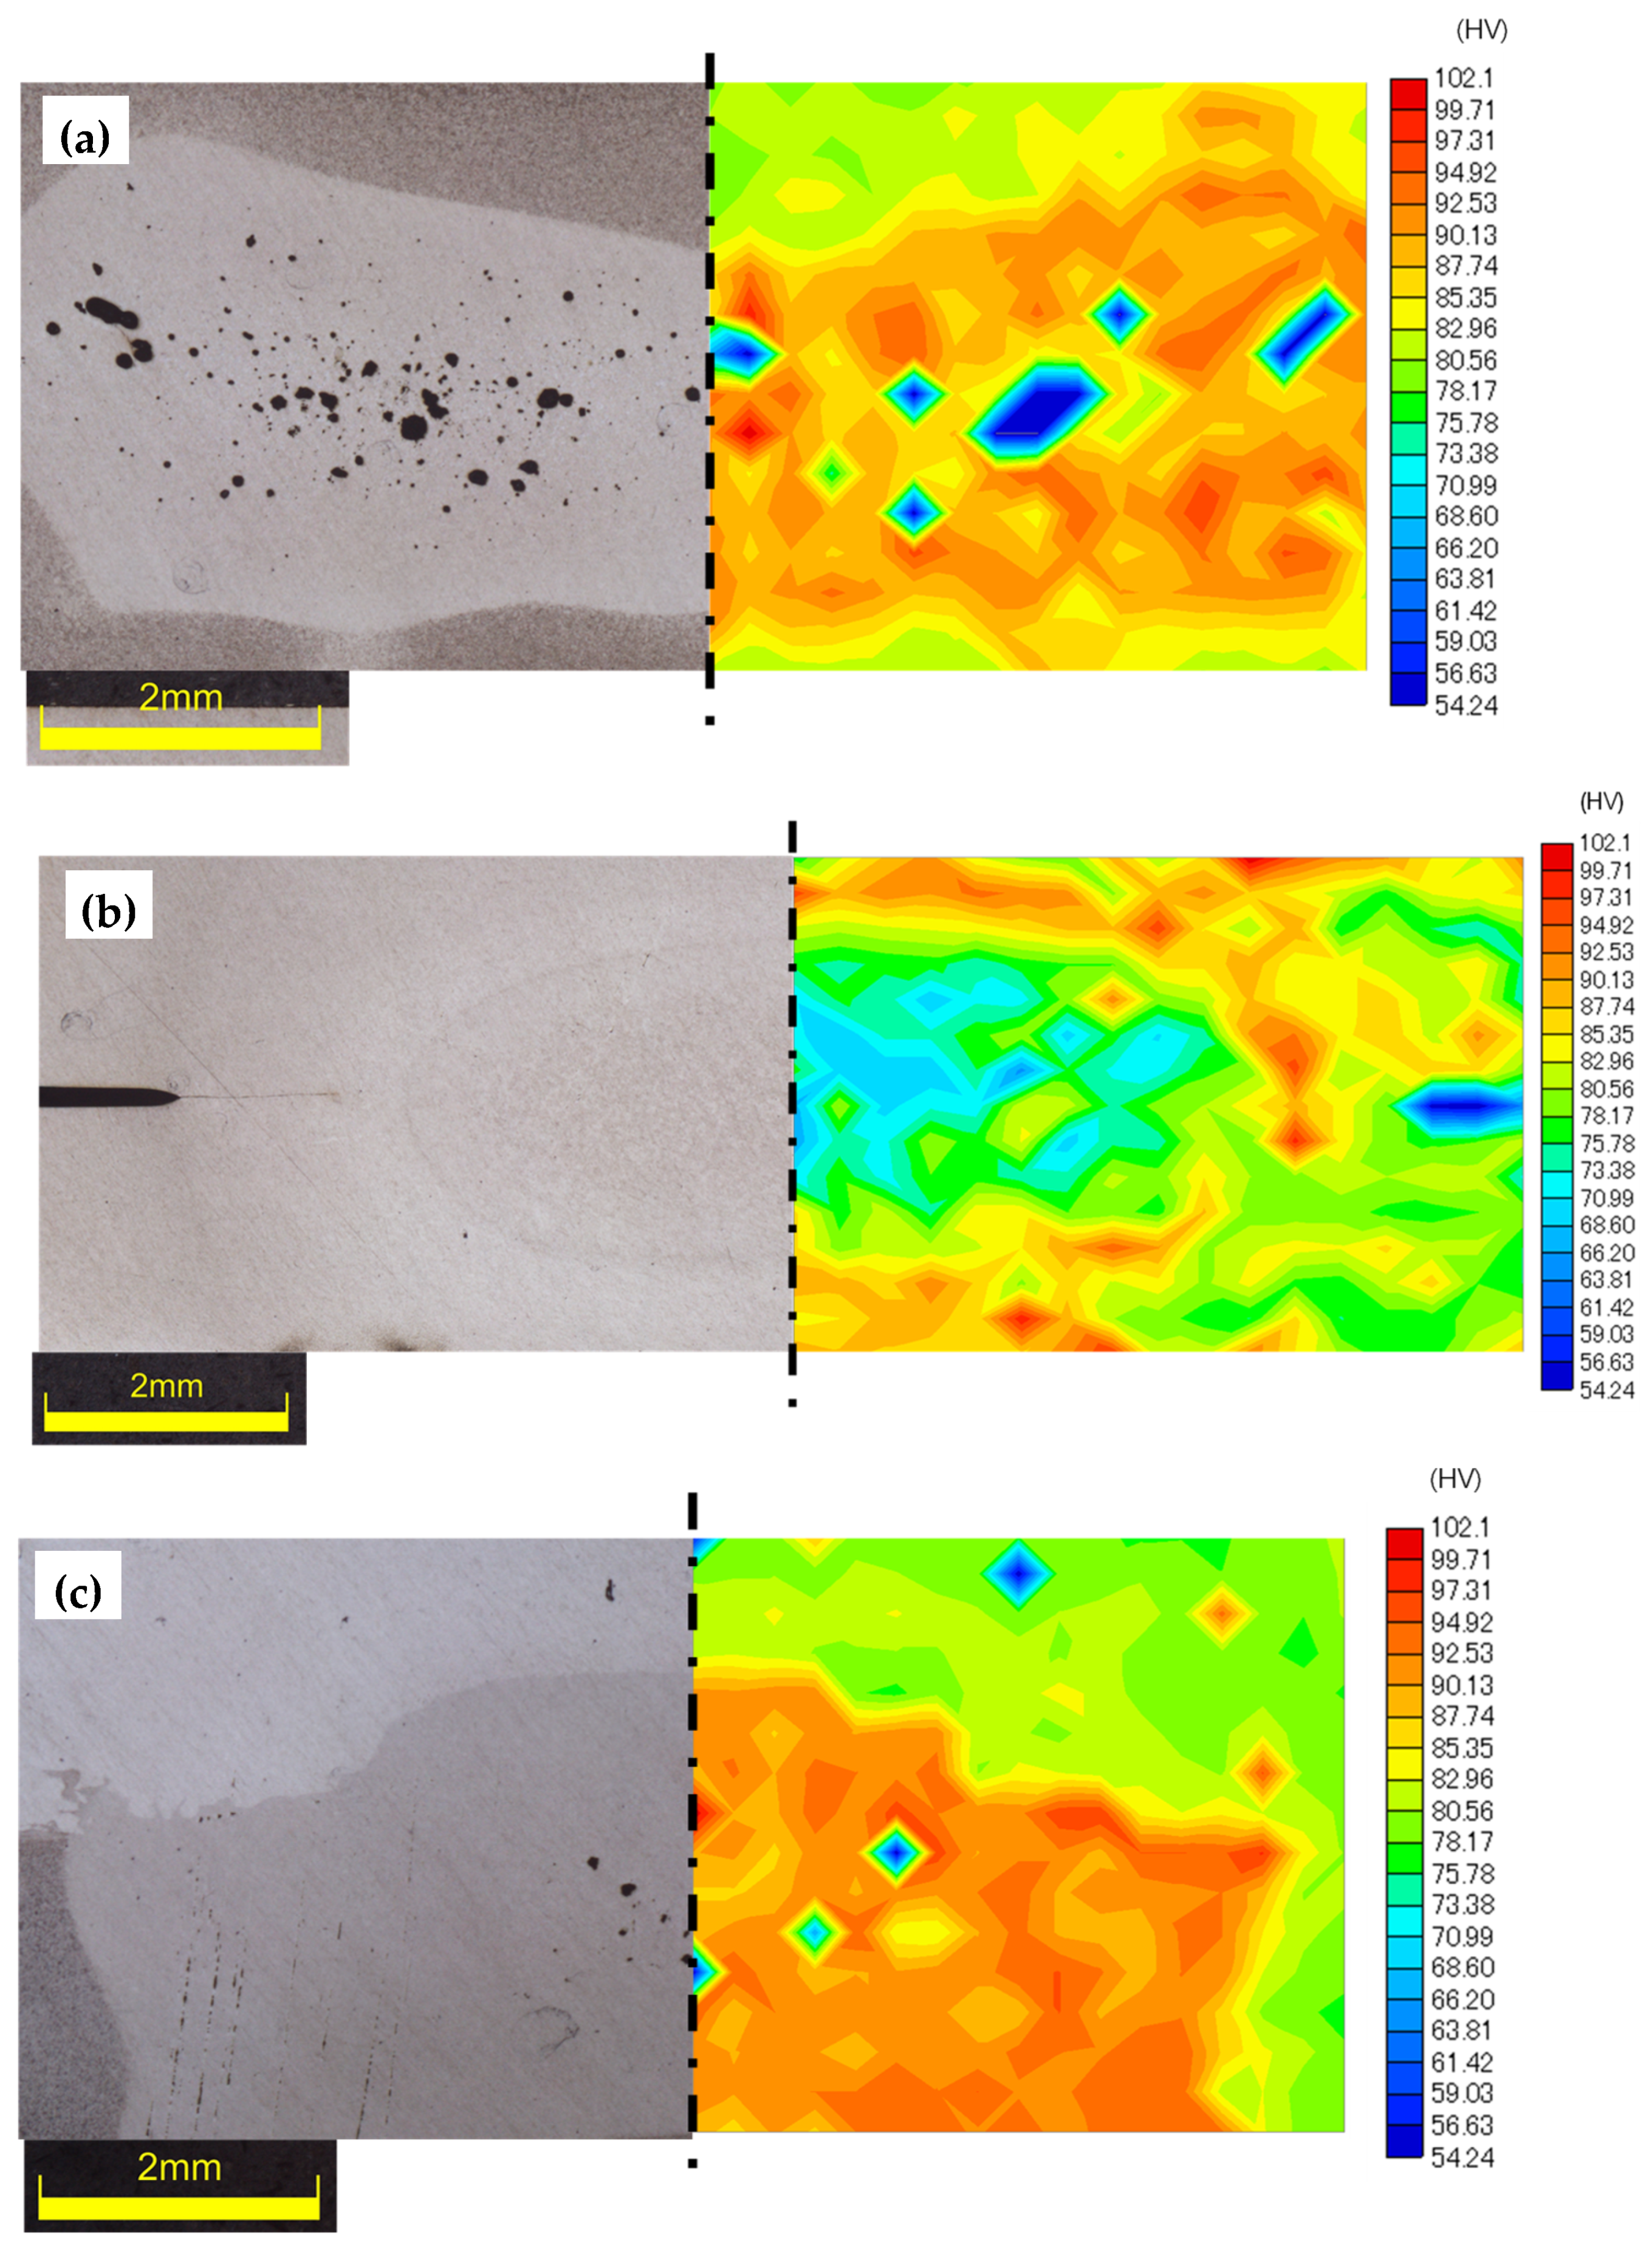
3.4. Hardness Distribution

Figure 8 shows the hardness map around the melting zones of Stacks (a), (b) and (c). In Stack (a) and Stack (c), the hardness of the melting zone increased by about 10% relative to the base metal and heat-affected zone. In Stack (b), the hardness of the melting zone was reduced by about 10% relative to the base metal and heat-affected zone. In addition, in Stack (c), the penetration of the 6061 wrought alloy side was as hard as the penetration of the Al-Mg-Si casting alloy.
The hardness of the melting zone of Stack (a) and Stack (c) than that of Stack (b) may be the reason for the higher TSS shown in Section 3.2. On the other hand, in Stacks (a) and (c), where the hardness of the melting zone was higher, fracture occurred at a smaller displacement when peel load was applied, which is considered to be the reason for the lower CTS.

3.5. Microstructural Observation of Casting Alloy

Figure 9 shows a cross-sectional view of Stack (d) (dissimilar joint between casting and wrought alloys). Focusing on the microstructure of the melting zone and the base metal of the casting alloy, it was confirmed that the microstructure of the melting zone was finer than that of the base metal. The increase in hardness of melting zone of the casting alloy described in Section 3.4 is thought to be caused by this microstructural refinement of the melting zone.

4. Conclusions

In this study, the mechanical properties of spot-welded joints of Al-Mg-Si casting alloys and wrought alloys were evaluated, and the factors affecting the mechanical properties were discussed by measuring the hardness of the melting zone and observing the microstructure, resulting in the following findings.
  • Spot-welded joints of the Al-Mg-Si casting alloys exhibit higher TSS and lower CTS than wrought alloy joints;
  • The higher hardness of the melting zone compared to that of the base metal contributes to the spot-welded joint characteristics in the Al-Mg-Si casting alloy joint;
  • Microstructural refinement was observed in the melting zone of the Al-Mg-Si castings compared to the base metal, which increases the hardness of the melting zone.

Author Contributions

Conceptualization, T.M. and M.I.; validation, T.M. and M.I.; data curation, T.M. and S.S.; writing—original draft preparation, T.M.; writing—review and editing, T.M. and M.I.; supervision, M.I. and T.T.; project administration, M.I. All authors have read and agreed to the published version of the manuscript.

Funding

This research received no external funding.

Institutional Review Board Statement

Not applicable.

Informed Consent Statement

Not applicable.

Data Availability Statement

Not applicable.

Conflicts of Interest

The authors declare no conflict of interest.

References

  1. Stojanovic, B.; Bukvic, M.; Epler, I. Application of Aluminum and Aluminum Alloys in Engineering. Appl. Eng. Lett. J. Eng. Appl. Sci. 2018, 3, 52–62. [Google Scholar] [CrossRef]
  2. Li, D.; Chrysanthou, A.; Patel, I.; Williams, G. Self-piercing riveting-a review. Int. J. Adv. Manuf. Technol. 2017, 92, 1777–1824. [Google Scholar] [CrossRef]
  3. Manladan, S.M.; Yusof, F.; Ramesh, S.; Fadzil, M.; Luo, Z.; Ao, S. A review on resistance spot welding of aluminum alloys. Int. J. Adv. Manuf. Technol. 2017, 90, 605–634. [Google Scholar] [CrossRef]
Figure 1. Outline drawing of the radius electrode.
Engproc 43 00052 g001
Figure 2. Typical welding sequence.
Engproc 43 00052 g002
Figure 3. Dimension of (a) tensile test specimen and (b) cross-tension specimen. The units of dimension in the figures are “mm”.
Engproc 43 00052 g003
Figure 4. The definition of weld diameter and plug diameter.
Engproc 43 00052 g004
Figure 5. Cross-sectional views of the spot-welded joint: (a) similar Al-Mg-Si casting alloy (Stack (a)), (b) similar wrought alloy (Stack (b)) and (c) dissimilar joint between casting and wrought alloys (Stack (c)).
Engproc 43 00052 g005
Figure 6. Strength versus weld or plug diameter: (a) relationship between TSS and weld diameter at fracture and (b) relationship between CTS and plug diameter at fracture.
Engproc 43 00052 g006
Figure 7. Load–displacement curves: (a) curves of three stack types with similar weld diameters in tensile shear tests and (b) curves of three stack types with similar plug diameters in cross-tension tests.
Engproc 43 00052 g007
Figure 8. Hardness maps and cross-sectional views: (a) similar Al-Mg-Si casting alloy (Stack (a)); (b) similar wrought alloy (Stack (b)); (c) dissimilar joint between casting and wrought alloys (Stack (c)).
Engproc 43 00052 g008
Figure 9. Cross-sectional views of dissimilar joint between casting and wrought alloy (Stack (d)): (a) overall melting zone; (b) detailed appearance of the boundary between the melting zone and the base metal.
Engproc 43 00052 g009
Table 1. Chemical composition of the test materials.
Alloying Elements (wt%)
AlloyingCuSiMgZnFeMnNiSnTiCrPbAl
Al-Mg-Si casting0.0510.50.450.030.150.400.030.010.20--Remain
6061-T60.400.801.200.250.700.15--0.150.35-Remain
6016-T40.201.50.600.200.500.20--0.150.1-Remain
Table 2. Stack combinations of the experiment.
Symbol of StackUpper LayerLower Layer
AlloyingThicknessAlloyingThickness
Stack (a)Al-Mg-Si casting-T53.0 mmAl-Mg-Si casting-T53.0 mm
Stack (b)6061-T62.4 mm6061-T62.4 mm
Stack (c)6061-T62.4 mmAl-Mg-Si casting-T53.0 mm
Stack (d)6016-T41.1 mmAl-Mg-Si casting-T53.0 mm
Table 3. Welding parameters.
StackElectrode Force
(kN)
Weld Time
(ms.)
Weld Current
(kA)
Stack (a)8.010037.0
Stack (b)8.010048.0
Stack (c)8.010040.0
Stack (d)4.08029.0
Disclaimer/Publisher’s Note: The statements, opinions and data contained in all publications are solely those of the individual author(s) and contributor(s) and not of MDPI and/or the editor(s). MDPI and/or the editor(s) disclaim responsibility for any injury to people or property resulting from any ideas, methods, instructions or products referred to in the content.

