Abstract
Industry 4.0 has emerged together with relevant technological tools that have enabled the rise of this new industrial paradigm. One of the main employed tools is Machine Learning techniques, which allow us to extract knowledge from raw data and, therefore, devise intelligent strategies or systems to improve actual industrial processes. In this regard, this paper focuses on the development of a prediction system based on Random Forest (RF) to estimate Pentane concentration in advance. The proposed system is validated offline with more than a year of data and is also tested online in an Energy plant of the Basque Country. Validation results show acceptable outcomes for supporting the operator’s decision-making with a tool that infers Pentane concentration in Butane 400 min in advance and, therefore, the quality of the obtained product.
1. Introduction
The fourth industrial revolution, coined as Industry 4.0, is characterized by the integration of advanced digital technologies such as Internet of Things (IoT), Artificial Intelligence (AI), Robotics, Cloud Computing, Big Data and Cybersecurity into the industrial process. These technologies enable factories and supply chains to become more efficient, productive and adaptable to changing market demands. In this context, many industries have monitored their processes and units with the aim of optimizing their operational conditions and, thus, improving the quality of the final products [1,2]. Regarding the Energy Industry, in [3], a method for estimation the oxygen content in a coke furnace is presented. Similarly, in [4], a soft-sensor for the prediction of MAE and SWA acid gases is shown.
A common and relevant fact that encompasses these kind of problems is the need to build intelligent strategies that extract valuable insights from the available data. In this context, Feature Selection (FS) and Feature Weighting (FW) techniques along with Machine Learning (ML) models that enable the construction of automated decision support systems based on data are a hot research topic nowadays. In this sense, several works apply FS and FW strategies to problems related to the Energy sector, such as [5,6]. In [6], a Butane concentration estimator at the bottom of the debutanizer column with an FW strategy is presented. Similarly, authors in [5] propose an autoML approach that considers feature preprocessing and selects the best algorithm configuration for developing a soft-sensor for Pentane concentration prediction at the end of a debutanizer column.
This paper focuses on this last open challenge, i.e., to predict approximately 400 min in advance the percentage of Pentane concentration in Butane at the end of a debutanizer column. In contrast to [5], a regression model based on a Random Forest (RF) technique is proposed. Thus, it is possible to assess the trend of Pentane concentration prediction through this implementation. Furthermore, online results obtained by applying this proposal in an Energy plant are presented.
2. Industrial Use Case Description
The Industrial use case focuses on a specific line for the production of Butane—this being a product of great added value. In order to be marketed, it must meet a series of requirements and specifications. One of them is the proportion of Pentanes in the Butane itself, where the maximum admissible threshold is .
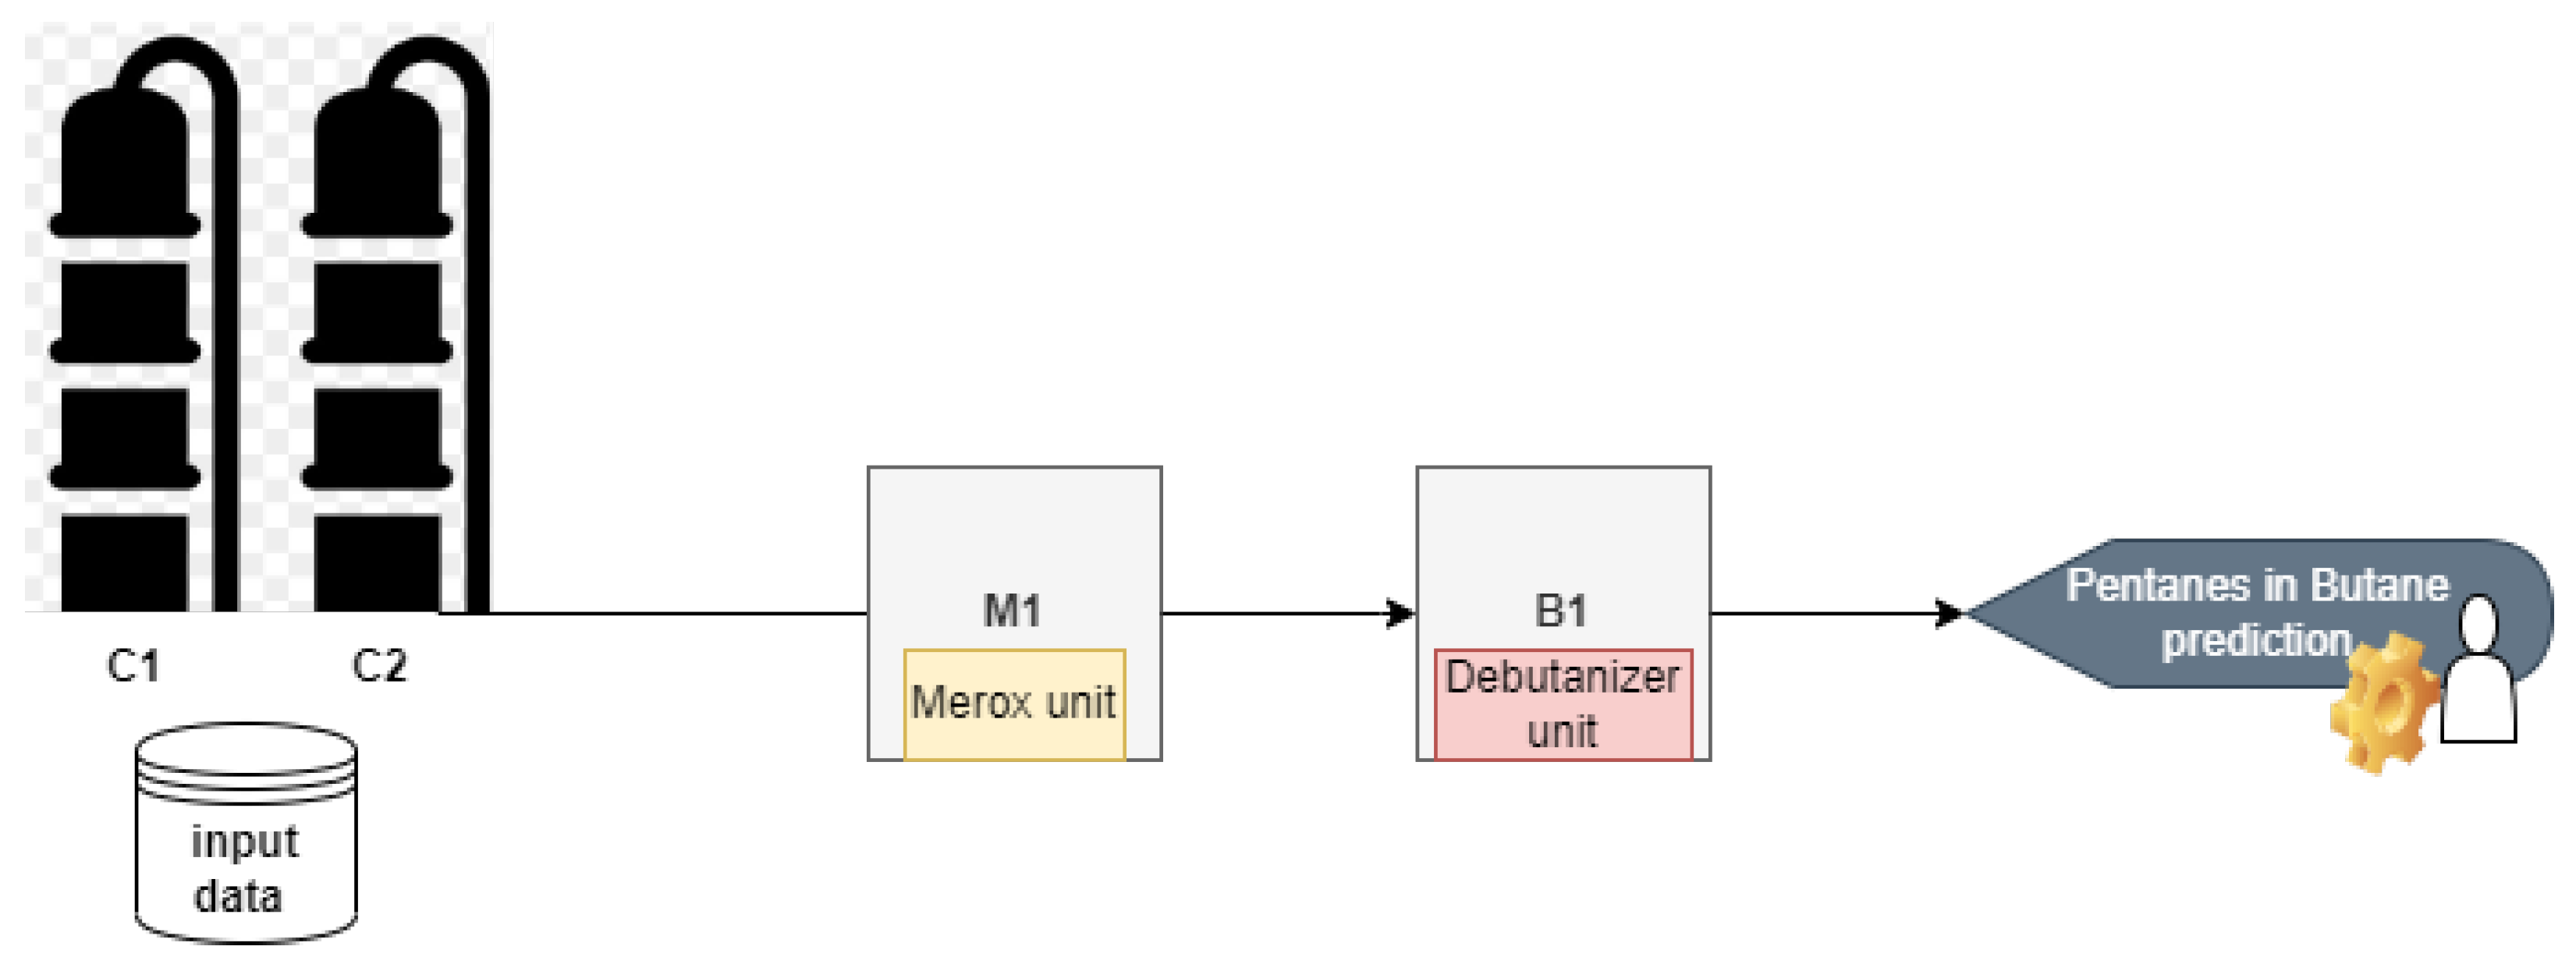
Figure 1 shows the Butane production scheme.
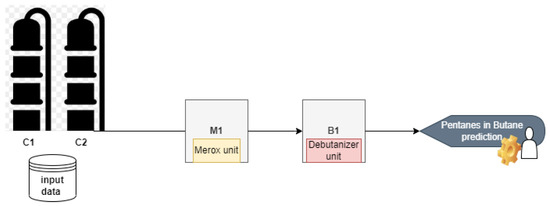
Figure 1.
Schema of the industrial use case.
In Figure 1, the main line for the blending of Butanes can be observed. It consists of the head of the naphtha stabilizers (C1, C2), the Merox unit (M1) and ends in the first Butanes unit (B1). The data collected come from columns C1 and C2 wherein information about flow, temperature and pressure is gathered. The aim is to predict the percentage of Pentanes in Butane that will be at the end of the debutanizer column but approximately 400 min in advance. The process variables information are obtained every 10 min from October 2017 to February 2019.
3. Percentage of Pentanes in Butane Prediction System
Firstly, a feature importance analysis of the process variables is conducted and the most relevant in terms of Pentane production are selected as input to the prediction system. The feature importance methods used to perform the study are Pearson correlation, Random Forest, ANOVA and Mutual Information. For each of these methods, the 30 most influential variables are selected and those that appear as relevant in three of the four methods with a correlation > between them are finally chosen.
After this first analysis, a Random Forest regressor model [7] is implemented with all the available variables and with the most relevant ones. Two different methods for training the model are tested: (1) to train and validate the model using the cumulative learning method and (2) using the sliding window method. By means of employing the cumulative learning method, the model is trained with the first 14 months and tested with the last three months. The absolute mean error obtained is (%). Moreover, it is observed that the prediction error increases as the test data move away in time from the training data—that is, for the first hours of the test, the error is low, but as the hours pass the error increases. On the other hand, the model is trained using the sliding window method with a window of one month, i.e., training with the data of one month and testing with the next value, and so on, sliding the window until all the months of the sample are covered. In this way, a mean absolute error in the prediction of (%) is obtained, which is significantly lower than that obtained by the cumulative training method. In addition, it is observed that the importance of the variables also varies over time. As a conclusion, the model with a sliding window of one month is chosen for the construction of the final prediction system. The fact of obtaining a lower error through the sliding window suggests that there is seasonality—that is, the relationship between the process variables and the Pentane concentration varies over time.
As commented in the previous sections, the main objective is to develop a model that predicts in advance a peak in the Pentane concentration—that is, when it exceeds the threshold. Therefore, the developed RF regressor model is used as a core part solution to develop a decision support system that generates an alarm when the prediction exceeds the threshold.
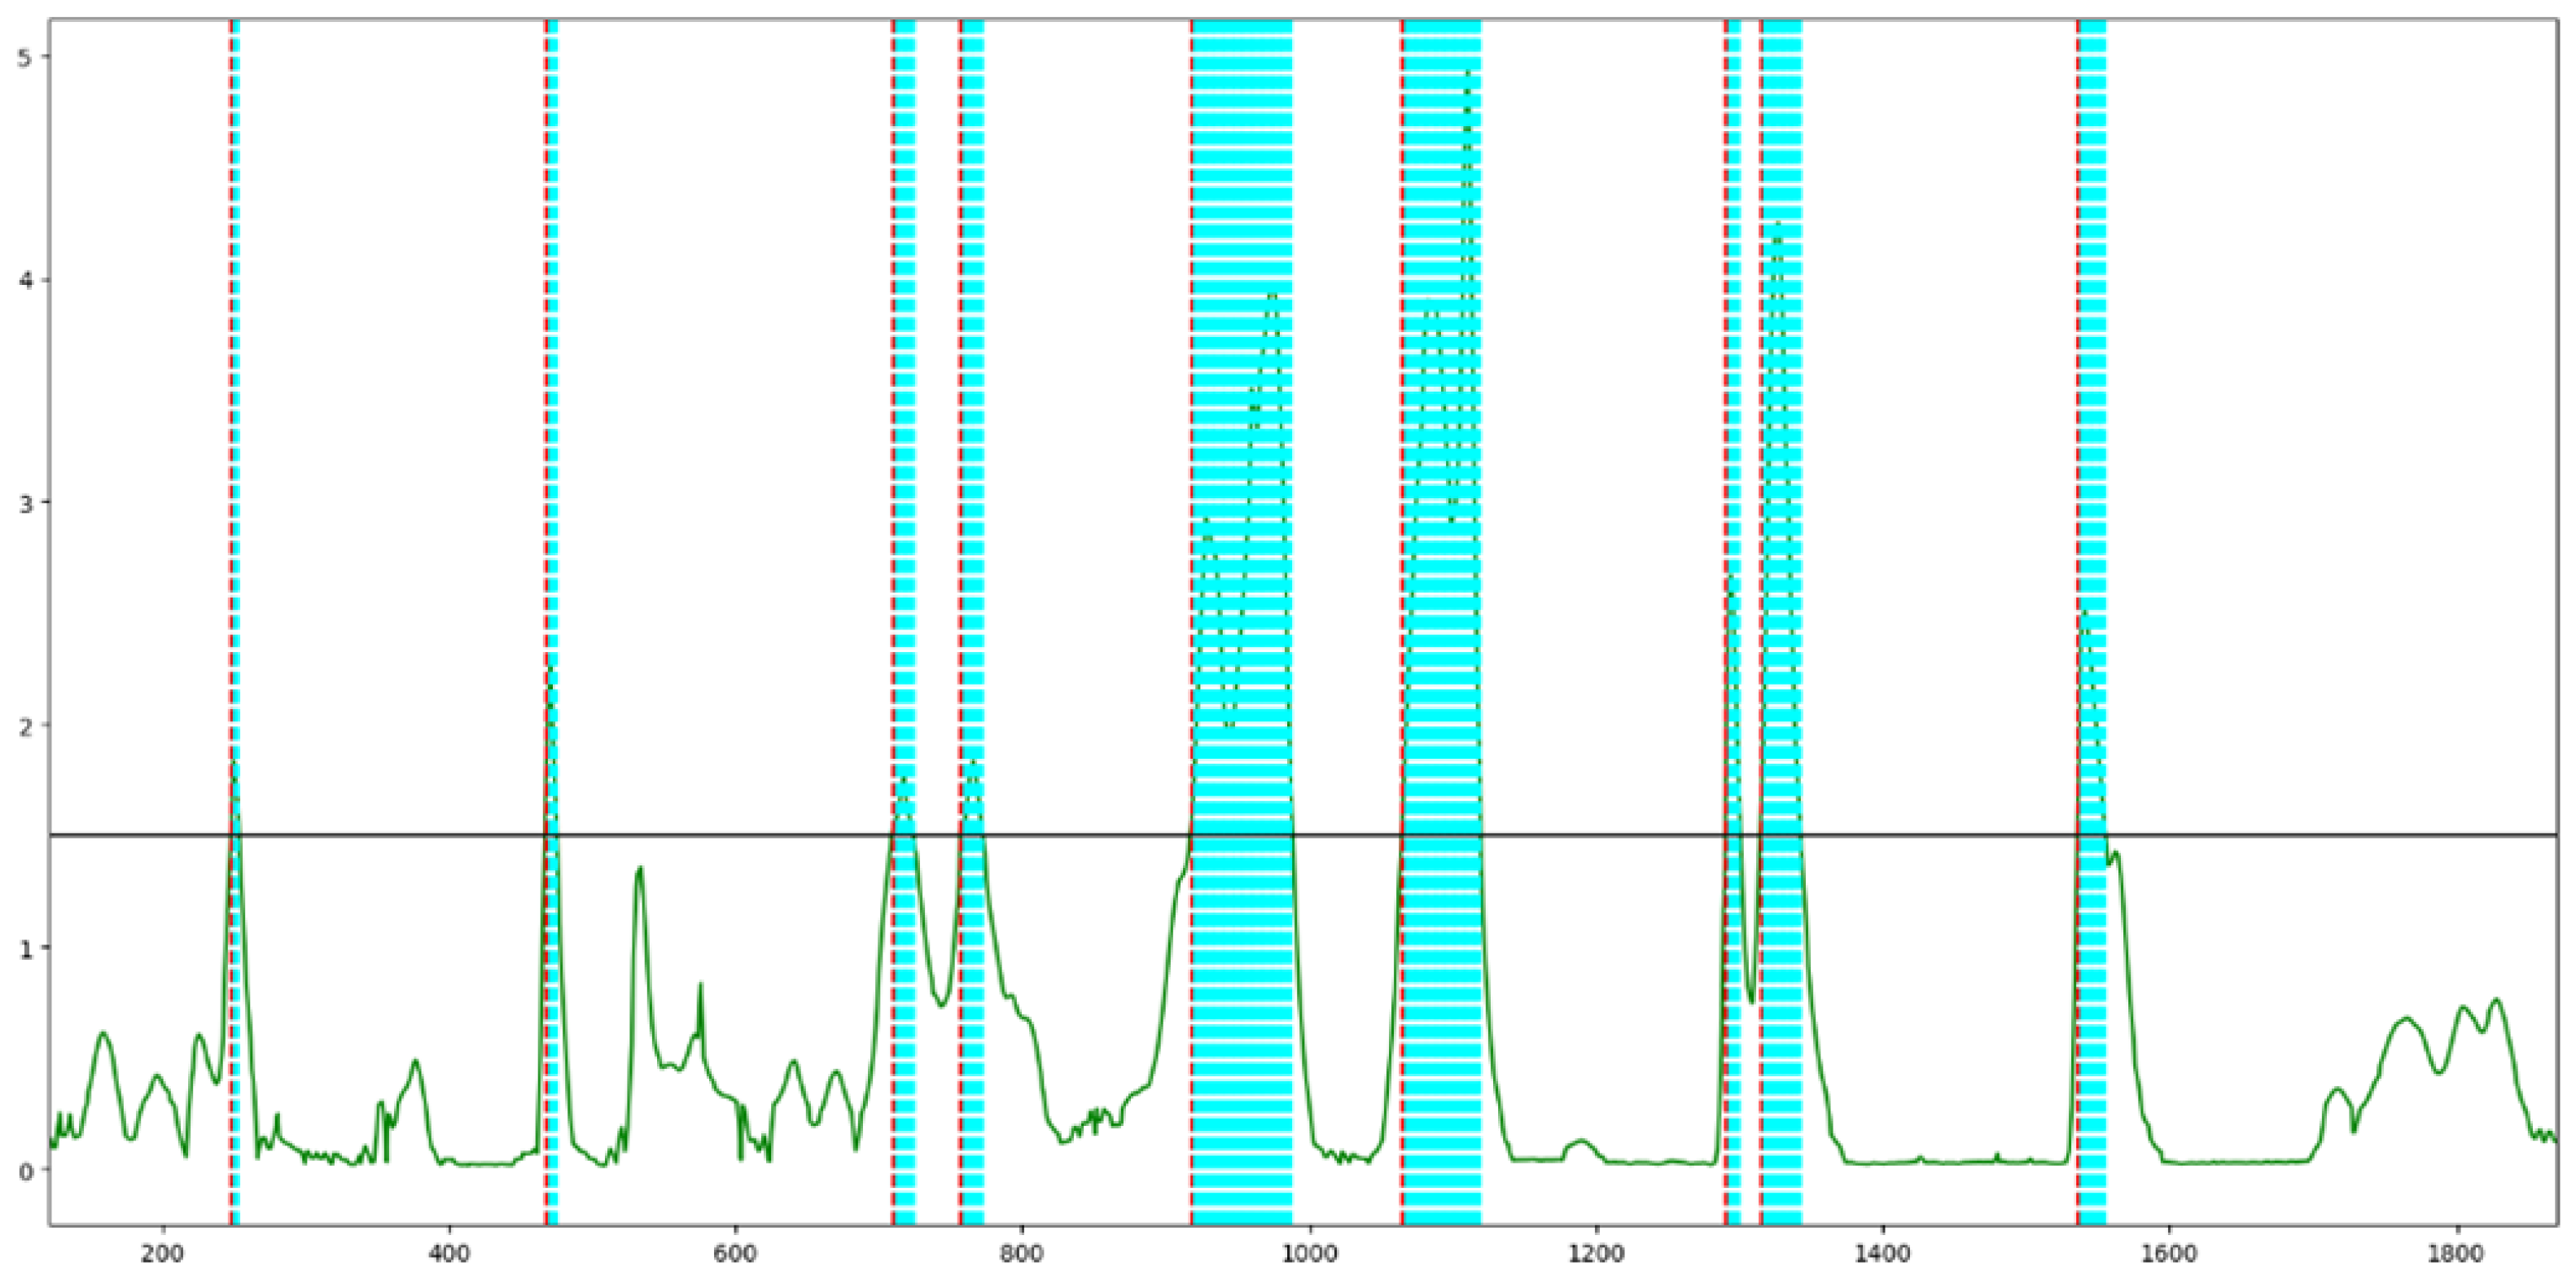
In Figure 2, an interval of the real signal in green associated with the proportion of Pentanes in the production of Butane is presented. The red vertical line indicates the first point where the proportion has exceeded the limit set at (black horizontal line). Finally, the cyan line corresponds to all points where the real signal exceeds said limit.
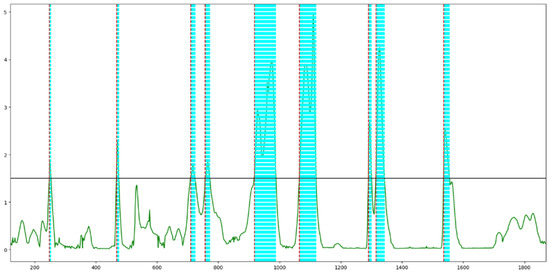
Figure 2.
Real signal associated with the proportion of Pentanes in the production of Butane. Black horizontal line indicates the limit. Cyan line: points that exceed the limit. Red line: first point that exceeds the limit per section.
In order to evaluate the results provided by the percentage of Pentanes in Butane prediction system, a set of well-known metrics, slightly modified for the problem at hand, are used: True Positives (TP), False Positives (FP) and False Negatives (FN). For the entire period studied (October 2017–February 2019), a total of 185 points were identified that exceeded the limit of . It should be noticed that the real process has an average offset of around 400 min, which, as contrasted with the domain experts, may vary over time. This fact is considered for calculating the evaluation metrics, named True Positives and False Positives, as follows:
- True positives (TP) and timeTP1: Analyzing the real signal, when it exceeds the limit of , the time that the prediction takes to exceed that value is calculated (timeTP1time). If after 400 min the prediction does not exceed it, it means that the rise in Pentanes has not been detected sufficiently in advance and it is counted as FN.
- True positives (TP), timeTP2 and timeFP: Analyzing the real signal, when it exceeds the limit of , the time that the prediction is ahead in predicting the rise in Pentanes (timeTP2) is calculated. If it exceeds the maximum margin, it is computed as FP and timeFP is calculated, and if it is not exceeded, it is computed as TP and timeTP2 is allocated. When establishing this maximum time margin for timeTP2, it was agreed with the domain experts to consider 460 min (400 + 60).
Table 1 shows the results obtained by the application of the RF algorithm and the RF followed by a Savitzky–Golay filter [8] for smoothing the prediction outcome and, thus, reducing the FPs. Note that by increasing the window size, the FPs are reduced at the cost of also reducing the TPs.

Table 1.
Obtained results by employing RF and RF plus Savitzky–Golay filter (SG) with windows sizes w = {3, 7, 21}.
With the aim of investigating new alternatives that could improve the RF prediction system, a detailed analysis of the data and results was performed and the following conclusions were obtained: On the one hand, the limitation of imposing a constant offset of 400 min for all variables is too strict. As verified during the validation, there is an average offset of 400 min. Although for most of the peaks the offset is between 350 to 450 min, it is not always 400 min. On the other hand, during the analysis, it is observed that the concentration of Pentane at 400 min seems to be influenced by the previous values of Pentane concentration. Therefore, it seems reasonable that if the value of Pentane concentration at the instant of the prediction is incorporated, the results could be improved. As a result of these conclusions, the following two new implementations are tested in order to see if they improve the results of FP/TP ratio:
- RF model implementation 1: introducing the previous values of Pentane concentration.
- RF model implementation 2: introducing different offsets in the process variables (offsets from −450 to −350 min) together with the previous values of Pentane concentration.
These two RF model implementations are validated for the month of January 2020. In order to compare the results with the previous ones, the FP/TP ratio is used.

Table 2.
Obtained results by employing RF model implementation 1 and RF model implementation 1 followed by a Savitzky–Golay filter (SG) with windows sizes w = {3, 5, 7, 9, 11, 21}.

Table 3.
Obtained results by employing RF model implementation 2 and RF model implementation 2 followed by a Savitzky–Golay filter (SG) with windows sizes [3, 5, 7, 9, 11, 21].
After analyzing the results for both RF model implementations, the following conclusions are obtained:
- RF model implementation 1 reduces the number of FPs up to window 11.
- RF model implementation 2 reduces the number of FPs up to window 9.
- The best approximation is that of RF model implementation 2 with SG of window 5 as it provides the best FP/TP ratio and timeTP.
- The best solutions for both approaches allow capturing 5-6 TPs out of a total of 8, generating 3-4 FPs.
- The FP/TP ratio is still quite high, around . That is to say, for approximately every 3 TPs we capture, 2 FPs are generated.
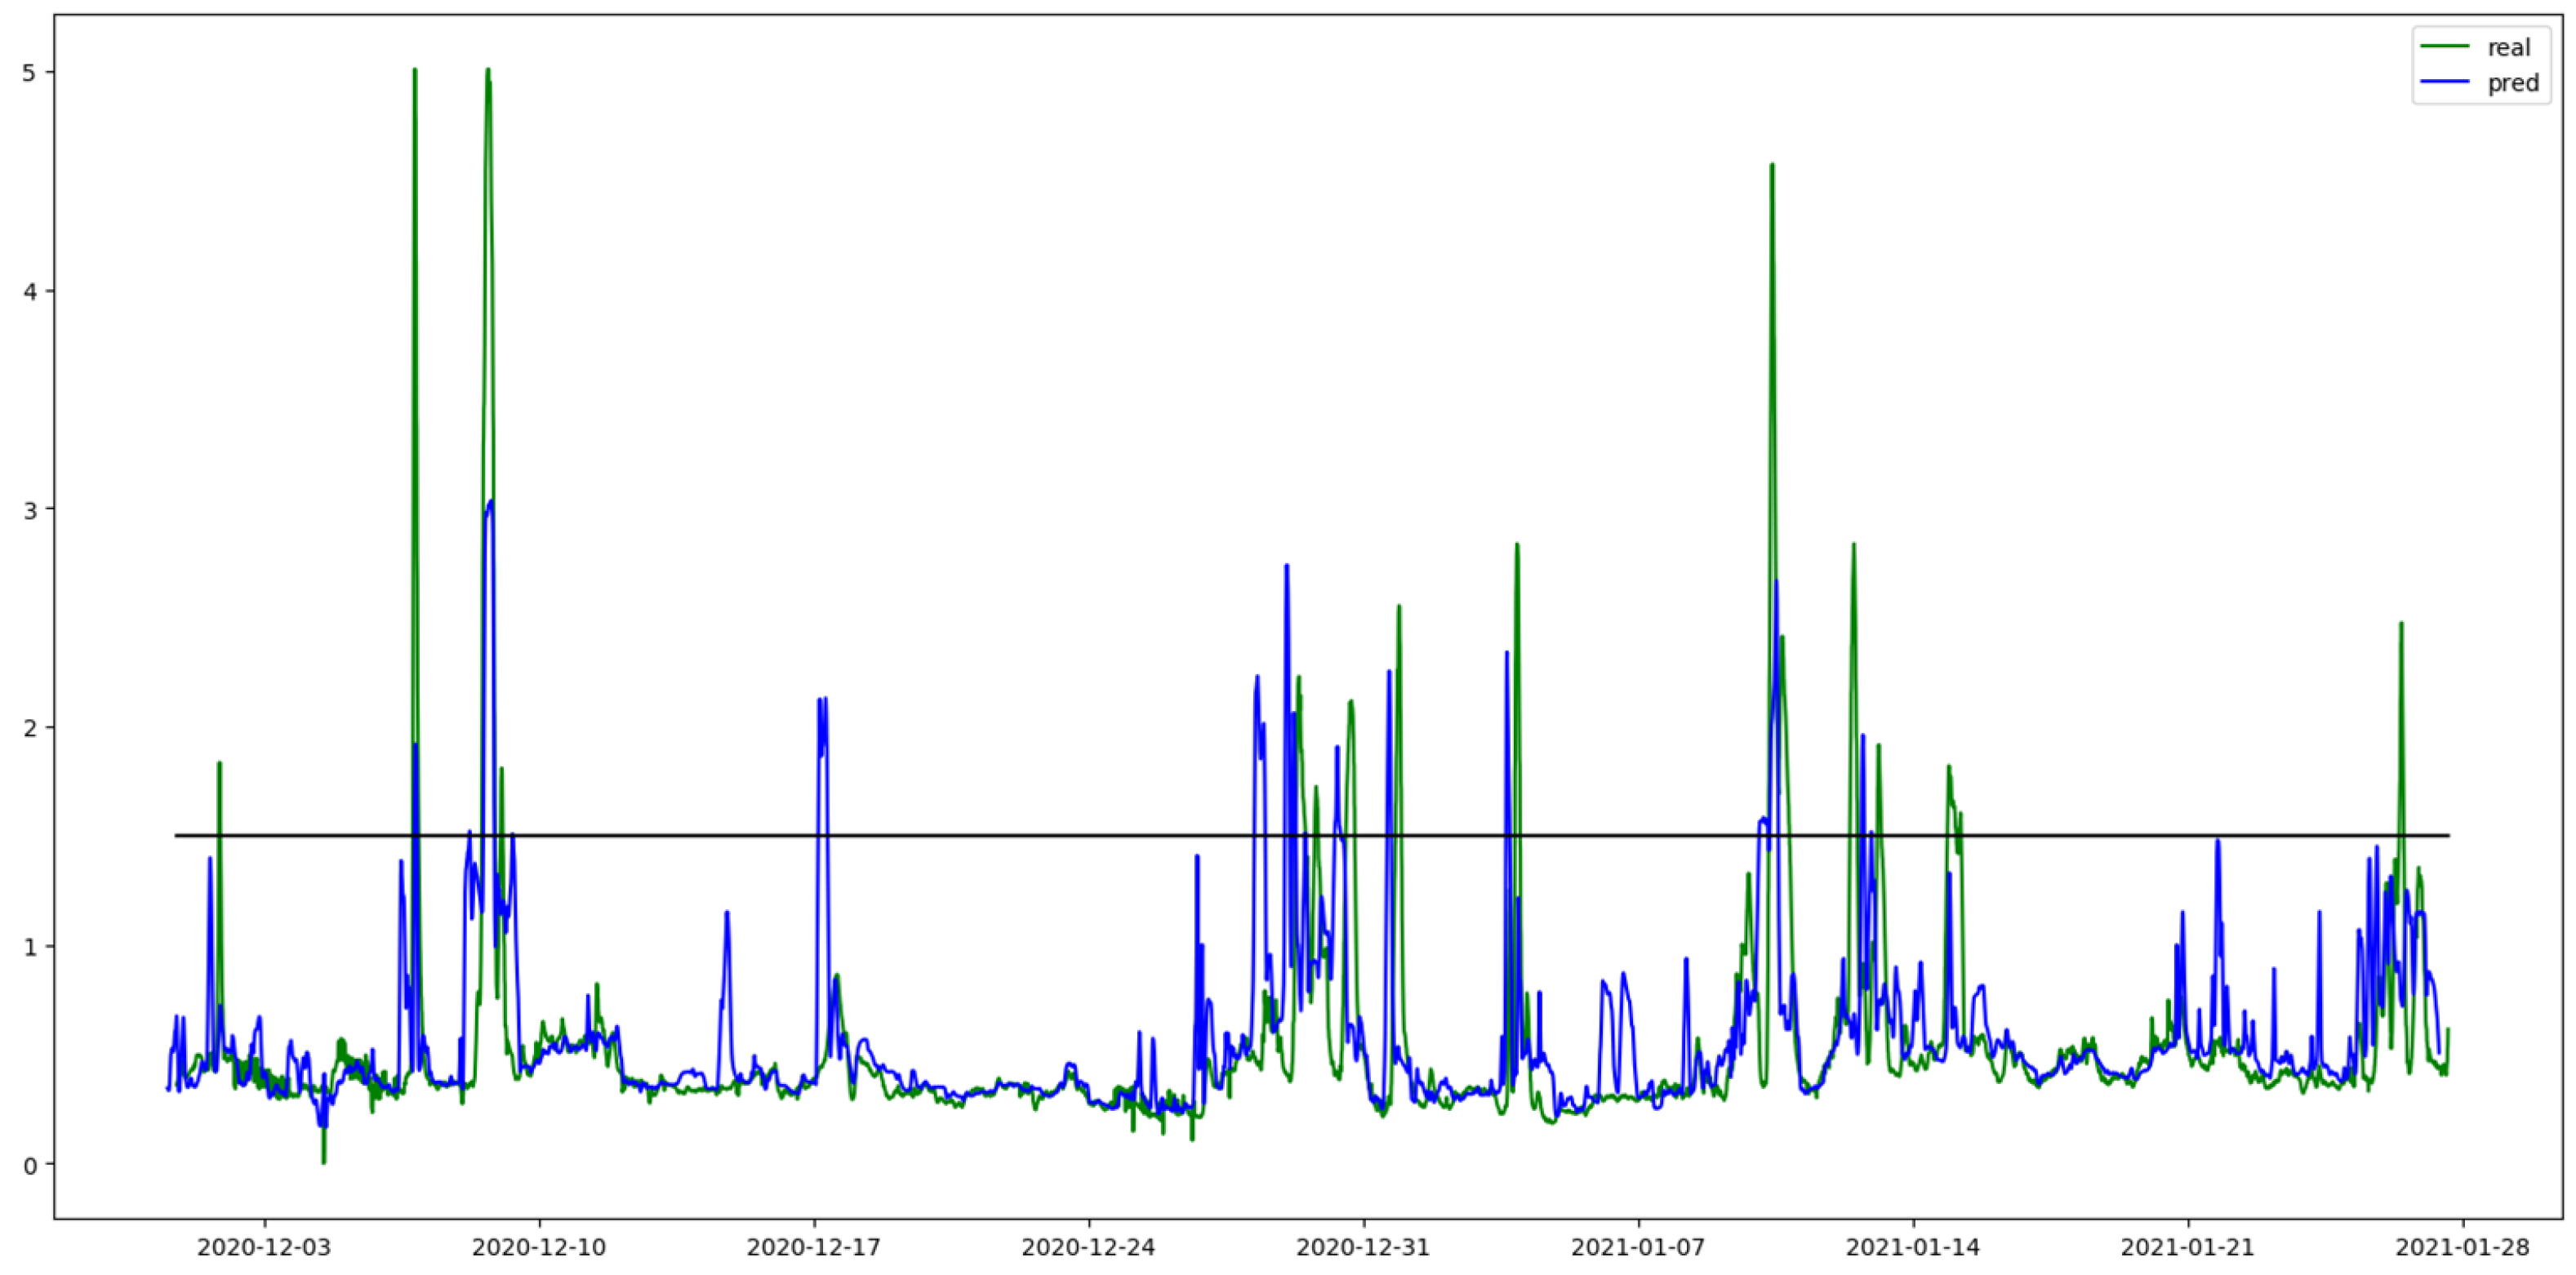
Finally, RF model implementation 2 is set online with SG of window 5 from 1 December 2020 to 26 January 2021. Figure 3 and Table 4 depict the obtained results.
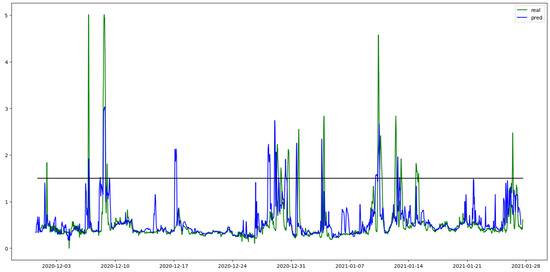
Figure 3.
Online validation from 1 December 2020 to 26 January 2021. The real Pentane concentration signal is in green color and the predicted one in blue color.

Table 4.
Obtained online validation results by employing RF model implementation 2 and RF model implementation 2 plus Savitzky–Golay filter (SG) with window size w = 5.
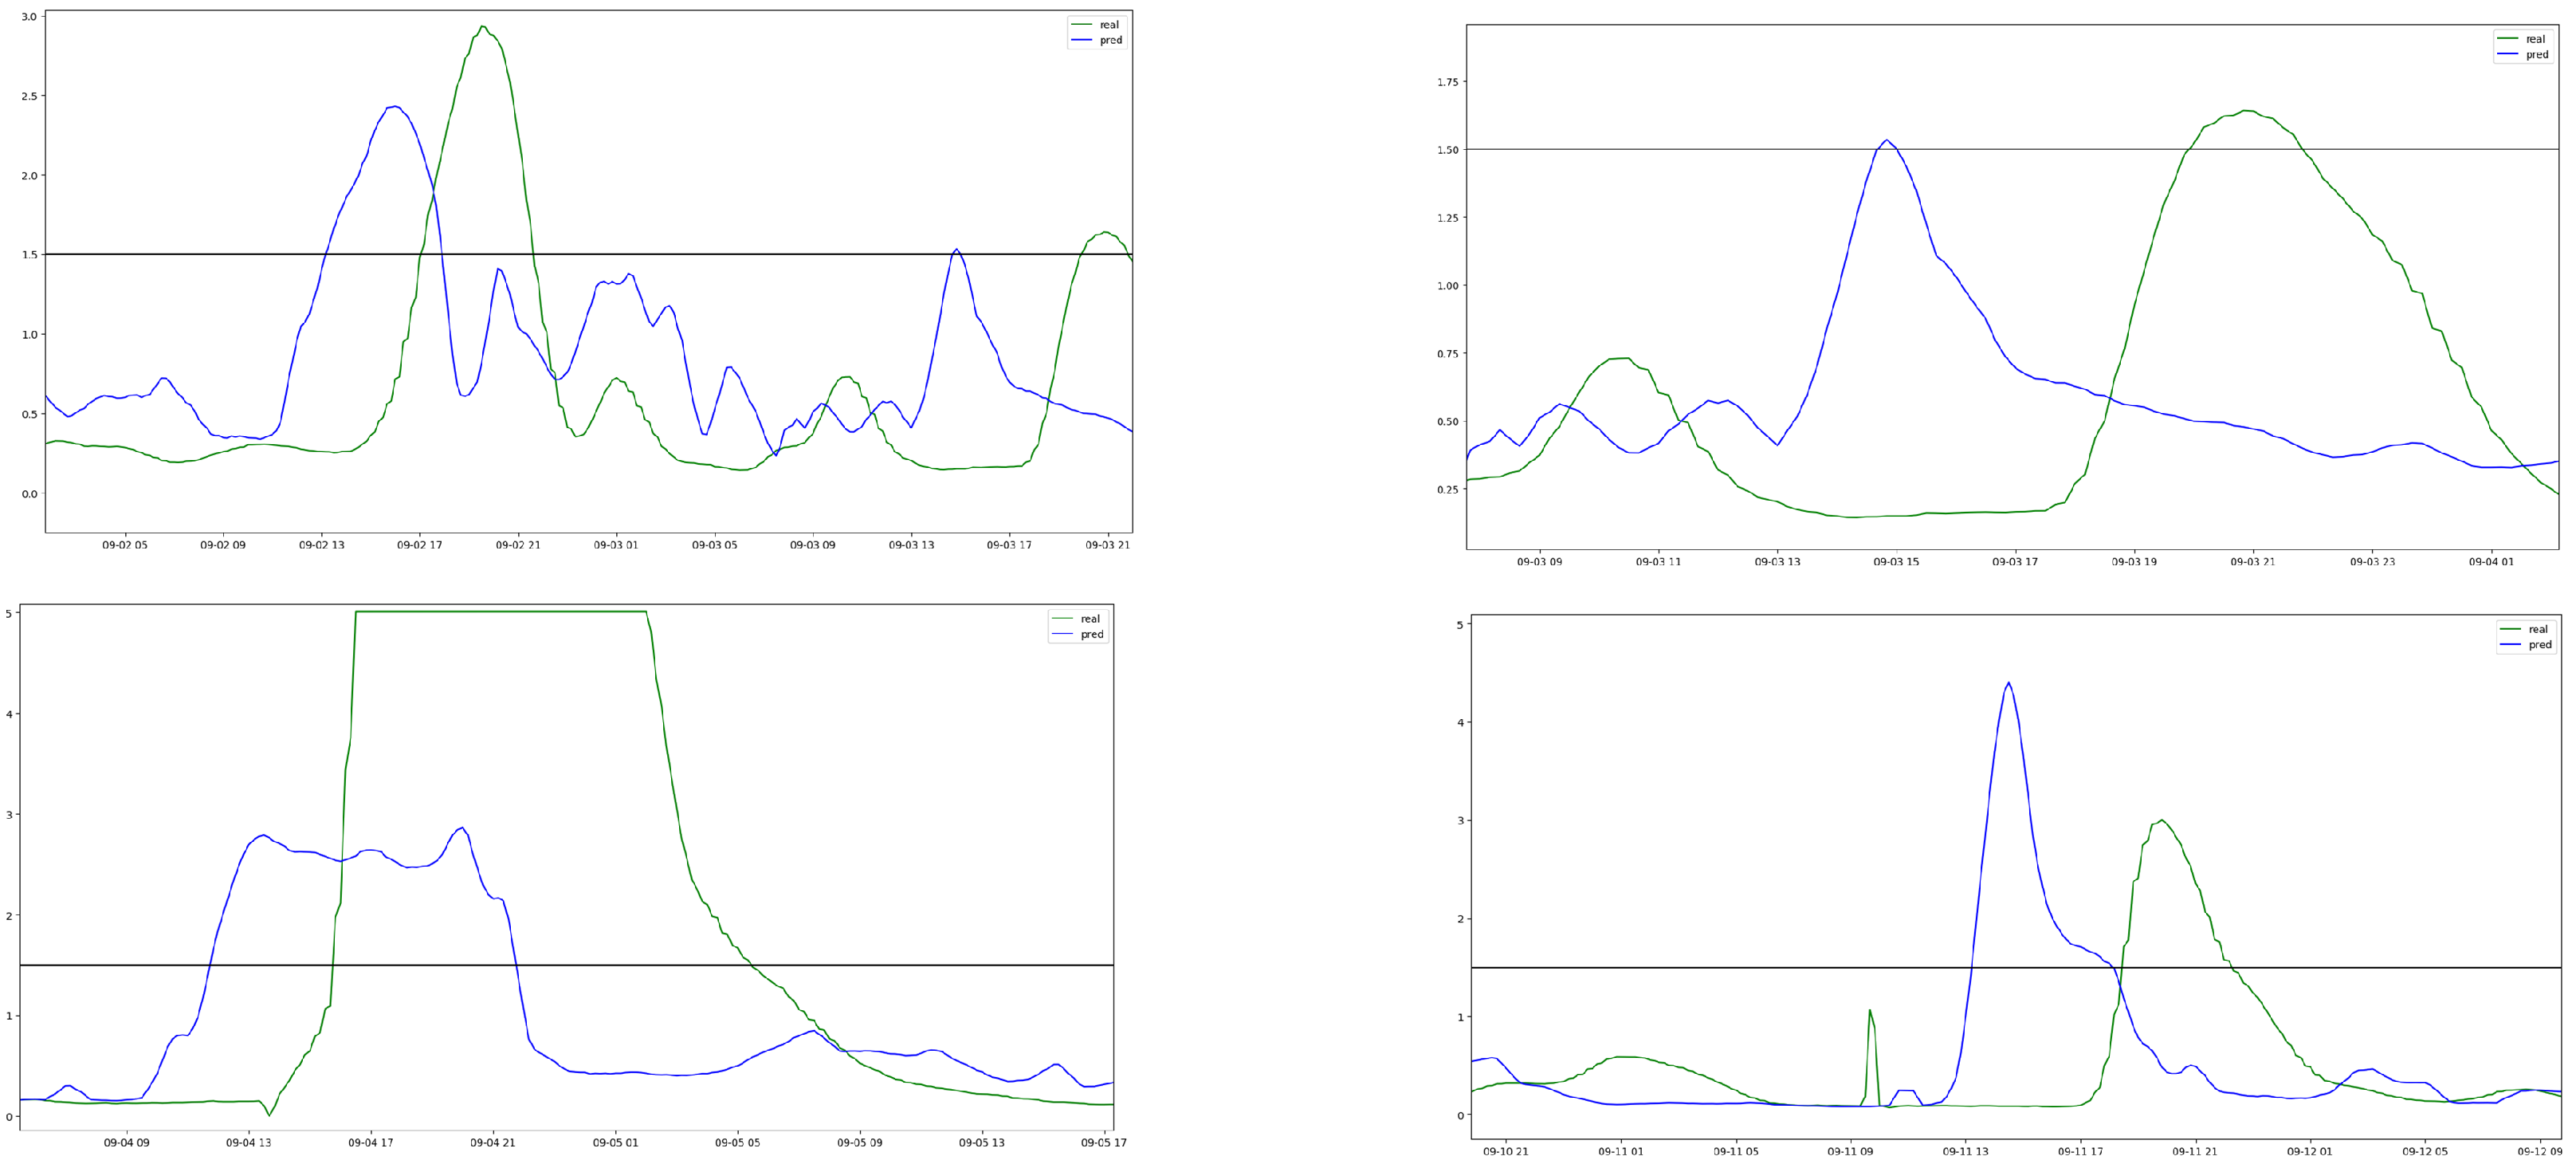
Figure 4 shows four examples of detection of the peak of Pentane concentration. As observed, the peak is detected in advance; so, the operators can take proper actions to minimize the consequences of that Pentane concentration peak.
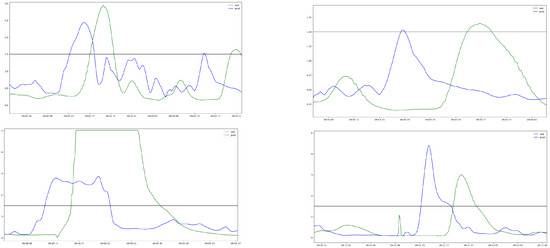
Figure 4.
Examples of Pentane concentration peak detection. Green signal is the real one and blue signal is the predicted one.
4. Conclusions
This paper proposes a Pentane concentration prediction system based on ML techniques capable of detecting the quality of the Butane at the end of the debutanizer column 400 min in advance. Specifically, a Random Forest (RF) regressor followed by a Savitzky–Golay filter is proposed. The prediction system is validated offline with data from October 2017 to February 2019 employing a sliding window training strategy; it has also been tested online, providing acceptable results. Obtained results show that the proposed system is able to predict Pentane concentration peaks that occur in recent similar behaviors. However, when new behaviors suddenly appear, the system is not able to learn those behaviors fast enough and predict the peaks in advance.
In order to face this situation, future steps will be devoted to collaborating with the process operators and analyzing the possibility of eliminating some false positives with some extra process information, such as the crude composition.
Author Contributions
Conceptualization, I.L-T.; methodology, D.M., I.L.-T. and E.M.; software, D.M. and E.M.; validation, D.M., I.L-T. and E.M.; formal analysis, D.M. and E.M.; investigation, D.M. and E.M.; resources, I.L.-T.; data curation, D.M.; writing—original draft preparation, D.M.; writing—review and editing, D.M., I.L.-T. and E.M.; visualization, D.M. and E.M.; supervision, I.L.-T.; project administration, I.L.-T.; funding acquisition, I.L.-T. All authors have read and agreed to the published version of the manuscript.
Funding
This research received no external funding.
Institutional Review Board Statement
Not applicable.
Informed Consent Statement
Not applicable.
Data Availability Statement
Restrictions apply to the availability of these data. Data was obtained from Petronor Innovación S.L.
Conflicts of Interest
The authors declare no conflict of interest.
References
- Köksal, G.; Batmaz, İ.; Caner, M.; Testik, F. A review of data mining applications for quality improvement in manufacturing industry. Expert Syst. Appl. 2011, 38, 13448–13467. [Google Scholar] [CrossRef]
- Saihi, A.; Awad, M.; Ben-Daya, M. Quality 4.0: Leveraging Industry 4.0 technologies to improve quality management practices—A systematic review. Int. J. Qual. Reliab. Manag. 2023, 40, 628–650. [Google Scholar] [CrossRef]
- Zhang, R.; Jin, Q. Design and Implementation of hybrid modeling and PFC for oxygen content regulation in a coke furnace. IEEE Trans. Ind. Inform. 2018, 14, 2335–2342. [Google Scholar] [CrossRef]
- Wang, K.; Shang, C.; Yang, F.; Jiang, Y.; Huang, D. Automatic hyper-parameter tuning for soft sensor modeling based on dynamic deep neural network. In Proceedings of the IEEE International Conference on Systems, Man, and Cybernetics (SMC), Banff, AB, Canada, 5–8 October 2017; pp. 989–994. [Google Scholar]
- Niño-Adan, I.; Landa-Torres, I.; Manjarres, D.; Portillo, E.; Orbe, L. Soft-Sensor for Class Prediction of the Percentage of Pentanes in Butane at a Debutanizer Column. Sensors 2021, 21, 3991. [Google Scholar] [CrossRef] [PubMed]
- Yuan, X.; Huang, B.; Wang, Y.; Yang, C.; Gui, W. Deep learning-based feature representation and its application for soft sensor modeling with variable-wise weighted SAE. IEEE Trans. Ind. Inform. 2018, 14, 3235–3243. [Google Scholar] [CrossRef]
- Breiman, L. Random Forests. Mach. Learn. 2001, 45, 5–32. [Google Scholar] [CrossRef]
- Savitzky, A.; Golay, M.J.E. Smoothing and Differentiation of Data by Simplified Least Squares Procedures. Anal. Chem. 1964, 36, 1627–1639. [Google Scholar] [CrossRef]
Disclaimer/Publisher’s Note: The statements, opinions and data contained in all publications are solely those of the individual author(s) and contributor(s) and not of MDPI and/or the editor(s). MDPI and/or the editor(s) disclaim responsibility for any injury to people or property resulting from any ideas, methods, instructions or products referred to in the content. |
© 2023 by the authors. Licensee MDPI, Basel, Switzerland. This article is an open access article distributed under the terms and conditions of the Creative Commons Attribution (CC BY) license (https://creativecommons.org/licenses/by/4.0/).

